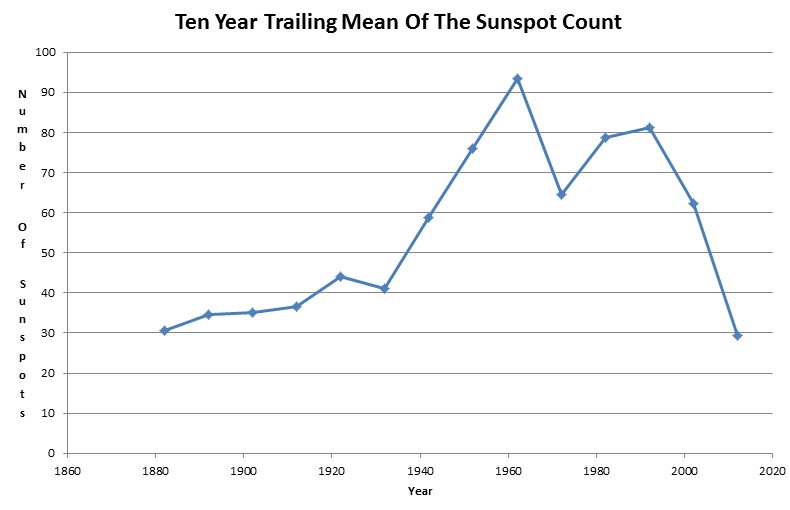
This graph shows why some at NOAA and GISS had to start massive data tampering after the year 2000. Their scam is doomed, they have no useful skills as human beings, and they want to keep stealing taxpayer money for as long as they can.
Disrupting the Borg is expensive and time consuming!
Google Search
-
Recent Posts
- Gaslighting 1924
- “Why Do You Resist?”
- Climate Attribution Model
- Fact Checking NASA
- Fact Checking Grok
- Fact Checking The New York Times
- New Visitech Features
- Ice-Free Arctic By 2014
- Debt-Free US Treasury Forecast
- Analyzing Big City Crime (Part 2)
- Analyzing Big City Crime
- UK Migration Caused By Global Warming
- Climate Attribution In Greece
- “Brown: ’50 days to save world'”
- The Catastrophic Influence of Bovine Methane Emissions on Extraterrestrial Climate Patterns
- Posting On X
- Seventeen Years Of Fun
- The Importance Of Good Tools
- Temperature Shifts At Blue Hill, MA
- CO2²
- Time Of Observation Bias
- Climate Scamming For Profit
- Climate Scamming For Profit
- Back To The Future
- “records going back to 1961”
Recent Comments
- conrad ziefle on Gaslighting 1924
- Robertvd on Gaslighting 1924
- conrad ziefle on Gaslighting 1924
- arn on Gaslighting 1924
- Gordon Vigurs on Gaslighting 1924
- Bob G on Climate Attribution Model
- conrad ziefle on Climate Attribution Model
- Ohio Cyclist on Climate Attribution Model
- Bob G on Climate Attribution Model
- Bob G on Climate Attribution Model


As it goes even lower you can expect even more “Clucking” from the Chicken Little Brigade! If Livingstone and Penn are correct, it should flat line at zero for a fer decades!
I tend to equate the current conditions to those that ended the Minoan Warm period, the Roman Warm Period, and the Medieval Warm Period. Just another phase in the transition from the Holocene Optimum toward the coming glaciation! Our Climate Experts forgot about LAG and the “Tipping Point” was reached close to 1998, give or take a few years.
If you have a pot of water boiling on the stove and remove it from the heat, it continues to boil for a few minutes, LAG! It also takes a while for it to reach room temperature again.Someone has been fudging the temperature reports so others can not see reality. Better records would have resulted in loss of funding for the Chicken Little Brigade.
Why does it take only a few hours after sunrise for the atmosphere to respond to increases in Irradiance but the supposed extra few % has a multidecadal lag?
Almost all of the surface heat content is in the ocean, and even the atmosphere takes months to equilibrate. The mass of the atmosphere is equal to 10 metres of water. Does 10 metres of water change much overnight?
Eco worriers now use that excuse too to explain why GHG’s don’t warm the atmosphere immediately as the physics would suggest. It’s a great idea because it can explain nearly anything.
There is no question that it is true. Previous solar minimums have preceded the temperature drop by a decade or two.
Will:
Warming also tends to happen faster than cooling! It takes much less time to warm a pot of water than to cool it off after you remove the heat.
Heat flow is driven by differences in temperature. It doesn’t make any difference if the temperature is rising or falling.
Very True!
My global warming buddies tell me the sun has no impact on climate. It will be an interesting opportunity to test the cosmic ray theory, well that depends on heads of certain laboratories allowing maverick scientists to look into this forbidden realm – do not speak of cosmic rays as they lead to denial!
I saw this interesting article:
http://www.dailymail.co.uk/sciencetech/article-2290289/NASA-warns-unexpected-happening-Sun-year-supposed-peak-sunspot-cycle.html
Alarmists would rather spew mindless crap like “Chinese aerosols” to explain the recent recline in temperature, rather than doing any actual science.
Looks more like Jaws coming up to bite them on their asses.
Where did you get this data from?
http://web.archive.org/web/20090620192151/http://science.msfc.nasa.gov/ssl/pad/solar/greenwch/spot_num.txt