
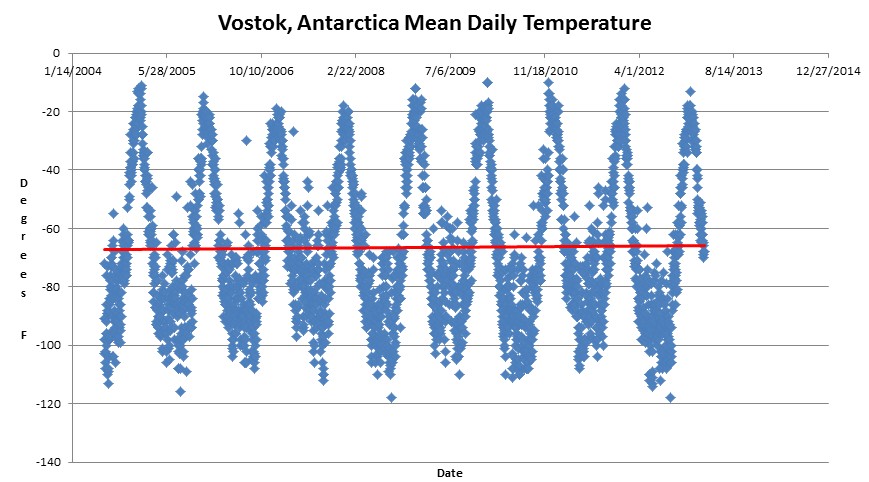
Vostok, Antarctica averages about -65F. Their warmest day since 2004 averaged -10F. Their coldest day was September 16, 2012 – and averaged -118F.
Weather Forecast Vostok, Antarctica | Vostok Weather | Wunderground
Vostok, Antarctica averages about -65F. Their warmest day since 2004 averaged -10F. Their coldest day was September 16, 2012 – and averaged -118F.
Weather Forecast Vostok, Antarctica | Vostok Weather | Wunderground

It is hard to visualize a death spiral when the temperature never gets near the freezing point. It is not like Summit, Greenland where, due to heteronomative white males, it got up to + 2 for two hours. Those two hours of evil heat caused Greenland to lose 97% of its ice, according to peer review by 97% of top climate experts, of which 97% use Ivory Soap.
97% of climate scientists who chew gum, recommend not walking at the same time. 😉