
COI | Centre for Ocean and Ice | Danmarks Meteorologiske Institut

Disrupting the Borg is expensive and time consuming!

Google Search
-
Recent Posts
- Bullseye!
- It’s Getting Closer
- Greenland Meltdown Scam
- Greenland Ice Update
- Wyoming Gold
- Three Years Since The Apocalypse
- Arctic Report card Summer 2026
- Elon Pushing Pushing Geoengineering
- Earth, Wind And Fire
- On The Road Again
- Vandalism At The Reflecting Pool
- Fifty Years Ago Today
- Truth Or Consequences
- US Climate Trend Maps
- Declining Spring Snow Cover In Northern New Mexico
- You Can’t Fool Mother Nature
- Cattle And The Climate
- One Atomic Bomb Per Hour
- New Video : Analyzing Oil And Gas
- Is Antarctica Melting?
- High Speed Analysis And Visualization
- El Nino To The Rescue?
- Fake News Update
- Growth Of Antarctic Sea Ice
- 65 Years Of Progress!
Recent Comments
- arn on Greenland Ice Update
- D. Boss on Bullseye!
- D. Boss on Bullseye!
- scott allen on Bullseye!
- scott allen on Bullseye!
- John Francis on Greenland Ice Update
- Bob G on Bullseye!
- D. Boss on Bullseye!
- Bob G on Bullseye!
- Bob G on Bullseye!
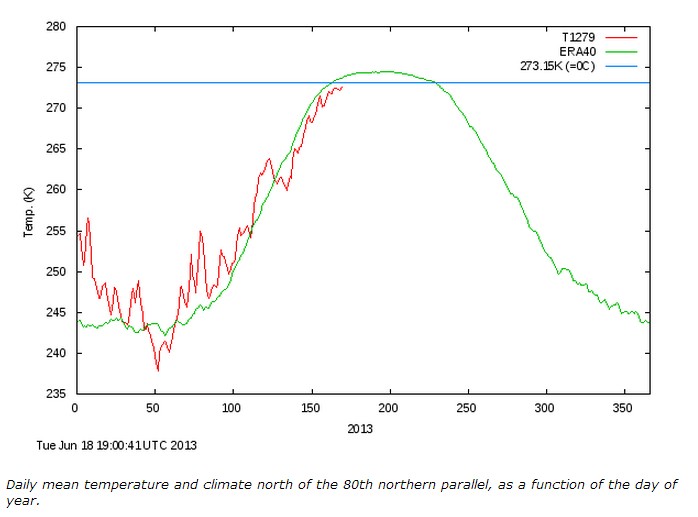
Will it or won’t it? Will the Arctic temperature:
• Break 0°C (273°K)?
• Descend more rapidly than the mean?
• Stay below the mean for the remainder of the year?
And, if all this comes to pass, what (if anything) presage for the NH weather this winter?
Death spiral is confused.
http://sunshinehours.wordpress.com/2013/06/19/death-spiral-in-the-arctic-confusion-2013-is-1000000-sq-km-higher-than-2010/
Antarctic sea ice is rising. Now arctic sea ice is also rising, the warmists are fiddling the numbers.
Arctic sea ice is declining: http://arctic.atmos.uiuc.edu/cryosphere/IMAGES/seaice.recent.arctic.png
Arctic sea ice is still rising: http://ocean.dmi.dk/arctic/old_icecover.uk.php
They cannot both be true.
Dating of the data set may not be exactly in sync. Also, different measures of sea ice extent are used. I.e., one group might define open water as less than 15% sea ice and another group might use a different definition.
Will, not only that….they’ve changed in mid steam too
same group has changed the way they measure
Both charts show a sharp decline beginning about April, thru May and June. Which is normal for Arctic ice every year. I think what’s confusing you may be the German custom of writing dates with the day first, next the month… i.e. 1/4 is April 1, not January 4.
Secondly, as to the claim “the warmists are fiddling with the numbers”. Citation, please?
Blame Germany
Germany the new North Korea
The only light in the side streets is the weak flickering of TVs seen through living room windows.
http://www.spiegel.de/international/germany/german-communities-forced-to-find-creative-ways-to-reduce-debt-a-906478.html
This is how ‘Green’ looks. Windmills and Solar.
Soon in every city in the EU.