
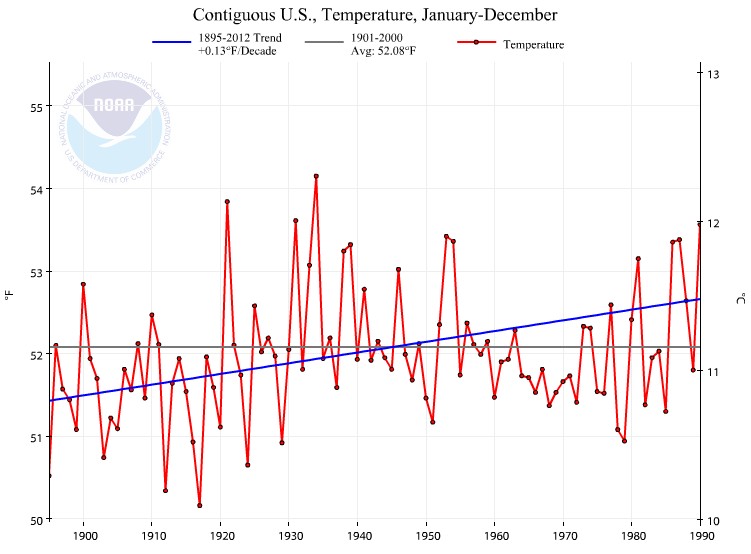
NCDC reports that July was the 30th warmest on record in the US, and that July temperatures have increased by about 1F since 1895.
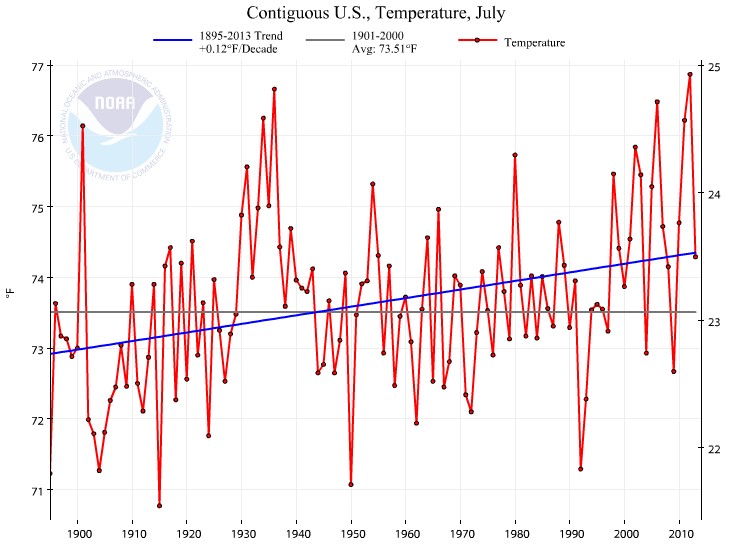
The thermometer data they used (prior to data tampering) showed that July was the 71st warmest, and that there has been no change in July temperatures since 1895. The animation below shows how they have created a completely fake warming trend by good old fashioned data tampering.
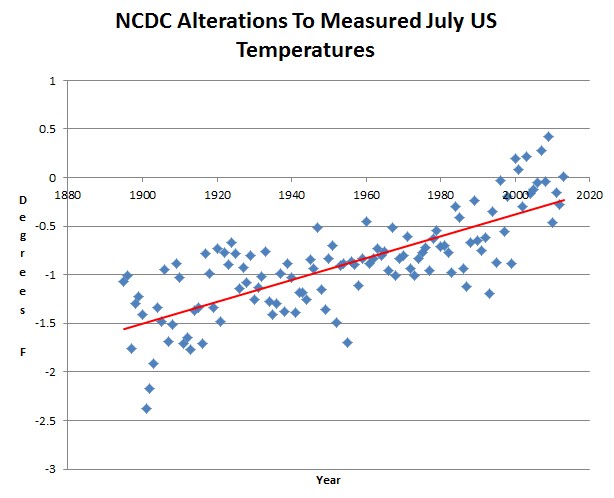
The next graph shows how they have systematically cooled the past and warmed the present – to create a non-existent warming trend.
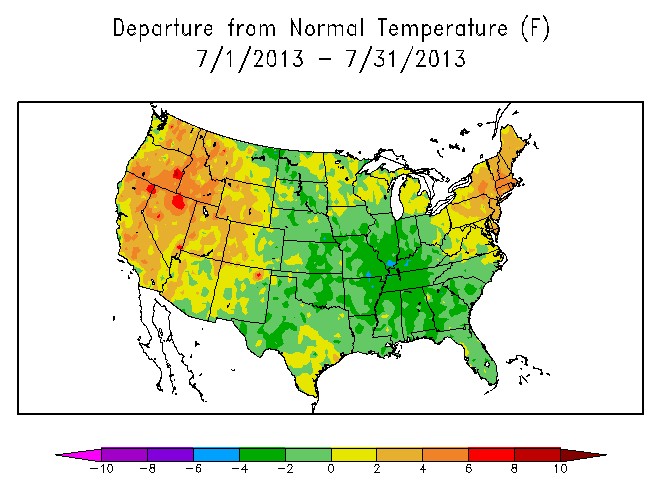
Most of the country was below normal last month, yet NCDC gave July a top 25% ranking for warmth.
Now compare vs. July 1939 – which NCDC says was about the same as July 2013. Almost the entire country was hot in July, 1939.
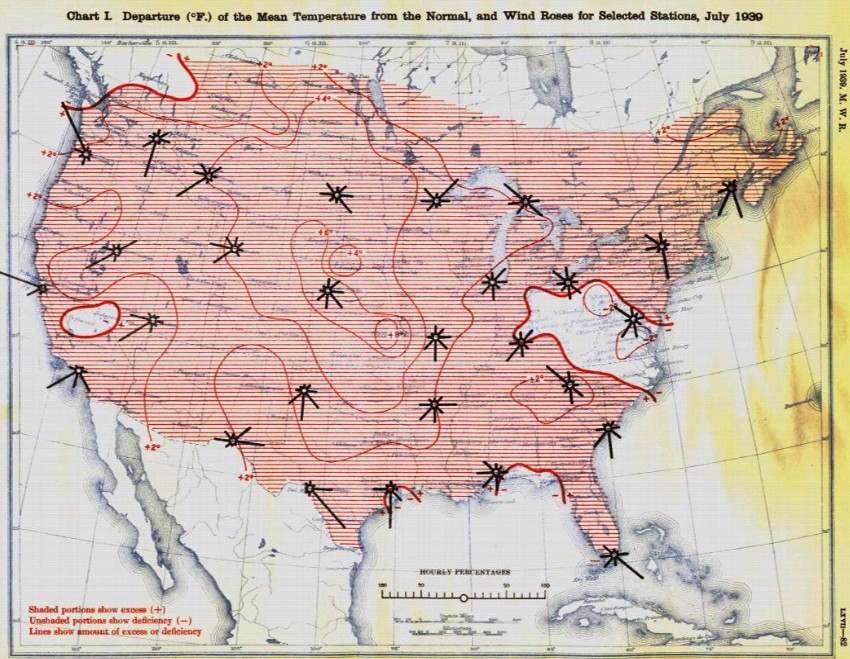
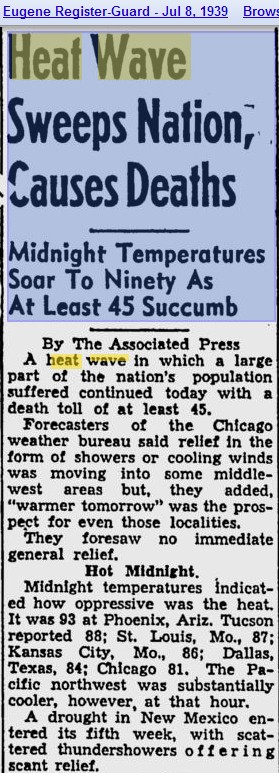
Many people died in the July 1939 heatwave, which NCDC says was about the same temperature as the very cool month of July 2013.
The bottom line is that US temperatures as reported by NCDC and NOAA are complete garbage. They are generated for political purposes and have nothing to do with science.
In 1989, NOAA and CRU said that there had been no warming in the US over the past century.
February 04, 1989
Last week, scientists from the United States Commerce Department’s National Oceanic and Atmospheric Administration said that a study of temperature readings for the contiguous 48 states over the last century showed there had been no significant change in average temperature over that period. Dr. (Phil) Jones said in a telephone interview today that his own results for the 48 states agreed with those findings.
Yet now they show a lot of warming over the same period.
Welcome to Orwell’s 1984. The US government is rewriting the past to suit the desires of the White House.

Reblogged this on Climate Ponderings and commented:
Thank you!
Would it be possible for you to assemble a detailed dossier of these manipulations .submit it to the appropriate US House committe and then have them demand a complete independent investigation and audit of the NCDC data.
Outstanding idea! Hansen should be thrown out along with all his minions.
I applaud Steve’s efforts. He has compiled quite a lot. Not only should somebody present these facts to the appropriate House Committee–but also the Democrat-controlled Senate Committee on Environment and Public Works.
Majority members:
Barbara Boxer (Chairman)
Max Baucus
Thomas R. Carper
Benjamin L. Cardin
Bernard Sanders
Sheldon Whitehouse
Tom Udall
Jeff Merkley
Kirsten Gillibrand
Mazie K. Hirono
Senate Minority Committee Members:
David Vitter
James M. Inhofe
John Barrasso
Jeff Sessions
Mike Crapo
Roger F. Wicker
John Boozman
Deb Fischerut
But I don’t know if Steve wants to become a public figure. I know I wouldn’t.
IMHO
They are not interested in facts or truth. Are you new here? 😉
Gator is right. They are not interested in the truth, no more than they are interested in giving out accurate budget entries, accurate unemployment figures, or accurate inflation figures. Their entire way of life, their way of seizing power and money depends on their being able to convince you to believe a series of lies.
They cannot be trusted. They are lying, even down to the pronouns and conjunctions. If they say it, it is a lie.
The government is mostly in on the scam.
If they keep the people distracted by global cooling/global warming/climate change/extreme weather, maybe they won’t notice how extremely corrupt and incompetent their government is.
Latitude made a particularly insightful comment over on Suyts blog.
https://suyts.wordpress.com/2013/08/13/is-scott-mandia-the-dumbest-alarmist-and-congrats-to-anthony/#comment-88142
he is exactly right. And the more they monkey with the historical data, the worse their models are going to be.
No problem, they will just keep inventing myths about man made whatevs, on which to blame their latest innacuracies.
Class action is required to get these frauds on the stand in a court of law. They can choose perjury or the truth. Starting with the data tamperers.
It will never happen without violent revolution. We have,through our fascination with cakes and circuses, created a new aristocracy that is above the law.
Reblogged this on Power To The People and commented:
Climate Change Is Not The Problem Energy Poverty Is. High fuel prices = more poverty = more children dying.
Andrew McRae
August 15, 2013
The reason global warming stopped (and IPCC models didn’t predict this) is because the warming was 90% natural to begin with, and it’s amazing how a simple analysis of temperature and sunspot activity can reveal the natural forcings.
Here is the graph the IPCC doesn’t want you to see.
http://www.woodfortrees.org/pl…
The green line is the smoothed sea surface temperature. If you can use the red and blue lines to reconstruct nearly all of the green line, then CAGW is dead in the water. Okay, let’s try it.
Note the blue line is obtained by subtracting from temperature its own 61-year moving average (leaving only frequencies shorter than 61 years), then smoothing that result so all frequencies shorter than 30.5 years are eliminated. The incredibly precise sine curve which remains is proof that a 61 year natural cycle in temperature was operating in the 20th century. Also note it is present through the entire 160 year temperature record, but the averaging windows prevent the ends of this underlying signal from being drawn. Imagine extending the sine curve forward in time and two interesting features result. Firstly the cooling trend would end in 1972 (yes it did), and 30 years of warming would have followed, ENDING in 2002 (yes it did).
That is what would have happened due to a natural oceanic cycle in temperature even if all solar factors had been equal.
Now look at the red curve which is a smoothed sunspot count curve. Here is where the Svensmark effect kicks in.
More sunspots => more solar activity => stronger solar magnetic field => less cosmic rays reach earth => less cloud cover => more insolation reaches the oceans => earth heats to a higher equilibrium temperature.
Sunpots were quite low at the turn of the century, so some warming from this point would have been expected anyway. But sunspots escalated to abnormally high levels during the late 20th century, producing higher than normal heating. At the point where the ocean cycle had gone into cooling mode, the sunspots ramped up to high levels, which then counteracted the cooling that would otherwise have happened in the 1950s and 60s. After 1972 the oceanic cycle would again be in warming mode, but the sunspots again ramped up at that time, leading to a double dose of warming. The unusually high rate of warming in the 1980s is then explained qualitatively without needing to imagine any man-made greenhouse effect.
The oceanic cycle is now in cooling mode, but it will take some time for the accumulated “double dose” from the sunspots to be radiated away from the planet, which is why temperatures have flatlined instead of dropping.
The sunpots and ocean cycle are the essence of Dan Pangburn’s climate model which reconstructs the temperature record since 1880 with 90 percent correlation, even with a CO2 sensitivity of zero.
We are now in the situation where sunspots have plummeted down to 1920s levels, and the oceanic cycle is also in cooling mode.
If you had to bet the global economy on warming or cooling for the next 10 years, which would you choose?
Read more here: http://www.kentucky.com/2011/10/26/1934544/group-asks-university-of-kentucky.html#storylink=cpy