
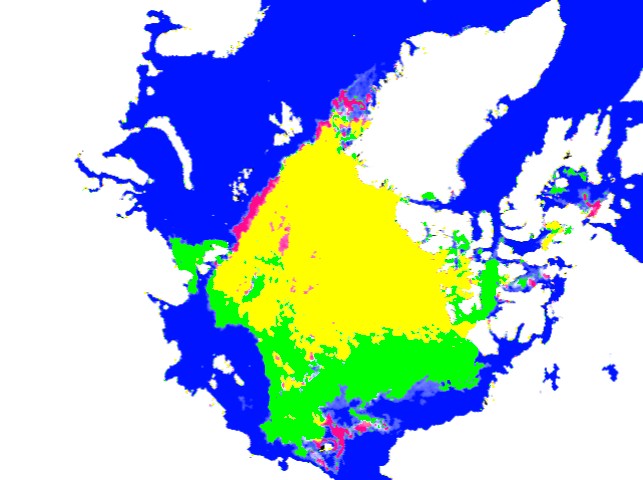
Green shows ice present in 2013 which was not present in 2012. Red shows the opposite.
Disrupting the Borg is expensive and time consuming!

Google Search
-
Recent Posts
- Vandalism At The Reflecting Pool
- Fifty Years Ago Today
- Truth Or Consequences
- US Climate Trend Maps
- Declining Spring Snow Cover In Northern New Mexico
- You Can’t Fool Mother Nature
- Cattle And The Climate
- One Atomic Bomb Per Hour
- New Video : Analyzing Oil And Gas
- Is Antarctica Melting?
- High Speed Analysis And Visualization
- El Nino To The Rescue?
- Fake News Update
- Growth Of Antarctic Sea Ice
- 65 Years Of Progress!
- El Nino To The Rescue?
- Worst March Drought On Record
- ChartGL Process Control Demo
- The Biggest Money Laundering Scam
- Drought In The Headwaters Of Lake Powell
- Unrealistic Expectations Of Water Availability
- Did Bill Gates Do This?
- Worst March Drought On Record In The US
- The Real Hockey Stick Graph
- Analyzing The Western Water Crisis
Recent Comments
- Chuck on Truth Or Consequences
- Gerald Machnee on Fifty Years Ago Today
- conrad ziefle on Fifty Years Ago Today
- Bob G on Truth Or Consequences
- Weylan McAnally on One Atomic Bomb Per Hour
- conrad ziefle on Declining Spring Snow Cover In Northern New Mexico
- Bob G on You Can’t Fool Mother Nature
- Ivan G Wainwright on You Can’t Fool Mother Nature
- conrad ziefle on You Can’t Fool Mother Nature
- Bob G on You Can’t Fool Mother Nature
Gaia Shrugged and left all the warmista shivering in the cold.
Game Over.
“adjustments” will turn this into a net loss. The Borg will not be denied their crisis.
How thick is all that blue ice?
Less than a millimeter. Depends on what kind of screen you are looking at.
Look at the difference in the proximity of the ice to the Alaskan coast. Somebody has decided not to count an awful lot of ice.
http://iceweb1.cis.ec.gc.ca/Prod20/page3.xhtml
Have not noticed the usual alarmist nutcases posting about Arctic ice extent lately.
I’m not able to track on this, Steve, using the linked source. That data seems to show these numbers for August 13, 2012 and 2013:
5178750 6152500
I make that an increase of 18.8%. Can you point me in the right direction?
Incidentally, I’ve updated the MLF spreadsheet; the crew is “pulling” for a very late October arrival, which seems likely to be a drag … over ice. Still technically possible — it might even be easier. But it’s not exactly a Northwest Passage.
===|==============/ Keith DeHavelle
I’m using their maps and comparing with a higher concentration threshold than their 15% calculations.
I will not be assimilated!