

Disrupting the Borg is expensive and time consuming!

Google Search
-
Recent Posts
- Analyzing The Western Water Crisis
- Gaslighting 1924
- “Why Do You Resist?”
- Climate Attribution Model
- Fact Checking NASA
- Fact Checking Grok
- Fact Checking The New York Times
- New Visitech Features
- Ice-Free Arctic By 2014
- Debt-Free US Treasury Forecast
- Analyzing Big City Crime (Part 2)
- Analyzing Big City Crime
- UK Migration Caused By Global Warming
- Climate Attribution In Greece
- “Brown: ’50 days to save world'”
- The Catastrophic Influence of Bovine Methane Emissions on Extraterrestrial Climate Patterns
- Posting On X
- Seventeen Years Of Fun
- The Importance Of Good Tools
- Temperature Shifts At Blue Hill, MA
- CO2²
- Time Of Observation Bias
- Climate Scamming For Profit
- Climate Scamming For Profit
- Back To The Future
Recent Comments
- Bob G on Analyzing The Western Water Crisis
- arn on Analyzing The Western Water Crisis
- Bob G on Analyzing The Western Water Crisis
- Bob G on Analyzing The Western Water Crisis
- Bob G on Analyzing The Western Water Crisis
- Hank Phillips on Analyzing The Western Water Crisis
- Hank Phillips on Analyzing The Western Water Crisis
- Hank Phillips on Analyzing The Western Water Crisis
- Hank Phillips on Analyzing The Western Water Crisis
- Bob G on Analyzing The Western Water Crisis
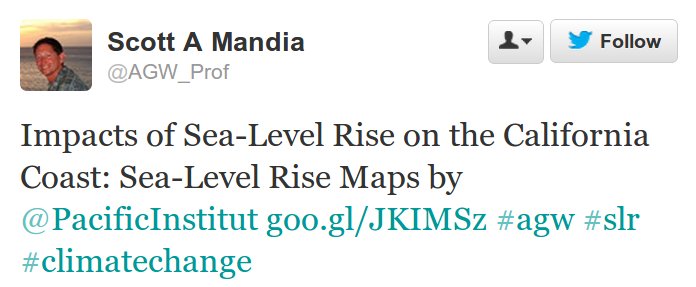
Gleick Works His Digital Magic Again
This entry was posted in Uncategorized. Bookmark the permalink.
“Tide gauges and satellites both show no sea level rise in California for decades.”
That’s why this study by Gleick was “needed.” And Scott Mandia is a tool.
A tool with super powers……..I mean hip boots and a hockey stick.
why would an agw prof need graphs produced by a fantasist?
I resent that remark!
Tide gauges show about 0.7 mm/yr sea level rise for the California coast.
http://www.psmsl.org/data/obtaining/
Since 1980, they show none.
I do hate it when I make stupid errors such as forgetting the dollar sign “$” for denoting absolute values on a simple Excel spreadsheet.
You’re right, I picked 8 representative tide gauge stations north to south down the California coast and averaged up the slope and when I do it right, it comes out to minus -0.04 mm/yr.
Satellites show the same thing.
Steve, Steve Steve, you haven’t adjusted for the PDO, the last few La Nina’s, then it has to be GIA corrected, and you should then smooth out the last couple of decades using a carefully selected start and end point. Once you do that, you’ll see that we’re all doomed. Gleick is prophet.
Steve, that was an excellent reply to the climate kook!
My favorite is the crooks at Scripps in La Jolla whining about sea level rise. They can see The Cove out their window – where there has been no change in sea level for 140 years.