
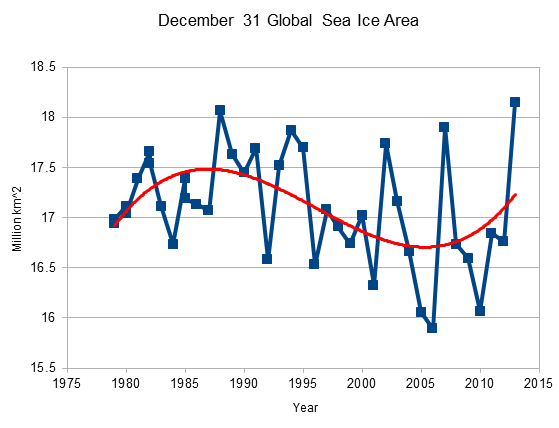
Climate experts say that global warming is melting sea ice faster than expected, which is why the poles currently have the most sea ice ever measured for the date.
arctic.atmos.uiuc.edu/cryosphere/timeseries.global.anom.1979-2008
Climate experts say that global warming is melting sea ice faster than expected, which is why the poles currently have the most sea ice ever measured for the date.
arctic.atmos.uiuc.edu/cryosphere/timeseries.global.anom.1979-2008

“There is a good chance that there will be more sea ice on Earth on January 1, than ever measured before on that date.” Steven Goddard @ ‘Real’ Real Science.
And how many millions of taxpayer dollars did it take for you to produce that very accurate model? I’m going to go out on a limb here and say none.
http://stevengoddard.wordpress.com/2013/12/30/global-sea-ice-area-second-highest-on-record-for-date-closing-in-on-all-time-record/
The data collection was probably quite costly, but analyzing it takes less than 5 minutes.
If you’re competent, and honest (not in the pay of evil forces). Just goes to show even a small furry creature like yourself (inside joke folks, see the image at top of page) can do much good.
Well that explains everything. You think that all the data collection is free. Probably alp believed ObamBam when he said you could keep you doctor, keep you insurance plan and he quit smoking.
I have to say, I am impressed by the scientifically informed responses here. However, NO ONE has mentioned that the sun is coming into it’s 11-year solar MAXIMUM and it just so happens to be the WEAKEST maximum following an incredibly weak 11 year low activity level. All to say that if you watch the sun’s activity, and it has been extremely weak for 12 years now, the earth will be COLDER… The Earth has been cooling since 2004, and is now getting colder! Took a PhD to figure that out.. Even the Russians are predicting 20-30 years of colder weather… WATCH THE SUN!
The root problem is sixty-eight years of purposeful deception about the Sun.
The intention was noble: To save mankind from nuclear annihilation by hiding the source of energy in cores of
1. Heavy atoms like uranium
2. Some planets like Jupiter
3. Ordinary stars like the Sun
4. Galaxies like the Milky Way
The consequences will be fatal for society if government policies continue to be based on lies, . . .
Revealed by three figures 1-3 of precise experimental data that consensus scientists ignore.
https://dl.dropboxusercontent.com/u/10640850/Chapter_1.pdf
https://dl.dropboxusercontent.com/u/10640850/Chapter_2.pdf
Isn’t that funny how they look at EVERYTHING else besides the object that actually produces the heat? Maybe because study of the sun easily shuts down their ridiculous global warming theories. Can’t have that now can we. I’ve been saying this for years and I’m just a 24 year old high school graduate. No college. Not book smart. To me, this shit is common sense. Good call buddy. Take care
Index to New Notch-Delay Solar Climate Model by Dr. Evans, Jo Nova’s Husband.
Steve Goddard focuses on the shenanigans at NOAA.
That’s your problem Steve you only spent 5 minutes. Years of analyse will reveal there was only a small amount around one boat on the shore of Antarctica that Captain Hazelwood was piloting.
Indeed, yes, this, and climate science in general, is too complex to yield to a 5 minute analyses, even if it is just simple thermometer or sea ice or sea level or ice core data. No, we need to, as Chris Christie says: “defer to the experts.”
These climate science professional experts, endowed by a leftist congress in concert with a leftist president, are the only ones that have the depth of understanding to know that their forecasts of doom / and the climate models / are all correct. Don’t let anyone tell you that all of the previous predictions of disaster have failed to materialize, and all of the climate models are laughably off the mark. Don’t let any “non-expert” tell you that. And change the subject if anyone mentions that these experts, in the Climategate emails, got caught with their pants down manipulating and fudging the data. It’s for the greater good that they did that; after all, as Gore says, a little “over-representation of .. how dangerous it is” will help the “little people” (the public) understand the grave situation that we face. If anyone says we have had “15 years of non-warming,” listen instead to the UN experts that say “NO! Our situation is grave, dire. We are on the verge of frying!!!”
“….the 21 June insolation minimum at 65°N during MIS 11 is only 489 W/m2, much less pronounced than the present minimum of 474 W/m2. In addition, current insolation values are not predicted to return to the high values of late MIS 11 for another 65 kyr. We propose that this effectively precludes a ‘‘double precession cycle’’ interglacial [e.g., Raymo, 1997] in the Holocene….” ~ Lisiecki and Raymo
Warming, What warming? Te prediction is 65 kyr of COLD!
Steven,
You know, and I know, that NASA:
1. Manipulates some data (Global temperature data for 1936), and
2. Hides other data (Xenon isotope data from the Galileo Mission to Jupiter).
We have clear and unequivocal evidence of that.
We do not yet have, but I strongly suspect that NASA has been hiding for decades
3. Evidence the chemical composition (e.g., O/Fe ratio) of the photosphere changes as the degree of mass-fractionation changes across isotopes
_a.) See changing isotope ratios of Kr & Xe in the solar wind: http://www.omatumr.com/Data/1972Data1.htm
_b.) See changes in degree of solar stratification over the 11-year solar cycle: http://xxx.lanl.gov/pdf/astro-ph/0510111v1.pdf
_c.) See high abundances of trans-iron elements released in abrupt solar flares:http://epact2.gsfc.nasa.gov/don/00HiZ.pdf
_d.) See “strange” oxygen in the Sun: http://www.omatumr.com/abstracts2005/StrangeOxygen.pdf
[I posted this earlier, but it vanished.]
Happy New Year & kind regards,
Oliver K. Manuel
Well, yeah, but you can see that it’s getting much more “extreme”. So there. 😛
Reblogged this on wwlee4411 and commented:
Do you need more evidence they don’t know what they’re talking about? Their logic is completely distorted. It has to be to try and justify the reality of the situation.
There is a great deal of humor in the climate predictions of those on the government payroll, but the possible consequences of government deceit is deadly serious.
http://stevengoddard.wordpress.com/2014/01/02/time-to-start-eating-the-dogs/#comment-305321
Most of it is in the Southern hemisphere just after the summer solstice so albedo will have a profound effect. Perhaps we are at a Tipping Point ® .
Or “could be”, depending on how the solar cycles progress.
Hmm, that’s strange. I’ve been searching for Northwest Passage rowing expeditions that are planned for 2014, and I haven’t found any yet. I wonder why.
Hmmmmm, let’s see. The risk of making yourself into global fools, relentlessly mocked for blind faith belief in global warming dogma, inability to understand numerical concepts like bigger and smaller, more and less.
You have to be a really major Greenie Kool Aide chugger to want to play row boater at the North Pole.
All the fools got eaten by Poley Bears during the last few seasons. That is why the Poley Bear population is so healthy.
It’s really quite simple— Trenberth’s missing heat has gone into the deep oceans and forced all of the cold water to the surface, whereby it freezes more easily when mixed with the excess CO2 particles being forced into it. All of the models (114% of them, actually) predicted exactly that.
*We now return control of your television set to you.*
But why would the warm water sink? Honest question, I’m just curious. Not a climate expert so I wouldn’t know.
I guess I forgot to add the /off sarc tag to that. 😉
Ever heard of the thermohaline circulation?
Reblogged this on CACA.
Hope someone mentions (we know the mainstream news media that’s up AGWers butts won’t). that the upcoming wildcard weekend NFL game between Green Bay Packers & San Francisco 49ers is set to be the coldest NFL game ever with forecasted temps awfully close to the all-time record of -13F set on New Year’s Eve 1967 @Lambeau Field during the infamous “Icebowl.”
The playoff game in Cincy on Jan 10, 1982 had a lower wind chill (-59 vs -48 at the Ice Bowl). I seem to remember the T in Cincy was -15 in some photos as well, but that is not what is recorded here. http://www.nfl.com/photoessays/09000d5d824da7dd
Chris Turney and his Guardian journalist pals would probably show up for SF/GB wild card game in Bermuda shorts and flip-flops such is their devotion to AGW.
As the ‘CO2 is evil’ grant trough is still full of tax-payer’s misappropriated funds, they will still feed well from it. Until western nation stop the madness and vote for sense it will continue.
This Sunday’s game @ Green Bay should easily qualify for being on of the top 5 coldest NFL games on record, will definitely give the “Icebowl” a run for its $$ as high temps in Green Bay Sunday look stay at least a few degrees below zero with temps falling throughout the afternoon before kickoff with extreme CAA as the polar vortex slides ESEward out of Minnesota. Here’s what the NWS in Green Bay is saying http://forecast.weather.gov/product.php?site=grb&product=AFD&issuedby=grb
https://sunshinehours.wordpress.com/2014/01/02/antarctic-clown-convention-had-to-know-the-ice-was-thick-way-back-in-october/
(Sarcasm follows)
Yeah, yeah, sure it looks like maybe global sea ice is going up — but that graph is cherry picked! See, just drop off 2002, 2007 and 2013 which are CLEARLY outliers and then you will see a clear downward trend!
(End sarcasm)
Any bets on whether some CAGW cultist tries that argument? Actually, I would bet not. Using that argument would presuppose the existence of a warmist who actually pays attention to the data. Ain’t gona happen… If they paid attention to the data they would be sceptics.
An early IPCC report had ice data going back to 1974. What would your graph look like with those extra 5 years/
John M Reynolds
Hopefully this will put the nails in the man-caused global warming coffin, but if it does not, here is some help:CO2 is a “trace gas” in air, insignificant by definition. It absorbs 1/7th as much IR, heat energy, from sunlight as water vapor which has 188 times as many molecules capturing 1200 times as much heat making 99.9% of all “global warming.” CO2 does only 0.1% of it. For this we should destroy our economy?
The Medieval Warming from 800 AD to 1300 AD Micheal Mann erased to make his “hockey stick” was several degrees warmer than anything “global warmers” fear. It was 500 years of great abundance for the world.
The Vostock Ice Core data analysis show CO2 increases follow temperature increases by 800 years 19 times in 450,000 years. That makes temperature change cause and CO2 change effect; not the other way around.
Carbon combustion generates 80% of our energy. Control and taxing of carbon would give the elected ruling class more power and money than anything since the Magna Carta of 1215 AD.
Most scientists and science educators work for tax supported institutions eager to help government raise more money for them. And, they love being seen as “saving the planet.”
Google “Two Minute Conservative,” http://adrianvance.blogspot.com and When you speak ladies will swoon and liberal gentlemen will weep.
While you speak of global sea ice, you mostly mean Antarctica. Antarctic sea ice is growing despite a warming, though still very cold Southern Ocean. It is already so cold there that even if the air temperature goes down some, (it hasn’t), it would hardly explain the growing sea ice. The large ozone hole feeding cold winds around the continent, pushing the ice out and opening up fresh areas for freezing makes a better hypothesis Also, Antarctic sea ice melts back to the same annual starting point every summer. Antarctic sea ice is a red herring in trying to understand climate science, Unlike the Arctic sea ice, Antarctic sea ice plays little role in the albedo effect so important to the heat balance of the earth because the sea ice is absent in summer and irrelevant in the dark winter. The real story of Antarctica is land ice. The interior of East Antarctica may be gaining land ice but overall Antarctica has been losing land ice at an accelerating rate
Brilliant. The warmer periphery is freezing and gaining ice, while the much colder interior is melting. You deserve a Nobel Prize.
Your theory for explaining the antarctic sea ice, I say theory as you seem well beyond the hypothesis stage, is that out in the middle of the Southern Ocean around Antarctica where the sea ice forms with an average temperature around minus 10 to 20 degrees, the global cooling of the earth dropped the temperature down a degree or two and that accounts for the additional sea ice. If science could always be so intuitive.
I prefer to consider the hypotheses offered by Guy Williams of the University of Tasmania.
Increased westerly winds around the Southern Ocean, linked to changes in the large-scale atmospheric circulation related to ozone depletion, will see greater northward movement of sea ice, and hence extent, of Antarctic sea ice
Increased precipitation, in the form of either rain or snow, will increase the density stratification between the upper and middle layers of the Southern Ocean. This might reduce the oceanic heat transfer from relatively warm waters at below the surface layer, and therefore enhancing conditions at the surface for sea ice.
Similarly, a freshening of the surface layers from this precipitation would also increase the local freezing point of sea ice formation.
Another potential source of cooling and freshening in the upper ocean around Antarctica is increased melting of Antarctic continental ice, through ocean/ice shelf interaction and iceberg decay.
The observed changes in sea ice extent could be influenced by a combination of all these factors and still fall within the bounds of natural variability.
I was wondering when someone was going to drag out the ol’ dead nag of “Antarctic albedo isn’t as important as Arctic!” canard.
Our friend, suyts has that steaming carcass already buried in a deep pit and covered in dozens of bags of lime. Game. Set. Match. 🙂
http://suyts.wordpress.com/?s=albedo
BC, I took a look at suyts. Several things jumped out. The importance of the Arctic sea ice is for it to exist during the summer when the most sunlight is present and the albedo is most important. The Antarctic sea does not exist during the summer, only in the winter when very little sunlight hits to be albedoed. Suyts also did not seem to understand the importance of albedo. Open water is much darker than ice and snow, and dark anything absorbs heat.
matataya, you are completely ignorant of the most basic facts on this subject. You don’t even understand that there is as much sunlight in the spring as in the summer!
You are just wrong that there is no Antarctic sea ice in the summer. It is summer there now and there is plenty of sea ice. That’s what those ships got trapped in. The sun is at its highest now in the southern hemisphere and there is an unusual amount of Antarctic sea ice reflecting that sunlight back to space.
Even at the end of the SH summer, the sea ice never completely disappears, and in recent years there has been more at the end of the summer. Look at some graphs of Antarctic sea ice extent. There is no “flat-bottom” to the graph during summer.
Furthermore, the Antarctic sea ice has a far greater albedo effect than the Arctic sea ice. At its maximum extent it reaches to about 60 degrees latitude at the time of the vernal equinox, where as the Arctic sea ice only reaches to about 75 degrees latitude. It is the spring ice that has the greatest albedo effect, and because the sun is a lot higher in the sky at 60 degrees than at 75 degrees, changes at the boundary have a far greater effect around the Antarctic.
Fundamentally, you have everything backwards.
Where do you see anything that says that Antarctic sea ice doesn’t exist in the summer? The Warmistas who were just rescued from their little propaganda stunt might have a few things to say about there not being any sea ice there. Also, if you would look through all of suyts’ posts, you’ll see the very prescient explanation as to why Antarctica’s land ice is so much more of albedo-inducing machine than any amount of Arctic sea ice— There’s much more of it and it’s at a much lower latitude (at all times of the year), thus reflecting much more light back out into space.
PS: I’m glad that someone from the other side can come here and have a civil discussion, instead of just coming in and flaming away. Kudos!
Overall Antarctica is losing land ice only through tortured statistical analysis -=- not in the real world. Those who want to claim ice loss have sophisticated computer models on their side, but their disconnect from reality continues to erode their credibility for those who wnat to think and understand instead of wanting to be fed propaganda. Reality: Objects that were on the ice surface 15 years agao are now buried — and there is other evidence increasing ice.
Antarctica is much better “laboratory” for the CO2 question than the Arctic. CO2 is a recognized as a well-mixed gas, so its increase in Antartica is noted; however, Antartica is isolated from many other phenomenon that hit the Arctic. The northern ice cap is subject to the effects of air pollution, carbon deposits, ocean currents, PDO, AMO and (more) human visits & effects. (Also, the Arctic Ocean has more variance in underwater volcanoes which a few scientists think are significant — but most believe are these eruptions are insignificant.) Therefore, if CO2 is the driving force, we are more likely to see it in Antartica than in the Artic.
Your CO2 hypothesis doesn’t jive with the fact that Antarctica starts out 50 degrees colder than the Arctic. That buried object you speak of may have been buried in the interior of East Antarctica which is gaining land ice, but overall, Antarctica has been losing land ice at an accelerating rate. The Arctic and Antarctica have completely different climate systems and can’t be compared side by side.
“Antarctica has been losing land ice at an accelerating rate?” So let’s totally ignore the fact that GLOBAL ice broke all-time records for the end of 2013 & the fact that Antarctic SEA ice has been on an upward trend since the start of the satellite era & instead let’s run to focus on “land ice”. Makes sense you suddenly resort to this given it’s harder to physically measure or disprove your claim, but anyone with any appreciable logic understands that temperatures inland over Antarctica struggle to get above 0, much less above freezing at any point in the year. Another baseless claim without any factual basis whatsoever to back it up. Sigh…
Why has Antarctic lost land ice (only in certain areas)
Researchers Find Major West Antarctic Glacier Melting from Geothermal Sources
Giant Underwater Volcanoes Discovered
Antarctica Active Volcano found beneath the ice
A paper published a year ago finds Antarctica has been gaining surface ice and snow accumulation over the past 150+ years, finding acceleration in some areas. “…a clear increase in accumulation of more than 10% has occurred in high Surface Mass Balance coastal regions and over the highest part of the East Antarctic ice divide since the 1960s….” The entire Antarctic continent has been gaining surface ice mass over the past 150 years and Antarctic surface ice mass is presently growing by 2100 gigatons per year.
Final Paper (PDF) http://www.the-cryosphere.net/7/303/2013/tc-7-303-2013.pdf
Discussion Paper (TCD) http://www.the-cryosphere-discuss.net/6/821/2012/tcd-6-821-2012.html
Another paper says the same the Antarctic ice sheet is growing in mass.
Finally Robot Sub Finds Surprisingly Thick Antarctic Sea Ice
What does the expanding ice mean?
Drake Passage is the waterway between South America and the Antiarctic. If the sea ice continues to grow at the same rate it has for the last few years Drake Passage will be come ice clogged.
Drake Passage and palaeoclimate
I wonder what are you guys going to do when the AMO flips cold again and Arctic Ice grows back above normal. I’m looking forward to seeing the knots you will tie yourself up into explaining how growing Arctic ice is caused by warming, and how fast you will trumpet Antarctic sea ice declines (from record highs).
“The Atlantic Conveyor was slowed by the melting of Greenland in under ice sheet rivers, coupled by increased coriolis winds caused by large Antarctic Ice sheet melting sinking into the deep ocean, mixing with four Atomic Bombs per second, and Ozone hole instability driving more ultraviolet spectrum saturation by southern algae forest blooms amplified by decreased ocean salinity resulting from retreating Antarctic sea ice, feeding large El Nino’s in the Indian Ocean, interrupting the monsoonal flow over the Himalayan glaciers who’s soot albedo increase drives Stratospheric thin layer positive feedback clouds, trapping short wave infrared energy driving sea levels higher in the Aleutian Islands off set by northern hemisphere volcanic activity driven by deep ocean heating which causes a negative feedback that phases with a higher cosmic ray frequency interacting with higher ocean acidity slowing katabatic Arctic winds, ultimately driving growth of Arctic Sea Ice. So the models say we need to stop burning coal.”
Try to do that all in one breath for a challenge.
Now imagine how funny will be if, for whatever reason, the “see-saw” effect lingers a little and we have the continuation of the present recovery of the Arctic ice *plus* the repeated records of the Antarctic ice for a few years more.
They’re already so “confused” to explain what happened in 2013 (sending failed “expeditions” and “rowers” to Antarctic and Arctic to prove their models, because the data refuses to collaborate… ) that I believe (or I hope) at some point they will simply give up with the absurdities and try at last to make sense of the facts.
Is there a limit for non sense, when absudity tends to infinite?
Warming southern ocean? Uh, no.
http://bobtisdale.files.wordpress.com/2013/12/14-southern.png?w=960&h=660
Albedo? I’m sure everyone on board the HMS Inconvenient Truth will be glad to hear that there was no sea ice during the summer solstice this year. A lot of bunker fuel could have been saved had you spoken up just a little sooner.
Matayaya, did you just say Antarctic sea ice is absent in summer?
You might check up the latest research from Prof Turney of UNSW. He found so much ice he didn’t know what to do with it all.
They used up quite a bit of that non-existent ice in their adult beverages during their
scientific research expeditionparty/propaganda cruise. 😉We are approaching the peak of summer right now in the SH. The sun is 7 percent stronger due to the fact that the earth is closer to the sun now. The SH sea ice is far closer to the equator then the NH sea ice. So what are you trying to say about the albedo? The RSS data show a slight atmospheric cooling over the past twenty years. The SST had also slightly cooled over that time. Studies of land ice conflict, and any reasonable error bars make them statistically meaningless. So what have you got left Please show me your study documenting an increase in outflowing air mass from the SH polar interior over the past twenty or so years.
David, Antarctic sea ice peaks in September and reaches its minimum in February. The sea ice edge will soon be back to its’ historical starting point near the shore soon just as the sun angle starts to get high. There will be negligible sea ice then to provide significant albedo. Whereas, the Arctic Ocean historically has had a very significant amount of sea ice during the summer to provide significant albedo.
The sun is now high in the SH. Dec 21st is the longest day of the year down yonder. The ice is retreating, but that is because it is much closer to the equator then the NH sea ice, and being pounded by a TSI that is 7 percent stronger. There are stil The NH albedo is weighed against a much higher water refraction angle, a weaker TSI. Do the math. It does not support your paradigm. You stated, “The Antarctic sea does not exist during the summer.” It is just past the longest day of the year, (maximum albedo) and there are millions of sqK. An ice breaker is stuck in your non existence ice.
David, my point is that the 1 percent more Antarctic sea ice informs neither one way or the other. The Antarctic is the least understood system on Earth. No point in arguing on that just yet. Call it natural if you like. The significant loss of summer sea ice in the Arctic is far more significant, understood and worthy of arguing about if you so choose.
Mata…. thanks for dropping by. Weird that I would be reading this as you were perusing my humble blog, but, you found the wrong post regarding your point about the importance of NH vs SH, you see, the start point for the ice in the SH never gets much south of 70 deg lat, whereas in the NH the ice doesn’t get much south of 70deg lat. You can go here for a graphical representation with polar maps.
http://suyts.wordpress.com/2013/10/18/more-on-the-antarctic-ice-and-why-its-more-important/
suys, interesting point you are making though the Antarctic sea ice extent you showed was only 3 weeks after the maximum extent. If we are talking about sun angle and amount of albedo, I would argue not much albedo could be expected from that sea ice. Sort of like being able to directly look at the sun with no harm in the late afternoon.
It is summer time when the sun angle is higher when albedo becomes important, re the importance of the summer sea ice of the Arctic Ocean.
If you really want to talk about albedo, you should maybe pay more attention to winter northern hemisphere snowcover, which since the PDO cooled in the late 2000s has been on the increase, thus higher albedo as a result. http://climate.rutgers.edu/snowcover/table_area.php?ui_set=1&ui_sort=1 In the end, snowcover nor sea ice, although each having their effects on climate are most analogous to atmospheric teleconnections like the PNA, EPO, AO, NAO, TNH, etc. They really aren’t drivers of the climate, they are merely indicators of larger scale forces like THC, cosmic rays, solar cycles, AMO/PDO etc. If you understood the importance of these large-scale drivers you wouldn’t be very surprised at all to see how quickly arctic sea ice responded this year to a record decline in the THC in the spring of 2013 which also helped lead to the downfall of the 2013 hurricane season via feedbacks in enhancing the subtropical Azores-Bermuda gyre & +NAO phase both of which remove heat out of the deep tropical Atlantic & broaden the local Hadley Cell limiting focused convergence in the tropics. You could also add that the lack of el nino for 4 years has had a substantial effect on Atlantic hurricane ACE as we’ve seen many times in the past when global & Atlantic ACE tends to crash towards the end of & just following deep multi-yr la ninas.
@Eric Webb: Interesting, thanks.
What about cloud cover do you see the total cloudiness increasing during the next (possibly 8 years or so) of the rest of the present solar cycle.
The SH ocean anomalies have been going down year after year, with colder regions reaching lower latitudes (I believe I’m seeing this on the unisys analysis
http://weather.unisys.com/surface/sst_anom.gif
Do you see this as a possible factor influentiating the trend to La Ninas?
Thanks.
I see no reason why cloud cover shouldn’t increase over the next several years as we are currently on course to experience a rather unusual prolonged solar minimum that can be thanked in part to the sun’s piss-poor magnetic field. I certainly see this having some influence on the PDO & its trend towards going to more la ninas, but I also recognize the relationship between the PDO & AMO as important as well. I’ve noted that when the AMO was warm in the 1950s & going into about 1965 when it flipped to its cold cycle, there was a period of greatly increased la nina activity & the overall PDO was deepening into its cold cycle. However, once the Atlantic also became cold, it allows the Pacific to warm much easier in relation to the Atlantic, thus we saw several notable el nino spikes & although the PDO remained cold, it had found a steady negative state, but eventually it overcame this in 1976 & became warm once again. The Pacific continued to warm, unabated until of course the Atlantic began to rapidly catch up in the 1990s & eventually flipped into its warm cycle in 1995. The Pacific in response to this then steadied out in the warm cycle again & much like what happened within several years of the previous flip in the Atlantic, the ENSO index skyrocketed with the largest el nino observed in the “reliable” record during the 1997-98 winter with then a major la nina (analogous to the el nino spikes of 1976-77 & 77-78) helped offset this & send the PDO well on its way to the cold cycle. With the faltering THC, & the fact that the only comparable non el nino Atlantic hurricane seasons to last yr in terms of ACE (for this criteria yrs with less than 50pts (1962, 1970, & 1993) all occurred near major AMO flips (saw initial cold AMO flip in 1964, briefly spike warm after, then went into its cold mode in 1970, & then a flip occurred in 1995). If we also consider that there’s about a 150 month or so lagged relationship between the state of the NAO & AMO http://www.esrl.noaa.gov/psd/cgi-bin/data/climateindices/corr.pl?tstype1=3&custname1=&custtitle1=&tstype2=32&custname2=&custtitle2=&year1=&year2=&itypea=0&y1=&y2=&plotstyle=0&length=181&lag=150&iall=0&iseas=0&mon1=0&mon2=11&anom=1&climo1_yr1=&climo1_yr2=&climo2_yr1=&climo2_yr2=&Submit=Calculate+Results
about half the cycle length of the AMO, this makes sense given the NAO pattern helps “load” the AMO pattern & helps regulate the amount of fresh water input into the THC, which when increased due to arctic sea ice loss that has been observed since the warm AMO flip in 1995 eventually leads to a slowdown of the THC that helps reverse the AMO that then in turn leads to more arctic sea ice raising the salinity of the water in the THC, allowing it to strengthen once again, eventually becoming strong enough to be classified under “warm AMO.” The strengthening of the THC relates to north Atlantic sea ice, the NAO & AO, effects the subtropical gyre & Saharan Dust/NE trade winds, & helps modulate hurricane activity & even to an extent Sahel rainfall) Interesting how nature has a way of attempting to balance herself out with time.) I also see evidence in a potential AMO flip via global temperature anomalies that have begun to stair-step down, we can hone in on N America for example and see a clear semblance between the last 5 years & what happened in the early 1960s preceding that cold AMO flip
https://pbs.twimg.com/media/BWeDro-CQAATiMA.jpg
The PDO also shows strong relations to the QBO (Quasi-Biennial Oscialltion which is based on downward propagating stratospheric winds in the lower stratosphere of the tropics near 30mb). Makes sense for such oscillations to be correlated given that two other oscillations of similar stature, although on interannual time scales (the MJO & AAM) are also related. The MJO is generally a good measure of the amount of upward motion over the global tropics which is related to a 30-100 day “pulse” that describes an ensemble of convective activity driven by other convectively coupled equatorial waves like the Kelvin, Rossby, & Intertio-gravity wave & mid-latitude eddies that can instigate tropical convection, specifically in the central Pacific where the “critical latitude” for the equatorward propagation of these systems is significantly closer to the equator thanks to the dominant upper level westerly wind. The MJO is physically measure via RMM (Real-time Multivariate MJO) indices that measure variations in the tropical OLR & 200/850mb zonal winds. The MJO is related to AAM (Atmospheric Angular Momentum) via its dispersion in the central Pacific where in the convective signal of the MJO becomes lost due to various factors, one of which being relatively lower SST. As the MJO fades in this region, it enhances an exchange of energy between earth & atmosphere where we also observe significant frictional torque anomalies develop upstream of the dissipating MJO signal over the Pacific. The increase in frictional torque anomalies here helps spark +AAM values which hence lead to variability in mountain torque, extratropical rossby waves, the arctic oscillation, etc. Now, to add to the reasons why the MJO signal becomes lost over the western hemisphere (although signals are maintained in upper level winds) is because as opposed to the Indian Ocean, Maritime Continent, & Western Pacific regions where it moves generally between 5-8 m/s, the lower amount of convective activity outside these regions means the MJO must move at speeds of 20-25 m/s which means the MJO’s propagation speed is heavily dependent on the amount of convective activity. Thus, in the grander scheme of things makes some sense that the PDO would show some resemblance to the QBO
http://www.esrl.noaa.gov/psd/cgi-bin/data/climateindices/corr.pl?tstype1=7&custname1=&custtitle1=&tstype2=12&custname2=&custtitle2=&year1=&year2=&itypea=0&y1=&y2=&plotstyle=0&length=251&lag=&iall=0&iseas=0&mon1=0&mon2=11&anom=1&climo1_yr1=&climo1_yr2=&climo2_yr1=&climo2_yr2=&Submit=Calculate+Results
Of course, I also understand that the solar cycles, specifically the peaks & minimums in activity help modulate flips in the QBO from its east-westerly phase, thus we conclude that at least from an indirect standpoint that the solar cycles by influencing QBO which shows strong relation to the PDO, is indeed influencing what happens over the Pacific.
http://weatheradvance.com/home/weather/weatheradvance.com/wp-content/uploads/2013/03/Stratospheric-warming-sunspot-cycle-QBO-relation.png
Knowing all of this information, yes we can conclude that it makes sense we’ve seen a trend of increased la ninas lately that have helped shape the PDO into its negative state. Thus, also with the threat of an AMO flip given the factors listed above, such a slip given the history of the ENSO may lead to a rather significant & prolonged la nina event within the next decade or so. However, before then, I don’t think we’re going to see a la nina next year, in fact much of the evidence points to the opposite. The eastward movement of the thermocline I’ve noted recently, the overall behavior of the large-scale patterns in the northern hemisphere recently, the anomalous late season tropical activity in the west Pac (still researching this), but I can initially tell such behavior is more typical of el nino & looking @ the history of the ENSO index & considering that A) we’ve never gone over 4 years without an el nino (last one ended in 2010) and that B) every neutral ENSO period which lasted at least a year or more has ALWAYS ended in el nino (been ENSO neutral since 2011), it’s safe to conclude el nino appears rather likely for 2014. I’ve also looked @ the resemblance between the current SST & ones in the yrs preceding el ninos & note a lot of semblance in the very elongated N Pac warm pool, significant warming just to the east of New Zealand, & plenty of cold water in the southern hemisphere, especially to the south of Madagascar https://twitter.com/WeatherAdvance/status/413828055065317376/photo/1
Hope this helps!!
It helped a lot Eric, thanks.
I have not even a fraction of the understanding of the whole system that you have, but I could also note the important correlation between the AMO and PDO, for example, when the PDO warmed from 2012 to 2013, simultaneously with the decrease of the AMO from the spike in 2012.
The occurrence of repeated La Ninas in connection with the flips of the AMO to negative phase and the frequency of El Ninos never having a period of less than 4 years between successive episodes are also important points in your comment.
The correlation of the PDO with ENSO seems clear, but I believe there is a new factor that could be forcing colder waters into the equatorial Pacific, which is the increasing anomaly of the Antarctic ice extent.
I believe I have been observing negative anomalies being pushed toward lower latitudes since the end of 2011. In fact, this “forcing” seems strong enough that it could have been an important factor in the reversal of the El Nino trend at the end of 2012.
The polar regions show strong sensibility to solar forcing and if solar radiations were a bit stronger we’d probably not have the extraordinary recovery of the Arctic ice in 2013 and the repeated records of the Antarctic ice.
With our present level of radiations the cooling seems to be starting at the poles and then propagates to lower latitudes.
The source I use for solar information, in relation with climate, is Geoff Sharp’s Layman’s analysis
http://www.landscheidt.info/?q=node/50
which I think is much simpler and more reliable than NASA’s “salad”.
Now armed with that knowledge, go here and then understand how much more direct sunlight the SH ice gets than NH does. http://astro.unl.edu/classaction/animations/coordsmotion/daylighthoursexplorer.html
We just went past the winter solstice, and yes the SH ice is down to 6.5 million km2, but, that surrounds the Antarctic, which is 14 million km2. The Arctic ice never gets to 20 million km2. So, yes, the NH can have significant amounts of ice which never see daylight in the winter. But, that’s an impossibility in the south.
Looks like I dogpiled on top of mata in my comment up above. Thanks for expounding on it. I wanted him/her to actually go over and look through the very pages you linked and, quite possibly, unlearn some of the things that he/she has been told over the years by The Great Goreacle’s pontificating and prognosticating
prophetsprofits. 🙂suyts, another point here is what is new to the climate system. Maybe that additional winter sea ice in the Southern Ocean will help with the albedo, but what is really different is the reduced summer ice in the Arctic. It is all about energy balance. What is different than before that affects energy balance to the climate system.
What a wonderful modeled world you believe in. Meanwhile back in the real world…
“… Antarctic sea ice melts back to the same annual starting point every summer … “
Do you have actual data for this statement or is it just your belief? The data I have is showing something very different.
NASA and National Snow and Ice Data Center get into this on their websites. I will look for an exact source later. However, this quote is interesting and makes reference to your question. “You might wonder why the negative trends in Arctic sea ice seem to be more important to climate scientists than the smaller increase in Antarctic ice. Part of the reason, of course, is simply that the size of the increase is much smaller and slightly less certain than the Arctic trend. Another reason, however, is that the complete summertime disappearance of Northern Hemisphere ice would be a dramatic departure from what has occurred throughout the satellite record and likely throughout recorded history. In the Antarctic, however, sea ice already melts almost completely each summer. Even if it completely disappeared in the summer, the impact on the Earth’s climate system would likely be much smaller than a similar disappearance of Arctic ice.”
Again that’s what you want to believe, it’s different from the data I have. You’re not analysing correctly the trend of the sea ice and, consequently, concluding wrongly about polar temperatures.
You also have to consider that the Arctic is completely surrounded by landmass vs the antarctic that is completely surrounded by ocean, & that the ocean has 1100x the heat capacity of the atmosphere. Also knowing that after the Antarctic millions of years ago split away from the Australian continent it has since been surrounded by the Antarctic Circumpolar Current that makes this area comparatively less susceptible, although still slightly vulnerable to “outside” influences on sea ice. Thus, given this information it is plausible to conclude that the relatively minor increases in Antarctic sea ice observed over the course of the satellite era are indeed as significant if not much more so than what’s occurring in the arctic.
Forget Global Warming. I have been keeping track of the daylight hours for several months now and it appears the days are getting shorter and shorter. I predict that within 24 months, the entire Earth will be in total darkness, all life will perish. Woe are we!!
Can someone explain the contents of the file timeseries.global.anom.1979-2008 for me please?
It seems very odd that a figure as precise as 17.0578232 (see last line) should occur 35 times over the years.
Doh! Please continue to ignore the above question.
It’s probably an aspect of the model used to find the average, for example the numbers “17.1322975”, “19.7558384”, etc. are also repeated many times, indicating some type of periodicity.
I don’t have the details though.
It’s the average for the date. Col 1: Year.DecimalDay Col2: Anomaly Col3: Reading (10^6 km^2) Col 4: Average for that date. Note that all such occurrences will be on the same decimal day (except leap years)
Here is what December 31 looks like for every day in the record:
https://drive.google.com/file/d/0B28vXDmHmE-ddTRuRE1FWFpFODg/edit?usp=sharing
Thank you for the explanation of the columns in the table. I was just about to ask Tony.
The head line says December 31st, Global Sea Ice Area Was Largest Ever Recorded. How is that possible if Antarctic sea ice maximum is in September and the minimum is coming up next month?
“most sea ice measured for the date.” – but you jest, of course.
And It’s gonna be very close to the highest minimum sea ice extent on record in Antarctica. Temperatures are very cold down there despite 24 hr sunshine.
http://www7320.nrlssc.navy.mil/GLBhycom1-12/navo/antarcsstnowcast.gif
“Climate experts say that global warming is melting sea ice faster than expected, which is why the poles currently have the most sea ice ever measured for the date.”
Let’s clear things up a bit. Climate experts are saying that global warming is melting ARCTIC sea ice, yet you appear to be providing data for the ANTARCTIC not the global data. The global data would be around 35.2 kilometers squared.
Therefore, you are either intentionally misleading your readers or you don’t understand what you are talking about.
If you want to see the data analyzed by folks that know what they are doing, and know how to properly label a figure. Check out the original source: http://arctic.atmos.uiuc.edu/cryosphere/ You will noticed that the Northern Hemisphere sea-ice anomaly for “the date” is well below the 1979-2008 mean.
That should read 35.2 million kilometers squared, lest some get confused.
Sorry Steven, jumped the gun you are right this is global data. Feel free to delete my comments.
Experts don’t know what they are talking about. All you have to do is stick your head outside once a day to see how warm/cold it is. If its hot today, then we classify that as extreme global warming. If it is cold outside, we classify that as the result of extreme global warming. This isn’t rocket science you know.
Hi Steve.
Great analysis. You’ve certainly blown the doors off the global; conspiracy with this one.
But I’ve tried to duplicate it using the data you cite and can’t. How exactly are you processing the time series in the file you link to to get the figure you show? It almost appears as if you’ve made a mistake since there isn’t an obvious method to get the final year so high. Any standard averaging method I’ve used (splines, running means, digital low-pass filtering) shows the peak for the end of 2013 is still significantly lower than the peaks in the 80’s and 90’s. In fact, it appears that the max in 2013 is even below the average for the 80’s and 90’s.
Earth warms and cools in cycles, cycles inside of cycles, inside of cycles inside of 10,000 cycles. little cooling cycle 1945-1977 brought ice age scare of the 1970’s. Little warming cycle 1978-1997 brought global warming scare along with liberal “let no crisis go to waste” manipulation of us. 1998-2030 cooling cycle brings the “global warming cause global cooling” scare to keep the crisis going.
Pretty stupid claim about Dec 31st, since most of December is higher in quite a few years.
But, very ironic that global sea ice anomaly started it’s plunge, within days of Dec 31st. now down nearly 2 million square kilometers.
I’ve encountered something awfully strange using the data at http://arctic.atmos.uiuc.edu/cryosphere/timeseries.global.anom.1979-2008 I put the Antarctic area data (third column) into Excel then did a backward looking 365 day smoothing beginning on 1980 = sum(D1979.003 : D1980.0)/365 then 1980.003=sum(D1979.006 : D1980.003)/365 and so on…
What’s odd is that every sum of the 365 values from 1979 to 1980 (incremented one day each) yields the SAME value! Then in 1981, (summing 1980 to 1981), the numbers change as expected. Starting 1982 it does it again, the SAME number for all 365 results and on top of that… the SAME number as that for 1979-1980. That repeats for another 2 years then the values change for a year then back to the SAME number for another 3 years. That four year pattern repeats all the way to 2014 with 2014 being one with that SAME value again.
Is it something I did wrong or did I find an Easter Egg from someone playing games at uiuc?
What I was originally looking for was the data to replicate the global sea ice area anomaly per this: http://arctic.atmos.uiuc.edu/cryosphere/IMAGES/global.daily.ice.area.withtrend.jpg
I do believe the referenced data file is indeed the digital version of the graphic. Though it does take some time to figure out!
If by “third column” you actually mean the last column (the third column after the date), that column is the average ice-area for that day of the year; that is, the sum of all the ice-area figures for that day of the year divided by the number of years covered. I believe the four-year pattern you are talking about is marked by the recurrence of leap year every four years.
See Michael D. Smith’s explanation of the columns, above, January 4, 2014 at 3:10 am.
I hope this helps.