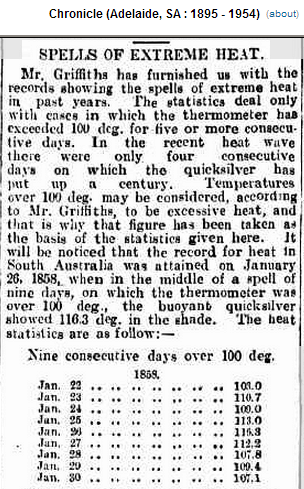
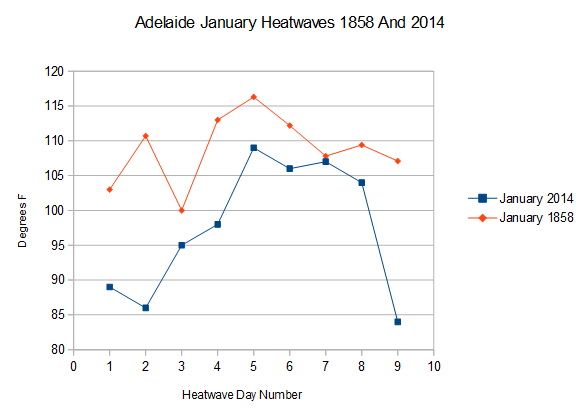
In January, 1858 Adelaide had nine consecutive days over 100F, topping out at 116.3.
The graph below compares that to the “record heatwave” during the last nine days in Adelaide. The 1858 heatwave averaged 11 degrees warmer, with every day of the heatwave hotter than the corresponding day this year. CO2 was 280 PPM at the time.
Weather History for Adelaide, Australia | Weather Underground
h/t to Ivan for finding the 1858 information


and around 20c drop from thursday to today saturday, from 43+ down to 25
Good stuff Ivan and Steven!
The media hype around CAGW lacks perspective and this provides it in spades!
Gavin better turn up the adjustment knobs up to eleven.
https://www.youtube.com/watch?v=4xgx4k83zzc
1858 to 2014 isn’t even a blink of the eye in the history of earth.
Not enough data to prove anything so scientist (and I use that term very loosely) prove or disprove todays questions on popular vote. Sickening.
Climate change is real. The worlds climate is always changing. Man Made Global Warming? Not so real.
All this proves is that CO2 can go back in time. It is more powerful and insidious than we thought!
Leading climate scientists have run their models backwards and determined that it could hot have been hotter than 32 F during 1858. Thus those reports are, in the name of science, hereby thrown into the dumpster and banned from public view..
Minister of Truth
Reblogged this on Climatism and commented:
“In January, 1858 Adelaide had nine consecutive days over 100F, topping out at 116”
Such historical temperature data, is like kryptonite to the warmist ABC, who are today running hot on Adelaide’s 4th consecutive day over 40C, claiming this is a new “record”, as confirmed by the BoM, who’s temp record conveniently begins in 1910, wiping out the extreme heat of the late 1800’s. Extreme heat that led to the Federation Drought – 1895-1902.