
Disrupting the Borg is expensive and time consuming!

Google Search
-
Recent Posts
- Analyzing The Western Water Crisis
- Gaslighting 1924
- “Why Do You Resist?”
- Climate Attribution Model
- Fact Checking NASA
- Fact Checking Grok
- Fact Checking The New York Times
- New Visitech Features
- Ice-Free Arctic By 2014
- Debt-Free US Treasury Forecast
- Analyzing Big City Crime (Part 2)
- Analyzing Big City Crime
- UK Migration Caused By Global Warming
- Climate Attribution In Greece
- “Brown: ’50 days to save world'”
- The Catastrophic Influence of Bovine Methane Emissions on Extraterrestrial Climate Patterns
- Posting On X
- Seventeen Years Of Fun
- The Importance Of Good Tools
- Temperature Shifts At Blue Hill, MA
- CO2²
- Time Of Observation Bias
- Climate Scamming For Profit
- Climate Scamming For Profit
- Back To The Future
Recent Comments
- Bob G on Analyzing The Western Water Crisis
- arn on Analyzing The Western Water Crisis
- Bob G on Analyzing The Western Water Crisis
- Bob G on Analyzing The Western Water Crisis
- Bob G on Analyzing The Western Water Crisis
- Hank Phillips on Analyzing The Western Water Crisis
- Hank Phillips on Analyzing The Western Water Crisis
- Hank Phillips on Analyzing The Western Water Crisis
- Hank Phillips on Analyzing The Western Water Crisis
- Bob G on Analyzing The Western Water Crisis
I appreciate your sense of humor, Steven.
“One of these days your sense of humor is going to get you in trouble,” is a quote from a letter I received from the editor of a prestigious scientific journal in 1969-70 after I made public his effort to quietly blacklist me from publishing in that journal.
The editor resigned his position a short time later.
Guess he forgot about your sense of humor. 😆
The homogenization of the temperature data will make these events disappear like they do all other interferences provided by mother nature and man…
At least the Chinese are paying attention:
http://wattsupwiththat.com/2014/01/29/important-study-on-temperature-adjustments-homogenization-can-lead-to-a-significant-overestimate-of-rising-trends-of-surface-air-temperature/#more-102367
The commenter jim karock at your wuwt link says: Does this explain most (or all) of the warming since the 1930s? Or, are we really cooling since the 1930s, keeping in mind the NOAA adjustments chart: http://www.sustainableoregon.com/data_adjustments.html
Got to love that “sustainable Oregon” sight. I’m starting to check it out, and the link above makes a solid case that we have in fact been in a cooling trend since the 1930s. Game over for the climate debate!
Thanks for the link to the sustainable Oregon website.
To save themselves from death by nuclear annihilation, THEY (frightened world leaders) have destroyed the integrity of these basic fields of science since the end of the Second Wofld War and put the very survival of themselves and the rest of mankind at high risk.
Astronomy
Astrophysics
Atmospheric science
Chemistry
Climatology
Cosmology
Earth sciences
Geology
Modern physics
Nuclear science
Particle physics
Physics
Planetary science
Reactor physics
Solar physics
Etc.
We do not know, or need to know, details of exactly who THEY are.
THEY were, in 1945, the most powerful folks on Earth and they were afraid THEY might die.
THEY probably deceived themselves into thinking THEY were saving the world from nuclear annihilation.
Good for us, truth seekers, that what really matters are the facts that will remain and have consequences.
BRRRrrr, I just got up to a temperature of 4 °F (minus 15.5 °C) in mid North Carolina. It is 2 °F at the nearby airport. The record cold for today was 7 °F (1977)
There are other bits of information about the climate that can be used to verrify/validate the ‘Official’ temperature records.
Koppen classification system: http://www.britannica.com/EBchecked/topic/322068/Koppen-climate-classification
Movement of midwest boundries by decade: http://www.sturmsoft.com/climate/suckling_mitchell_2000_fig2_3.gif
Study finds stream temperatures don’t parallel warming climate trend:
http://www.terradaily.com/reports/Study_finds_stream_temperatures_dont_parallel_warming_climate_trend_999.html
Since streams have shallow depths they should reflect the amount of sunlight. I guess Hansen forgot to ‘Adjust’ this data. The ground would also reflect the amount of sunlight too. All the factors the name above also affects ground temperature.
Ice classic break-up dates: http://www.nenanaakiceclassic.com/Breakup%20Log.html
Northern Hemisphere Snow cover:
October http://www.ncdc.noaa.gov/sotc/service/global/snowcover-nhland/201310.gif
November http://www.ncdc.noaa.gov/sotc/service/global/snowcover-nhland/201311.gif
December http://www.ncdc.noaa.gov/sotc/service/global/snowcover-nhland/201212.gif
January: http://www.ncdc.noaa.gov/sotc/service/global/snowcover-nhland/201301.gif
February http://www.ncdc.noaa.gov/sotc/service/global/snowcover-nhland/201302.gif
and
March http://www.ncdc.noaa.gov/sotc/service/global/snowcover-nhland/201303.gif
That is six winter months showing snow fall returning to “normal”
And this is why we must cut-back on all fossilized politicos that bray their CO2 filled nonsense and confuse the sheeple.
Ah yes heat causes cold. I’ll remember that my next snow skiing trip to Daytona Beach.
Update:
Siler City N. C. Muni, Siler City, is 0 °F : 7:24 AM EST, Elevation: 614 ft
Lat: 35° 42′ 16.070”, Lng: -79° 30′ 14.510”,
Link to additional info on the airport: http://www.city-data.com/airports/Siler-City-Municipal-Airport-Siler-City-North-Carolina.html
Latest GISS alarmist rubbish following Obama and his SOTU blurb.
Let me get back to building my ark….. Not!
http://m.tech.firstpost.com/news-analysis/15-second-climate-change-video-will-leave-shocked-217345.html
Atlanta not looking good on the roads right now.
http://mobile.news.com.au/world/breaking-news/motorists-retrieve-cars-after-us-storm/story-e6frfkui-1226814503181
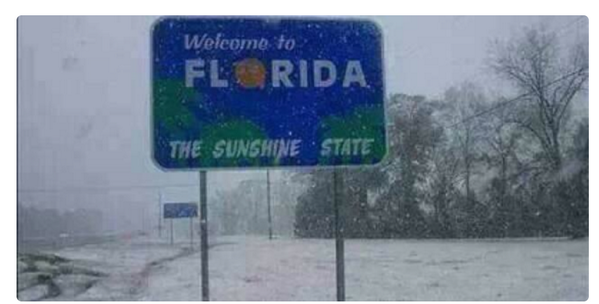
GIF animation of the polar vortex reaching Florida:
http://img.gawkerassets.com/img/19e4tnn0z5gmsgif/ku-xlarge.gif
earth.nullschool.net/#2014/01/30/0000Z/wind/isobaric/10hPa/orthographic=-82.04,33.38,327
Impressive chart, thanks!