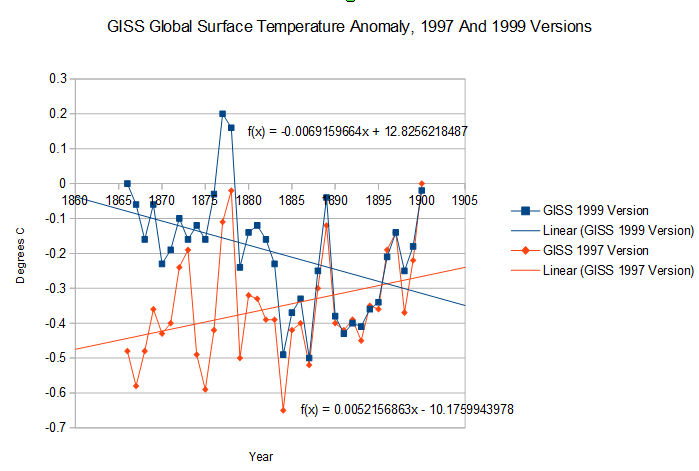
In 1997, GISS showed that the earth was rapidly warming from 1866 to 1900. But by 1999, they showed the exact opposite for the same time period.
The 1997 version was destroyed on the Web Archive sometime this week, and is now empty. It was located here. I captured it on December 23.
http://web.archive.org/web/19970301012952/http://www.giss.nasa.gov/Data/GISTEMP/GLB.Ts.txt
The 1999 version has not been destroyed yet, and can still be found here :
http://web.archive.org/web/19990220235952/http://www.giss.nasa.gov/data/gistemp/GLB.Ts.txt
They claim to know temperatures within 0.01 degrees, but didn’t even know the polarity of the trend.


Good point. If they had that kind of precision, there would NEVER be any reason for a later analysis to deviate from a previous analysis by more than the width of the measurement error. You’ve identified multiple instances where the deviation is very high, for example, just in this case alone we have a point at 1876 which is in error of almost 0.6°C on two analyses taken only 2 years apart. So let’s assume this is a 3? error, which should be extremely rare (I’m feeling generous). So this means the best ? error we can hope for is 0.6/3=0.2°C.
Distinct Categories and Detection:
If you want to know the number of categories you can detect with such a measurement system, the formula used is 1.41*?part/?error. Taking the GISS data you worked with today as the “part” process, but being generous again and only calculating sigma of the process for 31 year periods, the average of all such possible sigmas is 0.135°C (the short term ?). (this avoids calculating sigma over a trend, which would increase it to 0.231°C).
So we can distinguish 1.41*0.135/0.2 or 0.951 distinct categories in this process. Meaning the measurement system is so bad, we cannot distinguish between any two points (it is all in one “category”). You want as many “categories” as possible. For example, with 2 categories, you can distinguish “small and large”, with 3; small, medium and large. 5 categories is considered acceptable for automotive work by AIAG.
While taking a single analysis probably indicates quite good measurement error, by the same token, any time you see differences like this from one analysis to the next, it indicates very large measurement error in the system, a measurement system that is unstable over time, or a measurement system that has its own “special causes” (duh).
This is actually a pretty big hammer. These charts you are showing are actually a tacit admission by GISS that they can’t measure anything to better than one category, and their conclusions about trends are meaningless.
Don’t worry, it’s called ‘Proceeding Perspective’.
One day we mortal earthlings will understand it too. When Utopia opens it’s doors.
*its
Settled Polar Science Update. I don’t know if the Washington Times is widely read, but they have had a crack at the Antarctic stunt team.
http://m.washingtontimes.com/news/2014/jan/5/curl-irony-alert-global-warmists-get-stuck-in-ice/
Meanwhile the Sydney Morning Herald is living in the past. The disconnect between the PR spin from climate wankers and reality has never been greater.
Global sea ice is at record highs with Antarctica more than 2 standard deviations above the mean, and the SMH print this crap.
http://m.smh.com.au/environment/climate-change/chilly-warning-from-scientists-on-impact-of-antarctica-changes-20140106-30dmr.html
Have you questioned them on the missing data?
Call Marc Morano or Senator Inhofe or someone with a clue in the House of Representatives! Get those guys in under oath to explain themselves. These alterations are as large as the total claimed amount of global warming. What kind of culture has evolved at NASA GISS that this kind of activity is acceptable?? We need to go back to the original paper documents and transcribe all the reported temperatures. If those documents are missing, someone needs to be sent to jail.
Perhaps someone’s trying to avoid going to jail.
CDIAC does same thing..raw data shows flat or cooling but adjusted data set shows warming…these guys are tampering with data that pushes an agenda of hate against industrial and technological progress and that also hurts or kill millions in less developed countries..
short slide show about CDIAC data tampering here..
http://www.enertelligence.com/quietmajority/wp-content/uploads/2014/01/Revising-History.mov