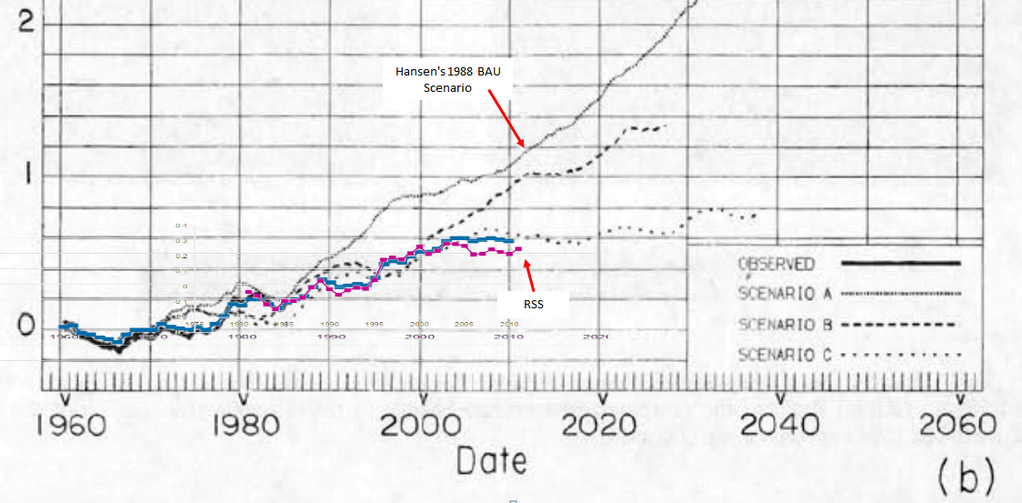
The deluded minions of Hansen convince themselves that his forecasts were correct. Classic case of the Emperor’s New Clothes.
Disrupting the Borg is expensive and time consuming!
Google Search
-
Recent Posts
- Gaslighting 1924
- “Why Do You Resist?”
- Climate Attribution Model
- Fact Checking NASA
- Fact Checking Grok
- Fact Checking The New York Times
- New Visitech Features
- Ice-Free Arctic By 2014
- Debt-Free US Treasury Forecast
- Analyzing Big City Crime (Part 2)
- Analyzing Big City Crime
- UK Migration Caused By Global Warming
- Climate Attribution In Greece
- “Brown: ’50 days to save world'”
- The Catastrophic Influence of Bovine Methane Emissions on Extraterrestrial Climate Patterns
- Posting On X
- Seventeen Years Of Fun
- The Importance Of Good Tools
- Temperature Shifts At Blue Hill, MA
- CO2²
- Time Of Observation Bias
- Climate Scamming For Profit
- Climate Scamming For Profit
- Back To The Future
- “records going back to 1961”
Recent Comments
- Bob G on Gaslighting 1924
- John Francis on “Why Do You Resist?”
- conrad ziefle on Gaslighting 1924
- Bob G on Gaslighting 1924
- Bob G on Gaslighting 1924
- Bob G on Gaslighting 1924
- conrad ziefle on Gaslighting 1924
- Bob G on Gaslighting 1924
- Bob G on Gaslighting 1924
- arn on Gaslighting 1924


The GLO-BULL warming loons have come into 2014 in a fighting mood and are telling their lies more often and screaming the lies louder in order to try and drown out any debate or opposition to their message. I first noticed the silliness on blogs about the cold weather with the claims of the cold being caused by globull warming and the onslaught has continued. Desperation??
For several years they complained that their message wasn’t getting out. I guess they’ve figured out that didn’t work, so they’re trying another tactic.
It is political war. I repeat, war. Surely that is obvious by now. What part of “The Insane Left” (which I have been claiming for several years now) is still unclear?
WRT alarmists’ desperation, is there any truth to the rumor that The “weather” Channel went to Facebook and Twitter to protest the DirecTV cancellation only to be lambasted by commenters for their weather/CAGW hype?
I don’t have either Facebook or Twitter, so I can’t validate that rumor. Maybe someone from this audience would be interested in checking out that lead.
U can read about it at WUWT …. here is the link http://wattsupwiththat.com/2014/01/11/directv-to-drop-weather-channel/
Stewart, the prophets of global doom certainly do seem to have made new year resolutions to double and treble the volume of propaganda, don’t they? I’m not a conspiracy theorist but after Climategate I don’t doubt that the high priests coordinate their marketing plans.
Texas sharpshooter fallacy
Didn’t Obama recently say that climate discussions in the White House are “heating up”? If they’re so certain, why should that be?
Because “heat” (in a passive-aggressive, i.e. lying, manner) is all Obama knows how to bring to the table. He is the First Cult-Leader President of the U.S., and it is all going downhill fast under the load of mass delusion.
So: the White House is “cooking up” some more lies.
The only thing that might be unclear in that graph to some people is that “BAU” stands for “Business As Usual.”
In other words, Scenario A (BAU) is what really happened with CO2 emissions. But temperatures are tracking at or below Scenario C, which is what supposedly would have happened if impossibly drastic CO2 emission reductions had been implemented.
Obey-Warm: “These aren’t the scenarios you’re looking for.”
Drone trooper: “These aren’t the scenarios we are looking for.”
“Move along.”
Hanson’s scenario C was based on a sharp reduction in man made CO2. From what I understand the generation of man made CO2 and the concentration of CO2 in the atmosphere exceed the levels used by Hanson for scenario A.
If these palookas want to show how far off Hanson was then they couldn’t have done better.