
Seven years ago, the leading expert at BOM announced the beginning of the permanent drought in Australia
Below is shocking imagery showing the progression of the drought, today in New South Wales. Avert your eyes if you are sensitive to this sort of thing.
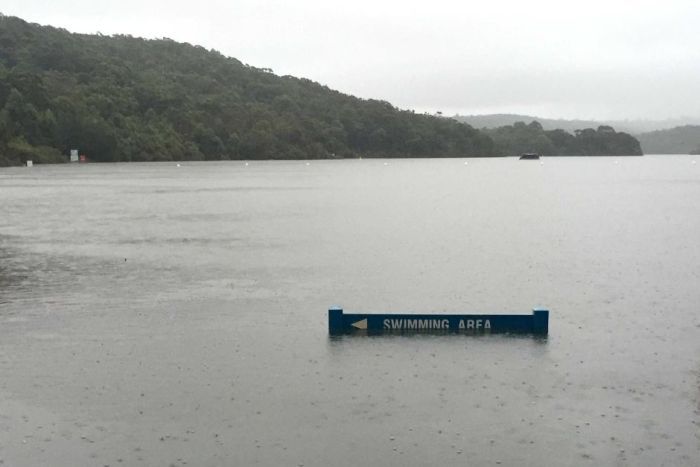
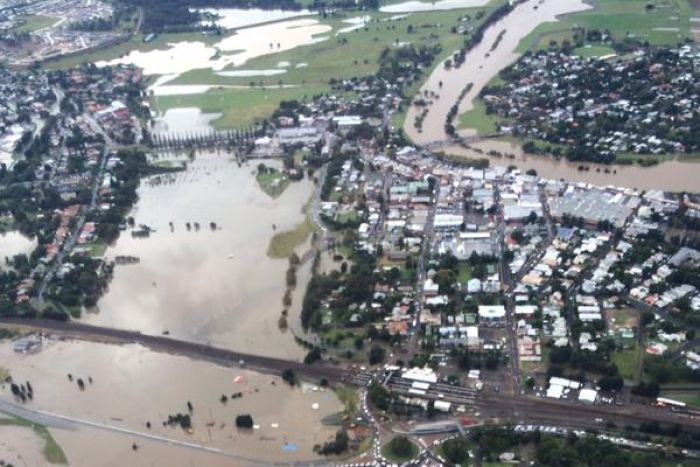

Wet, flooding droughts are the worst kind, and are yet more proof of climate change.
The permanent drought in Australia also caused so much rain to fall it was cited as the reason for the drop in sea-levels in 2011 (that, along with rainfall in the Amazon).
Soon after, the algorithm for satellite-derived sea-levels was changed and *poof* went the drop in sea-level.
It’s also cited (at the same time) that global warming is drying up the Amazon…
So there’s so much rain falling in AU and the Amazon that it’s causing sea-levels to drop but they’re in permanent drought and drying up at the same time.
“Soon after, the algorithm for satellite-derived sea-levels was changed and *poof* went the drop in sea-level.”
Colorado University’s Sea Level Research Group says the rate is 3.2 mm/yr
http://sealevel.colorado.edu/
and if you read the fine print at that web site you will find that 0.3 mm/yr is tacked on in order to make their chart a proxy for ocean volume, not sea level. So the actual figure according to them is 2.9 mm/yr. But it doesn’t stop there. CU has a history of editing the data that generates the charts and numbers. This can be verified via the Internet Archive WayBack Machine
https://archive.org/web/
where old web pages from
http://sealevel.colorado.edu/
can be accessed including the data as it was years ago. Here’s the page
http://sealevel.colorado.edu/files/2015_rel1/sl_ns_global.txt
for the raw data set as it is today, and here’s that same page
https://web.archive.org/web/20040719102733/http://sealevel.colorado.edu/2004_rel1.2/sl_ib_ns_cu2004_rel1.2_global.txt
courtesy of the WayBack Machine as it was in 2004.
Using Excel’s slope function, a comparison of those two data sets will show that the rate of sea level rise that can be derived from the 2004 data is 2.6 mm/yr. Today that same time series, 1992 to 2004, figures out to 3.5 mm/yr. What that demonstrates is that Colorado University has rewritten the historical data. Rewritten to increase the rate by almost a millimeter per year.
Besides that, it shows that the rate of sea level rise is somewhat on the decline. This easily verified by comparing the first ten years of the current data
http://sealevel.colorado.edu/files/2015_rel1/sl_ns_global.txt
with the second ten years of the data. The rate of sea level rise (1992-2004) was 3.5 mm/yr and the rate over the last ten years (2004-2015) is 3.0 mm/yr. Considering the changes to the historical data, the rate of sea level rise for the last ten years may very well be closer to 2 mm/yr.
And if you do an honest study of the tide gauges a rate of a little over 2 mm/yr over the last 30 years is about right.
I forgot to add the graphic, it looks like this:
http://oi59.tinypic.com/24e8482.jpg
Tim Flannery was just on ABC TV in Australia , defending the ” failed predictions ” but of course the ABC went easy on him,, because they too are devout believers in Global Warming. There are only a few Media outlets sympathetic to AGW these days – some stations treat it with contempt !
That dreaded droughtflood syndrome! We are all going to die! Dr. Hayhoe says it is so, so it must be so! Sounds just like the Biblical story about NOAA’s Ark!
It’s a bit soggy round here, but not too bad! We’ll be OK.
Caused by climate of course, and global warming too, and weather.
Mostly weather.
She was a big blow, just like the one in 1974 which dropped every TV antenna in the hunter valley and beached the asthma. I was doing a paper round and it took ages to get em all fixed. This was beside the floods, houses unroofed and trees knocked over. Mum n Dad still live in Newcastle. Power is knocked out but being Great Depression children, it’s no big deal for them. Gas and water are okay. Food & transport will be a problem for a while.
Sygna not “asthma”. Geez auto spell is crap
Yep, there’s still a lot of places without electricity.. sort of in patches all over the place. Half the traffic lights are out, if they don’t get them fixed the morning traffic will be fun.
Most roads I used last night were cleared of debris, but still lots of branches, stacked at the side of the roads. etc
I lost half of my back fence, but avoided any major problems and never lost electricity.
And I’m telling you that what you are seeing is not water. Water does not exist in a permanent drought. What you are seeing is “artificial” water. Much much different than natural water.
Or so would be my argument if I were a greenie progressive because there is no other explanation. If that is water, there is no drought and if there is no drought then there is no CAGW.
AGH2O
It’s all dry rotten water.
What most people don’t realize is that drought and flooding are affected both by the amount of rainfall in an area AND land-use changes due to population growth and development.
There was an article on another site recently discussing climate change in Africa. The locals said that climate change had cause more severe drought AND more severe flooding, simultaneously.
The more likely explanation is that as population doubles and triples and water resources are developed and tapped out the area becomes less resilient to dry spells. Converting forests to fields and fields to pavement increases the runoff and potential for flash-flooding. Meanwhile, annual rainfall may be constant or even increase, while the perceptions are that the climate is becoming more extreme.
Here is a good article by E. M. Smith on reclaiming desert with simple changes. It was used sucessfully in India in the 1970s.
https://chiefio.wordpress.com/2013/03/12/leucaena-leucocephala-collection-of-links/
Kalifornicatia is next for the Wet Drought. Oh! the Humanity!!
http://www.abc.net.au/lateline/content/2015/s4221859.htm
Interview with Tim Flannery last night on the ABC. Best question was “Is this storm the result of man made climate change?”
Tim’s answer – “It’s too early to tell”
So at what point can you tell if this specific storm is the result of man made climate change? Next week? in another 6 months?? Never???
There are more people living in Shanghai than live in Australia, but he is insisting that Australia cuts it’s… what’s the word I’m looking for here….. not pollution, not toxic waste, oh yeah, Carbon Dioxide output by 30%…
Reports of over 100,000 people without power in the last 2 days.. I’m sure if we were on solar, wind, hydro and tidal that would have been much less…. or maybe not.
My Country by Dorothea Mackella has this famous verse …
I love a sunburnt country,
A land of sweeping plains,
Of ragged mountain ranges,
Of droughts and flooding rains;
I love her far horizons,
I love her jewel-sea,
Her beauty and her terror—
The wide brown land for me!
While there is severe flooding in the Hunter Valley and in Sydney, there is a lot of Australia that is suffering from drought conditions.
http://www.bom.gov.au/web03/ncc/www/awap/rainfall/totals/12month/colour/latest.hres.gif
That poem was published in 1908.
I wonder how Kook and Nuttercelli would explain that away.
http://www.northernstar.com.au/news/uq-offers-free-course-fight-climate-change-denial/2616176/
Zoinks!
I’ve been off-line 4 days without power, but fortunately apart from some large branches down that was the only real problem. Tuesday was wild stuff. We don’t get cyclones otherwise it would be about a cat 2 cyclone (peak gusts were reported to be 135 km/h on a news bulletin I heard).
There are trees down all over the city, and large parts are still without power – the linemen are working their butts off. The grid damage is immense, since our city isn’t designed for such storms – unlike the Aussie towns in northern Queensland.
I was lucky, all I got was an old fence fall down, and couple of day were they wouldn’t let us into work. Its certainly fun negotiating all the dead traffic lights, isn’t it , though!
At my local bottleneck, you can see the people who regularly use that set of lights basically picking up the pattern of when the lights are working. 🙂