
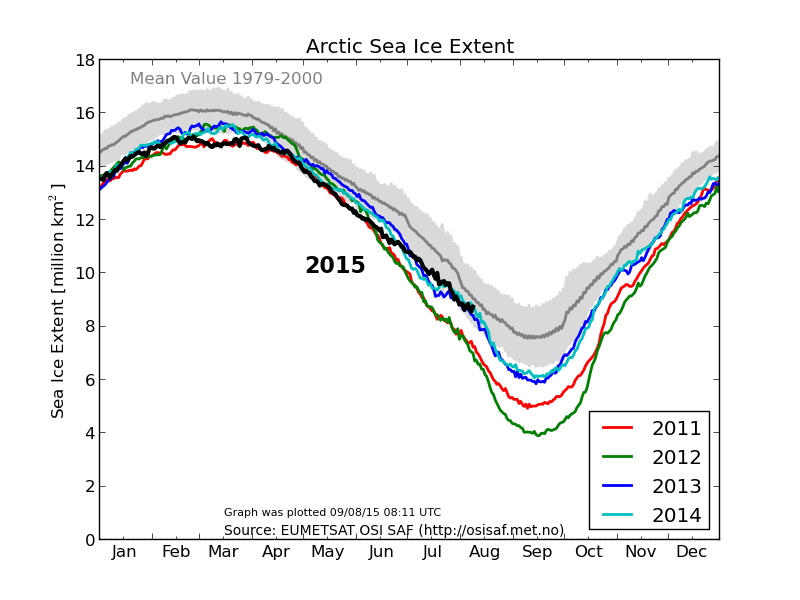
DMI hasn’t updated their 30% concentration map for 10 days, but their 15% concentration map is just about at the 1979-2000 mean.
The melt season has essentially stopped, with very cold air across the Beaufort Sea
The usual criminals in the press (Guardian, New York Times, etc.) and government agencies will of course not mention this, because reality and science wrecks their agenda.


Instead of admitting that their original hypothesis was terribly wrong as any genuine scientist would do, alarmists keep denying the obvious and torturing/rigging the data at an ever increasing rate. It is sickening.
It looks like the 15% graph stalled in late July, before the 30% graph.
The labels in the 15% graph are centered in the middle of the month. Look again
OMG, that’s right.Thanks.
This brings to mind the seasonal cycle of global warming alarmism:
* January -The polar vortex has been affected by global warming! Colder temperatures predicted by climate scientists(tm) !
* February – Huge snowstorms, a result of too much moisture in the atmosphere, are caused by global warming!
* March – Early Spring tornadoes – it’s global warming!
* April – Flooding rains – it’s global warming!
* May – Late Spring tornadoes – yep, global warming!
* June – Early tropical systems forming, all because of your addition to oil!!
* July – Hot temperatures everywhere – and you know where that comes from!
* August – Hurricanes! OK so there haven’t been that many, but the ones that have formed were the spawn of the great global warming monster!
* September – Arctic ice minimum! It’s the canary in the coal mine – the coal mines we’re shutting down to save the planet!!
* October – Late season hurricanes! Remember the global warming induced super-duper storm Sandy?? Do you want more of those? Then you must change your oil-addicted ways, mister!
* November – Nothing really unusual happens in November but if it does, it’s GLOBAL WARMING!
* December – More global warming snow – or less, then that’s global warming too! David Viner was right!
This is a rebound year for the Arctic & it could possibly achieve the greatest September coverage since Y2K. It’s very likely to track in the normal range in the coming months.
It looks to me as I have been watching it for a number of days that the ice on the south side of Baffin Bay has been actually growing during the last 10 days or so. Is this usual for this time of year?
Also, the site Sunrise’s Swansong has been showing buoy video evidence that a lot of ice is both thawing and refreezing around the buoys. This can’t be good news for the portion of the AGW crowd that is fixated on the Arctic.
I think every portion of the AGW crowd becomes fixated on the Arctic any time they think there is propaganda value in the ever changing events up there. But at least what before was a constant stream of bull about Polar bears and walruses seems to have died down over this past year.
Yet another poster child bites the dust!
Do me a favour Steve! Here’s today’s DMI 30% graph for your edification:
https://stevengoddard.wordpress.com/2015/08/09/arctic-sea-ice-extent-almost-exactly-normal/#comment-535020
On closer inspection I see what you’re getting at. The date at the bottom of the 30% extent graph changes every day, but the last data displayed is from August 2nd. Even though the OSISAF concentration maps are all present and correct.
No science. No observations. Predictions from computer models, based on cooked data. It’s amazing how idiots/crooks like Gore and Obama could rise to the levels of president and vice-president in the USA. However, I’m in no position to throw stones. In Africa we have formidably incompetent/corrupt leaders too.
Why Cryosphere is giving 1.7 million below average?
http://arctic.atmos.uiuc.edu/cryosphere/IMAGES/seaice.anomaly.arctic.png
https://dmhscratch1.files.wordpress.com/2015/07/seaiceanomalyarctic-aug-10-2015.png
It makes no sense, it’s totally incompatible with the DMI graph.
The different reference averages, 1979-2000 (DMI) and 1979-2008 (Cryosphere), should give a *smaller* difference to the average for Cryosphere than DMI.
Are they using different ice concentrations?
What about the Antarctic ice,
http://arctic.atmos.uiuc.edu/cryosphere/IMAGES/seaice.anomaly.antarctic.png
https://dmhscratch1.files.wordpress.com/2015/07/seaiceanomalyantarctic-aug-10-2015.png
Is it back to negative anomalies again?
if “yes”, how can we understand this new trend if the southern oceans are quite cold (as they’ve been in the last few years) in comparison with the NH,
http://weather.unisys.com/surface/sst_anom.gif
Sometimes the Cryosphere graph seems to diverge from other data.
They are warmists. I don’t trust any climatologist with AGW religious zealotry in charge of datasets. Look at GISS and NCDC. The J. Taylor smear on their page was an eye-opener. They are planning on the ice amounts to drop.
“Are they using different ice concentrations? ”
Well one is using extent and one is using area for a start. There is a lot of diffuse ice up there currently.
Andy
Yep…. extent, 15 or 30% concentration… all ways to confuse low information people into thinking the Arctic Ice is Shrinking, when its really growing..
One thing about snow and ice, sea ice, glacier ice, river ice, all kinds of ice. It’s much harder to deceive people about snow and ice, because it’s very hard to adjust ice. Or snow.
Absolutely right,,, there is nothing like tangible evidence – such as the need for Icebreaker Ships or Cities requiring more Snow Ploughs. Extreme snow & ice is hard to hide and further exposes the AGW propaganda as fraud. Of course they can claim it’s just weather or warm snow,,, but every Continent is cooling year after year; it’s a trend..
…
Remember the nonsense claims by Global Warming proponents that animals will suffer from a loss of “Ice & snow” ?? The following story shows how the Wild life is having to adapt to what is tangible evidence of Cooling; in Australia, the sunburnt country…
http://www.abc.net.au/news/2015-08-11/currawongs-in-mid-winter-quest-for-food/6689804
I know the claims well, and it’s sickening. Really. If it was heat causing the deaths’, front page story, all kinds of screaming and weeping and gnashing of teeth.
But cold deaths?
Not a peep.
The National Civil Defense Institute (INDECI) reported on 5 August that cold dead animals reach 912 300. At the time of writing that number could have risen to one million. Most are fine alpacas. There are also 508,000 sick animals.This is a disaster unparalleled in our history
http://www.connuestroperu.com/actualidad/punto-de-vista/47404-frio-mata-un-millon-de-cabezas
A record disaster, and the warmists don’t care. Unless it heat, then they will moan about it forever.
Yes sfx2020 ; it’s another form of warmist cherry picking – ignoring such a tragedy because it turns over their “warming” doctrine. Sad to see the Alpaca losses in South America; the very warming predictions play down the possibility of freezing death – it’s another area of irresponsibility surrounding AGW proponents; you’re right.
This comment ” The melt season has essentially stopped” has been being said since 27th July or so on here. But if you look at the JAXA daily melt rates since then
-49680
-63818
-88586
-77604
-95719
-70137
-117208
-59364
-22466
-46166
-67140
-89264
-93170
-99014
It has not stopped at all. Since Steve/Tony has been saying it has stopped and it’s cold up there a total of over a million km^2 has melted. How many Manhattans is that? Best to wait till mid September for a better comparison to previous years. It’s not long.
Andy
It would be better to use JAXA graph too, it shows more years and they haven’t used such a thick “crayon” that it’s hard to make any judgements.
https://ads.nipr.ac.jp/vishop/vishop-extent.html?N
Andy
nope,it would not andy. been too many issues with the output of those models this summer .i agree we need to wait and see,but there is way too much interpretation going o in all the “data” sets to come to much of a conclusion at the moment.
those ice free holes depicted in the beaufort are far from ice free. looks like nsidc still have a problem seeing sea ice in hudson bay,so the problem may well extend to other regions,i do not know,as they were not very clear about the issue other than there was a “problem”.
also,what do you think to the charts that have been displaying a huge area of so called 1 metre thick ice for weeks on the atlantic side of the arctic ? either the surface and wter over there is incredibly cold, or the ice was a lot thicker than 1 metre 6 weeks ago.
lots of iffy output from the various arctic modeling teams this summer,who knows ,they might just decide they cannot decide on a figure for this years low if it does not go the right way in the lead up to paris (just joking,cynical, me ? nah 😉 )
From the same source (http://ocean.dmi.dk/arctic/icecover_30y.uk.php) — minimum ice extent for the last 30 years:
http://ocean.dmi.dk/arctic/plots/icecover/osisaf_nh_iceextent_monthly-09_en.png