
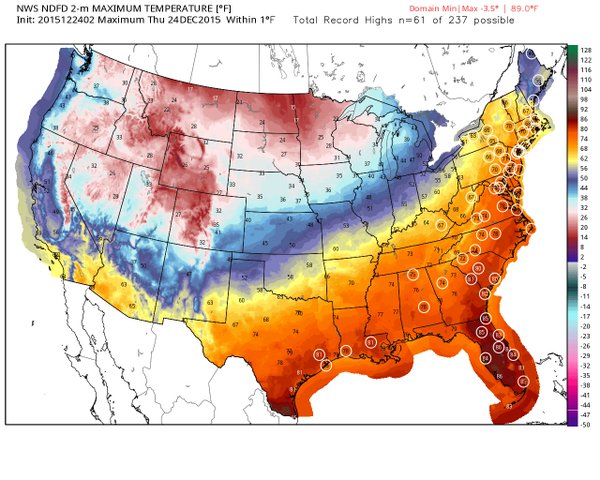
Drudge is touting the “record heat” forecast for Christmas Eve, even though most of the country will be below normal temperature. The best Drudge could come up with was 86 degrees at Orlando.
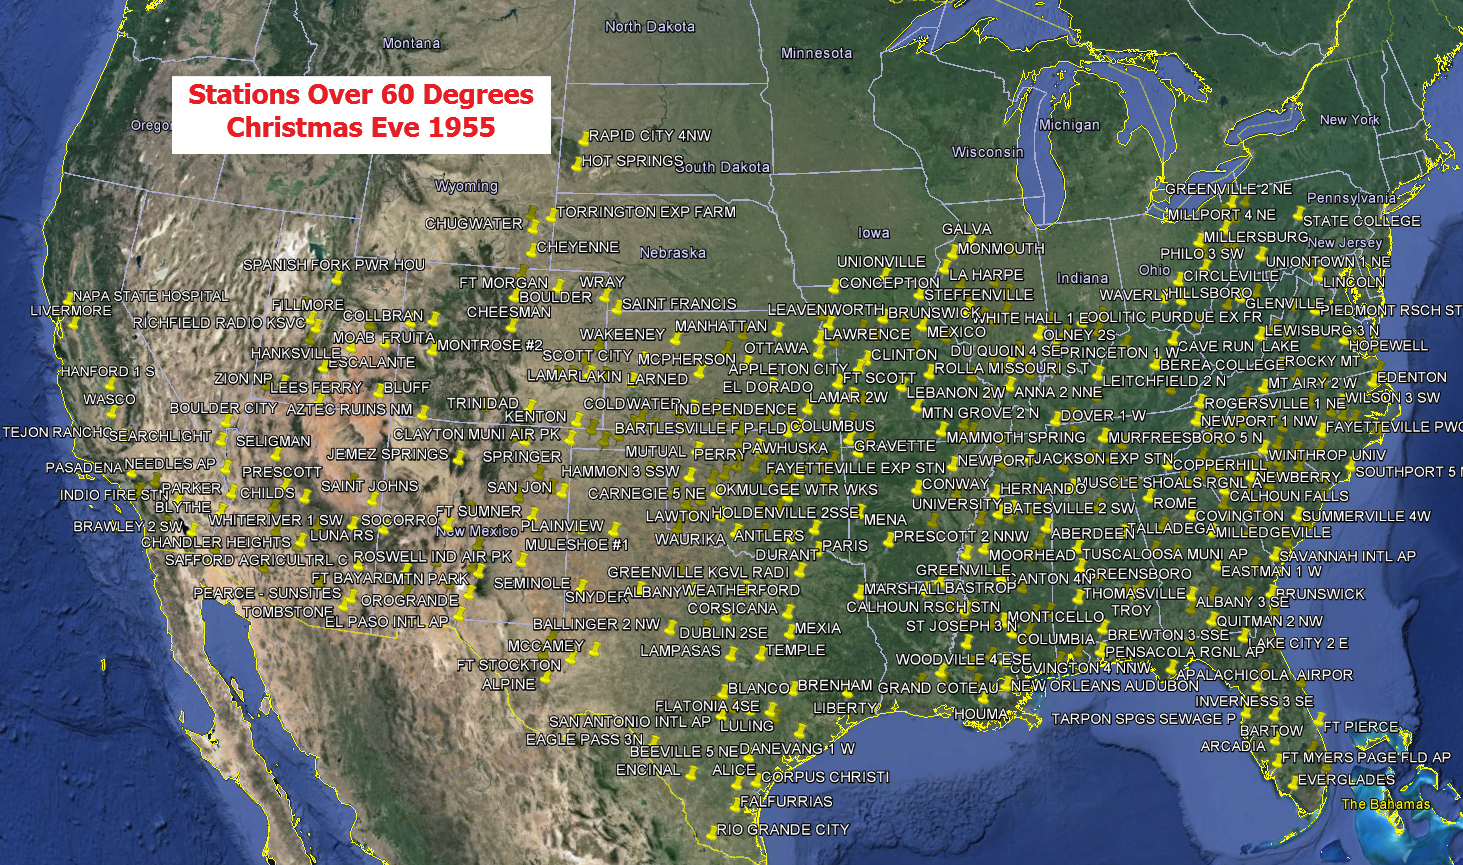
Christmas Eve 1955 was much warmer. Three fourths of the country was over 60 degrees, and Ashland Kansas, Geary Oklahoma and Encinal Texas were all over 90 degrees. Fort Lauderdale was 85 degrees. All of the stations below were over 60 degrees on Christmas Eve, 1955.
Last winter, the East Coast had record cold. That was ignored because it was “less than 1% of the Earth.” But this week, the Eastern US defines the global climate.
In Irving Berlin’s 1954 musical “White Christmas” – the story line was 70 degrees in Vermont on Christmas eve and no snow. That was why they were “Dreaming of a White Christmas”

Thanks Tony, too bad your excellent job of putting the proper perspective this issue will not be similarly covered in our wonderful “Main Stream” media.
A Blast From the Past!
https://stevengoddard.files.wordpress.com/2014/01/shockingpolarvortexfrom20000yearsagovs20140122v001.png
Andy DC dug up this 1993 NCDC document, which showed that US winter temperatures had remained essentially constant from 1896 to 1993.
https://stevengoddard.files.wordpress.com/2015/04/screenhunter_8730-apr-19-22-441.gif
Since 1993, US winter temperatures have plummeted
https://stevengoddard.files.wordpress.com/2015/04/screenhunter_8743-apr-20-07-17.gif
But that would never do, so NOAA got rid of the cooling via adjustments.
https://stevengoddard.files.wordpress.com/2015/04/screenhunter_8733-apr-20-06-30.gif
But it is a lot tougher to make snow disappear (Just ask Buffalo NY or Boston MA)
https://stevengoddard.files.wordpress.com/2014/09/screenhunter_2653-sep-10-08-25.gif
That is all ignored by the Alarmists.
………
(Steven’s graphs from other posts)
They also cannot make ice on the Great Lakes disappear, as they froze to a record extent during the last two winters. Or make ice and snow disappear from the Potomac River, which was frozen over in March for the first time in recorded history. All during the warmest years EVER!
But they sure as heck can prevent any or all info of a possible cooling climate from appearing in the news.
That is why I like Ice Age Now as an ‘other side of the story’ site for the local news stories we never ever see in the likes of Huff & Puff or NYT.
This from last winter is a classic example:
December 6, 2014Heavy snowfall continues in Japan “20,000 homes without electricity. Tokushima Prefecture [Japan]…. on the southwestern island of Shikoku, 120 vehicles were trapped by heavy snowfall for 18 km (10.8 miles), RIA Novosti reports. The snow is 30 cm (12 inches) deep.
Tokushima (lat. 34.0° N) altitude of 26 feet, is mild and semi-tropical sort of like South Carolina (lat. 34.0° N) but not as hot. Japan was in really bad shape last winter with snow storm after snow storm. In that storm at least 8 people confirmed dead, buildings and roofs collapsing.
The previous winter, a record breaking snowstorm in mid February (2014) passed through Tokyo. Hundreds of people have to be evacuated from their homes, roofs collapsed, hundreds were injured, with at least 13 dead. Another storm hitting at the end of February causing damage or destruction of 14,099 vinyl greenhouses costs totaling more than ¥50 billion in Tokyo and four other prefectures.
Moscow reports that first week of December snowstorm (2014) So what does Huffington Post report?
Two days after the storm a search returns this puff piece: Scarecrows Outnumber People In This Dying Town — http://www.huffingtonpost.com/…/japan-vanishing-villages_n_6287770.html?
WTF!??!
A major snowstorm in the equivalent of South Carolina, buildings collapsing, thousands without power, 120 vehicles trapped and at least 8 people confirmed dead and ALL the Huff & Puff can find to report on is scarecrows???
http://queenprocrastinator.files.wordpress.com/2010/11/banging-head-against-wall-11.jpg
I don’t get it – all the data presented on this website supports the climate change narrative, but it appears to be site for deniers. What gives?
Twilight Zone music ….
The May 2013 snowstorm in Arkansas also deserves mentioning. Going back to the 1820’s, it had never snowed in Arkansas, not even a flurry, during the month of May. The May 2013 snowstorm was widespread and produced up to 5″ in places.
donn juan says “I don’t get it – all the data presented on this website supports the climate change narrative, but it appears to be site for deniers. What gives?”
>>>>>>>>>
CO2 is not the only thing that causes ‘Climate Change’ Actually it is a minor bit player, if that.
Many of us have training in science including geology so we know the climate ALWAYS changes. Not only than since the Earth is at 1/2 precession, the earth is at the point where glacial inception can occur. Glacial inception at the end of the last interglacial was a ‘madhouse’ as the climate flipped between the greenhouse and the icehouse.
And the changes can be fast.
You can look at the calculations from NOAA (Berger) for jun @ 60? N
http://www1.ncdc.noaa.gov/pub/data/paleo/climate_forcing/orbital_variations/berger_insolation/insol91.jun
Low point of the last ice age – around 463 Wm?2
NOW (modern Warm Period) — 476Wm-2 (13 Wm-2 higher than low point)
Holocene peak insolation — 522.5 Wm-2 (46.5 Wm-2 higher than present)
When can glacial inception occur?
A fall 2012 paper “Can we predict the duration of an interglacial?” says…
This paper, also gives the 21 June solar insolation @ 65? N (Not 60? N) for termination of several interglacials. Current Solar insolation = 479 W m?2
MIS 7e – insolation = 463 W m?2,
MIS 11c – insolation = 466 W m?2,
MIS 13a – insolation = 500 W m?2,
MIS 15a – insolation = 480 W m?2,
MIS 17 – insolation = 477 W m?2
Now go back and look at the ‘polar vortex’ and compared to last winter.
https://stevengoddard.files.wordpress.com/2014/01/shockingpolarvortexfrom20000yearsagovs20140122v001.png?w=1056
or the jet stream now
http://squall.sfsu.edu/gif/jetstream_norhem_00.gif
A ‘cold/cooling jet stream is meridional (loopy) like we have now instead of zonal (straight) like we had a decade ago. A loopy jet means more erratic weather and it means warm tropical air is sucked north where it clashes with polar air sucked south and you get major storms that dump lots of snow like the 6 to 7 feet in one storm that we saw last winter. Add cool summers and you get glaciation.
NOAA refers to Hollan 2000 and Berger 2002 to say there will be no return of Glaciation. Hollan 2000 is a Pop. Article and Berger 2002 refers to Berger and Loutre. Both are based on MODELS. NOAA uses NONE of the more recent research that refute these papers.
What does rigorous science say?
Any hope that the Holocene would go long was shot down by Lisiecki and Raymo in 2005 in their rebuttal of the Loutre and Berger, paper of 2003. Lisiecki and Raymo in a landmark paper took an exhaustive look at 57 globally distributed deep Ocean Drilling Project seabed cores.
A Pliocene-Pleistocene stack of 57 globally distributed benthic D18O records
Since then no one in Quaternary Science has rebutted Lisiecki and Raymo. Not a fact to give one warm fussy feelings. Their research says no warming for ‘another 65 thousand years’ and a good possibility of a return to the Ice Box ‘without human influence’
In the comments on that moron Bette Midler’ s Twitter ing about “deniers”….one commenter put up a weather report, from January 1790 in Philadelphia….median temp was 44, with it frequently rising to the 70’s on sunny days…
So, the alarmists have discounted or completely ignored common weather records going back at least 225 years…
The lefty Socialists are using their lies, altered data, etc. to further their agenda, to gain control and absolute power…
If stuff like this doesn’t get thru to people that they are being lied to, I don’t know what will…short of major political change, perhaps even violence, to remove these corrupted criminal politicians and their cronies…
We should hope people pay attention, do their civic duty and vote for candidates that will return this country to it’s founding principles.
Ft. Eustis Va. 1955 temp 75o just 100 miles so. of DC where it was 74o. 3″ of snow on ground left from earlier in week. 5 Hawaiians in my Army air transport class out barefooted in their first snow.
Since 20,000 years ago, humans weren’t pumping gigatons of CO2 into the atmosphere, I’m not sure what relevance the top comparison image has in any of this.
Remember, it’s called global warming for a reason. It’s not eastern U.S. warming, or even United States warming.
Since climatology has long shown that the warmer the atmosphere, the more moisture it can hold, it comes as no surprise that rain and snow would be increasing in areas where precipitation and snow already occur.
Yes, I remember 1955 Christmas in Fl. It was so beautiful that Christmas, and having only moved to Fl in 1950, we thought we had died and gone to heaven. After 1955 Christmas, my dad had a pool put in the back yard…..what a life. Yes, life was simple back then.
Simple…….with measles, polio, etc. And no internet. 🙂
I remember it well. I’ll take the today every day! haha
Thanks for this article. We’ve been bummed about the warm springlike weather here in Ohio, but it’s nice to know that we’re having a ‘1955 Christmas’ this year — it goes well with our aluminum tree!
It doesn’t need to, I followed the link here from Drudge Report, 23+ million page visits in the last 24 hours.
Why does the fact that the Earth’s Surface, which has been paved and concreted over quite a bit in the last 80 years, not see MORE of a historical increase in heat? The concern should be why isn’t it hotter on average than? Absent that, I think the global coolers of the ’70s may have been right.
If the forecast is correct, down here in Newcastle, Australia, temperatures for December will be very close to the long term average… and that average is based on 1957-2014 !
Does the term “normal” apply?
AndyG55—I didn’t know you were from down under.
Have a Merry Christmas!
Certainly it will not be a white Christmas down here.
Been raining the last couple of days, but hopefully Xmas day will come out sunny.
Things to do that would be far better with fine weather.. 🙂
Happy whatever.. and HumBug to all 😉
BAAAAAAaaaaa Humbug!
https://www.youtube.com/watch?v=HJwyuplNmx8
Flying Reindeer??? Lies all Lies put out by the EU!
Don’t you know that normal weather is evidence of Climate Change?
Darn. 🙁 They really have every angle covered, don’t they 😉
#White Christmases Matter.
It will be dealt with and stopped. Rosalind Brewer is calling the white Old Man about the composition of his elf team. And our precious flowers are on the case:
https://www.youtube.com/watch?v=_gFgmXe3q1s
Rosalind Brewer is Sam’s Club CEO
“Sam’s West, Inc. (doing business as Sam’s Club) is an American chain of membership-only retail warehouse clubs owned and operated by Walmart.” — WIKI
Primary Contacts for Walmart.
Greg Foran
President and CEO, Walmart U.S.
702 SW 8th St
Bentonville, AR 72716
[email protected]
Chief Executive
Doug McMillon
President and CEO, Wal-Mart Stores, Inc.
702 SW 8th St
Bentonville, AR 72716
[email protected]
You can guess where my Sam’s Club card is headed….
I wonder if Rosalind has any issues with the NBA?
I wrote Walmart to express my dissatisfaction. I have not even received an acknowledgement.
I see that you’re a racist troll.
Get off that eggnog, Larry, and start paying attention to what you are typing.
Rosalind Brewer made some questionable racial comments on TV but it’s a stretch to call her a troll. She’s the company’s CEO.
On the other hand, you are a troll.
You mean ‘ I’m dreaming of colorless happy holidays.
Don’t be silly Robert!
http://whns.images.worldnow.com/images/8178112_G.jpg
http://2.bp.blogspot.com/-3-nzWU9CKWQ/U06GUwHYXQI/AAAAAAAAEbM/nH9PHrNFWkg/s1600/dispersion-of-white-light.gif
http://i4.mirror.co.uk/incoming/article7044716.ece/ALTERNATES/s615b/Star-Wars-takeover-at-The-White-House.jpg
Only the elite troopers are black.
http://vignette2.wikia.nocookie.net/starwars/images/9/9c/Shadow_Stormtrooper_figure.png/revision/latest?cb=20150427053501
http://starwars.wikia.com/wiki/Shadow_stormtrooper
(-;
Our country is ruled by an international cloud of government deception that has hidden reality from the public for the past seventy years (1945-2015) – after nations were united on 24 OCT 1945:
Any scientist that has managed to stay in contact with reality has an obligation this holiday season to be like the bird Tagore described as “feeling the warmth and starting to sing before the darkness gives way to dawn!”
Low temperatures at the North Pole.
http://ocean.dmi.dk/arctic/plots/meanTarchive/meanT_2015.png
The polar vortex height of about 27 km.
http://earth.nullschool.net/#current/wind/isobaric/10hPa/orthographic=-65.56,87.76,300
Jus’ sayin’: The Movie Musical, “White Christmas” was not set it New Hampshire. It was set in Vermont. –Just being a bit nit-picky this morning… It is 76 degrees in Raleigh, NC. –Not exactly Christmas weather for us : (
We are a bit south of Raleigh, NC. with 75F (rural temp station) It is really nice to day and great NOT to have it raining. (Rain starts again tomorrow. Sighhhhh)
Not only that but the clip in question from Der Bingle was set in Europe Christmas of 44. And it was colder than a well diggers rear then. Think Bastogne. This global warming stuff is crap. Climate change always has happened and always will happen. Merry Christmas all.
Last year WAS more unusual
The whole planet was in record breaking heat while the East Coast was quite cold
Of course the climate Rutgers failed to note that even last year was overall the 7th warmest winter in the USA
WHAT BULL!!!
The cold events were NOT REPORTED in the MSMS and that is all.
I just mentioned Japan getting plastered last winter and the winter before in my comment above yet not a peep from the US news agencies.
Italy captured the world’s one day snow fall record twice this last winter in March TWICE.
240cm (7.84 ft) in Pescocostanzo
256cm (8.34 ft) of snow Capracotta
10 feet (3 meters) of snow fell on Passolanciano, Majella burying the chairlifts (6 Mar 2015 ) and Record snow fell in Abruzzo, Italy, 5 & 6 Mar 2015
Not far away, the Greek islands in the Mediterranean were buried under 6½ ft (2 m) of snow in January.
During Ice age glaciation glaciers form in two main areas, the eastern half of the USA and the western half of Eurasia. (Scotland and Scandinavia) So what happened there?
In Norway they were forced to remove excessive snow from ski slopes – “During the last two days we’ve got more snow than we had in the last two years together,” says Vegar Sårheim. “I had never believed we would experience this.”
Almost 300 “snow patches” remained in the Highland mountains in 2014
(wwwDOT)bbc.com/news/uk-scotland-33581400
Glacier-like hazards found on Ben Nevis in 2014
http://www.bbc.com/news/uk-scotland-highlands-islands-28885119
August 27, 2015 — Massive Increase in Scottish Snow Patches
https://weatheraction.files.wordpress.com/2015/08/wpid-scottish_snow_patches_20150827t140213.jpg
http://stommel.tamu.edu/~baum/paleoveg/veg-adams-big.gif
For the last three winters:
2013
Record cold in Cape Town, South Africa
Rare snow in Atacama desert
Brazil – Snow in over 80 cities – Roads and schools closed
Worst cold spell in 80 years hammers Chile fruit crops
More than 25 000 animals killed in southern Peru
“Extraordinary” cold and large snowfall for southern Brazil
Lao Cai Province [Viet Nam] alone, an unusual snowfall early this week caused an estimated loss of around VND10 billion
Jerusalem hit by worst snowstorm for TWENTY YEARS as eight inches fall across Holy City
Wintry blast to hit New Zealand
July frosts reduce Brazil wheat, coffee
Tibetan nomads in Ladakh call out for help, Thousands of livestock perish
first time snow has fallen in the state of Arkansas during the month of May
Single-day record May snowfalls have likely fallen in Iowa, Minnesota, and Wisconsin.
Blizzard Of 2013 Reaches Top 5 Snowstorms In New England History
Snow in Malta 2013 -. Malta has experienced just four snowfalls since 1895.
Rare June snow blankets northwest China.
2014
Record snowfall (almost 7 ft) in northern Iran
Temperatures up to 40 degrees below normal in the [US] High Plains
Slovenia paralyzed by snow and ice
Southern Austria on highest avalanche alert after heavy snow – A meter of snow in two days – Valleys and roads cut off
Serbia – 1,000 evacuated from cars, buses and trains – Snow drifts 3.5 meters high
Poland – Heavy snowfall and blizzards
Heavy snowfalls and blizzard hammer southern Romania
Tibetan nomads in Ladakh call out for help, Thousands of livestock perish
Brisbane – Vegetable prices expected to soar due to cold snap
Green Bay made it 49 days with subzero temperatures, the most in a winter. The previous record, 48 days, was set in 1976-77. Just before 4 a.m., the temperature was minus 18, breaking the previous record of minus 17 set in 1962. The mercury continued to fall to minus 21 just before 5 a.m., according to the National Weather Service office in Ashwaubenon.
Aemi tropical Tokushima, Japan (34.0° N same as South Carolina) has been hit with major snow storms roofs collapsed, at least 8 dead.
NOVEMBER 2014
Iran – Snow and blizzards began in early November and still continue
Turkey – Heavy snowfall knocks out power for 4 days – and still counting
Russia – Minus 32 degrees and Heavy Snow in Tomsk
One meter of snow in eastern Turkey
Buffalo – 30 major roof collapses, 100 minor collapses (SEVEN FEET of snow in one storm)
Ice on the Mississippi River in Iowa (Nov 20
DECEMBER 2014
Heavy snowfall shuts down six highways in China
Early Winter Storm Hammers Vermont – Power Outages “Unprecedented”
Heavy snow shuts down Trans Canada Highway east of Quebec City
Algeria – Heavy snowfall brings complete paralysis of most educational institutions
Japan – Heavy snowfall kills eight
Kazakhstan – 530 people rescued from snowdrifts since the beginning of winter
Heavy snow knocks out power to 10 municipalities in Bulgaria
Heavy snowfall traps people on the road in Mersin, Turkey
Austria ice storm – So bad that authorities use tanks to move supplies
Heavy snowfall continues in Japan
Six greenhouses collapse under heavy snow in NE China
Waist-deep snow in China – Most severe snowstorm in years
Record snowfall in Juneau, Alaska
Serbia – Ice storm and deep snow – People experiencing mental breakdown after 48 hours without electricity, water and heating
Austria – Rare ice storm hits Waldviertel
100,000 Czech travelers stranded due to freezing arctic weather
Eastern Turkey – Heavy snowfall reduces visibility to 16 feet (5 m)
All these snow events resulted in Northern Hemisphere snow cover last fall highest ever on record.
2015
Canberra’s coldest winter in 15 years
Bogota, Colombia, covered in 24 inches of snow
Record snow in Abruzzo, Italy (elevation 36 ft) for about 24 consecutive hours it snowed persistently recording a total accumulation of 1 meter and a half.
World Record Snowfall in Capracotta, Italy Previous record Silver Lake, Colorado, USA with 75.8 inches
Greek islands in the Mediterranean buried under 6½ ft (2 m) of snow
Heavy snowfall causes road closures in Mexico
A very unusual snowing forced the closure of the Mexico City – Puebla City 150-D highway
Norway – Forced to remove excessive snow from ski slopes – “During the last two days we’ve got more snow than we had in the last two years together,” says Vegar Sårheim. “I had never believed we would experience this.”
2010:
Feb 13th 2010 – Snow in all 50 U.S. states
20 million farm animals may die in Mongolia before spring as the fiercest winter in living memory grips the country,
Record Snowfall for Baltimore
Freak snow storm covers southern France
Freak snow falls in Spain strands 6000.
Scotland records coldest winter
Temperatures were glacial across Europe over the weekend, kills 22 across Europe
Snowfall in St. Petersburg [Russia] breaks 130-year record
Hundreds freeze to death in Peruvian Andes
Snow in Brazil, below zero Celsius in the River Plate and tropical fish frozen
2012:
Low temps in Peru – Death toll rises to 31
Freak cold in the Andes kills hundreds
Cold Blast Claims Over 600 Lives Across Eastern Europe/Russia…”Death Toll Keeps Rising…State Of Emergency”
Coldest January on record for parts of Alaska
2012 the coldest July on record in Anchorage Alaska
Shortage of food in Uzbekistan city due to snow
The First Time Occurred, Snow Storm Hits West Sumatra, Indonesia on Wednesday, March 28. – Snow record broken in South Africa
Johannesburg marvels at rare snowfall
Unprecedented cold in Morocco
Heavy snowfall in Tunisia, Roads in Ain Draham blocked by 31 inches (80 cm) of snow
The year 2011 was a real winner.
Three CAGW icons fell, sea level rise, glaciers shrinking and polar bear extinction, while one child was burned to death in the name of global warming mitigation. Climate Justice Day in NYC got buried in RECORD SNOWFALL and the Met Office Announced – Europe May be Facing Return Of ‘Little Ice Age’ On top of that Montana’s Glacier National Park, in Colorado’s Front Range, in Wyoming’s Grand Tetons, the glaciers and snowfields are actually gaining volume according to Bob Comey, director of the Bridger-Teton National Forest Avalanche Center. “I’ve never seen a season with a gain like we’ve seen this summer,” Comey said.
Research from the Met Office suggests that Europe could be facing a return of the “little ice age” that gripped Britain 300 years ago, causing decades of bitter winters, Leake warns. The prediction, to be published in Nature, is based on observations of a slow-down in the sun’s emissions of ultraviolet radiation
thegwpf(dot)org/the-climate-record/4062-met-office-u-turn-europe-may-be-facing-return-of-little-ice-age.html
2011
23 Aug 2011 — NASA Global sea levels DROPPED 5mm in 2010
September 16, 2011 — Sea Level Continues Decline
The two-year-long decline is continuing at a rate of 5mm per year
in August 2011, NASA announced that global sea level was dropping and was “a quarter of an inch lower than last summer.” http://iceagenow.info/obama-promise-sea-levels-fall/
http://iceagenow.info/wp-content/uploads/2011/09/DecliningSeaLevel1.png
Envisat numbers here:
ftp://ftp.aviso.oceanobs.com/pub/oceano/AVISO/indicators/msl/MSL_Serie_EN_Global_IB_RWT_NoGIA_Adjust.txt
2 Aug 2011 Polar Bear Population “May now be near historic highs”
“The U.S. Fish and Wildlife Service estimates that the polar bear population is currently at 20,000 to 25,000 bears, up from as low as 5,000-10,000 bears in the 1950s and 1960s,” says article by Amrutha Gayathri.
September 23, 2011 Armed troops burn down homes, kill children in name of global warming
Armed troops acting on behalf of a British carbon trading company backed by the World Bank burned houses to the ground and killed children to evict Ugandans from their homes in the name of seizing land to protect against “global warming, Villagers told of how armed “security forces” stormed their village and torched houses, burning an eight-year-child to death as they threatened to murder anyone who resisted while beating others.
“The government and the company said the settlers were illegal and evicted for a good cause: to protect the environment and help fight global warming.
NOTE: The ‘settlers’ have been there for years but since Africa does not have land deeds the government can say they are squaters even if the famly has been there since prehistoric times. I used to have a link explaining the land deed problem that makes Africa and South American peasants such easy targets.
28 Mar 2011 — All seven glaciers on California’s Mount Shasta are growing – Record snowfall to spur even more growth –
Not only are Mt. Shasta’s glaciers growing, two have nearly doubled in size. Both the Hotlum and Wintun Glaciers have nearly doubled in size since 1950. With a record 98 inches of snow during the month of March, and an estimated 6 feet of new powder during the past week, the Mt. Shasta Ski Park is extending its ski season.
15 Aug 2011 New Zealand Snowfall Sets New Records, Blizzards in New Zealand ground flights, close roads, shut down mail delivery and shut off power in what forecasters describe as once-in-a-lifetime conditions. – The cities of Wellington and Auckland saw their first snow for decades. First snow in downtown Auckland in 72 years.
(wwwDOT)irishweatheronline.com/news/atmosphere/cold/new-zealand-snowfall-sets-new-records/32154.html
31 Aug 2011 – Met Office figures indicate UK – Coldest summer in nearly 20 years
(wwwDOT)telegraph.co.uk/topics/weather/8730125/Parts-of-Britain-suffer-coldest-summer-for-nearly-two-decades.html
31 Aug 2011 — Ireland – One of coldest Augusts since 1851
Following the coldest June in nearly 40 years and the coldest July in 50 years, this month is now one of the coldest Augusts since records began in 1851.
(wwwDOT)independent.ie/national-news/what-summer-august-was-coldest-in-25-years-2861997.html
31 Aug 2011 — Snow fell as low as 6,500 feet in Montana’s Glacier National Park and the neighboring higher terrain in Canada.
(wwwDOT)accuweather.com/blogs/news/story/54489/first-snow-of-the-season-1.asp
14 Sep 2011 Early Freeze Could Severely Damage Minnesota Crops
“Wednesday night’s overnight forecast of 25 degrees could be very damaging,” said Zastrow. “Twenty-eight degrees [F] will pretty much kill everything.” A normal frost isn’t seen until late September
http://ksax.com/article/stories/S2284262.shtml?cat=10230
16 Sep 2011 Winter Arrives Early In Minnesota
Record cold in International Falls – Duluth ties record for early winter snowfall And with a temperature of just 19F (-7.2C) on Wednesday, International Falls, Minnesota, endured the coldest temperature on record for the time of year and the first time that a local reading in the teens has been recorded during the month of September. A cold front swept south from Canada resulting in widespread frost and record low temperatures for the time of year in the Upper Midwest and northern Great Lakes regions.
(wwwDOT)irishweatheronline.com/news/atmosphere/cold/winter-arrives-early-in-minnesota/37951.html
15 Sep 2011 Snow in Durango? It’s not even fall yet!
“It’s not the earliest snow ever, but it’s not exactly normal, either,” The first snow generally comes in mid-October, Ramey added.
durangoherald(DOT)com/article/20110915/NEWS01/709159934/-1/s/Snow?-Really?-It%E2%80%99s-not-even-fall-yet
Denier!
https://3.bp.blogspot.com/-7BTnRqeqVxo/Usw2ugazZ8I/AAAAAAAA2Vw/Up68eQgj6Aw/s320/mother_nature_denies_global_warming.jpg
“The whole planet was in record breaking heat”
RUBBISH
GISS etc were is record breaking data fraud and fabrication.
The average of the reliable untampered data from the satellites (who’s trend over the US matches the trend in USCRN) shows 2014 in 7th place.
All the MSM hype that you probably base you comment on were just propaganda LIES built on manic data adjustment.
“….overall the 7th warmest winter in the USA.” Records that go back almost 160 years!! Relative to the age of the earth’s climate any conclusions to be made from it would be like making conclusions about the stock market looking at the last few seconds of trading.
Good to see an article with facts. However, to be fair to Drudge, the headline you have captured links to the accuweather site; accuweather is where all the excitement about the weather is going on.
To true believers in “Climate Change” or anthropogenic global warming, ANY deviation from “average” at all is proof of the theory. Cold, hot, wet, dry, too many or too few tornadoes and hurricanes… ANYTHING works.
Yuppers
That is why the ClimAstrologits change from Gore Bull Warbling to ‘Climate Change’ when they realized they couldn’t get their totalitarian world government agreed to in Nopenhagen in 2009.
Now that the ‘PAUSE’ is becoming hard to bury, the sun has gone to sleep, and more and more scientists are saying a return to colder weather is only a few years off, they are really scrambling.
Despite their two faked 97% consensus, in Feb 13 2013, Forbes had an article: Peer-Reviewed Survey Finds Majority Of Scientists Skeptical Of Global Warming Crisis
Worse as scientists retire or reach tenure they are no longer keeping their mouths shut.
Retired NASA scientists have even organized. ONE MORE MISSION: The Right Climate Stuff
Their Conclusions and Recommendations
……………….
The big problem for the Climate Propagandists is change of view is a one way street. When an alarmist (with no vested interest) actually bothers to do some research they switch to being a skeptic. You do not see the switch in the other direction.
This year they said that the fact that Buffalo, NY set a record for it’s latest measurable snowfall was because of climate change. Two years ago when Buffalo had a record lake effect storm in November THAT was also claimed to be because of climate change. Climate change causes every kind of weather imaginable for the believers just as the monster under the bed or in the closet haunts so many children.
I was a QC Engineer/Chemist lab manger and I, like many QC types have no use for ISO. with a reliance on paperwork and not evidence. Hubby just handed me this which I think all here will, appreciate.
A Tale of Two Ships
Next time a Progressive advocates large bureaucracies and Big Government vs capitalism, hand him that! It is why I really want a businessman in charge instead of career politicians or lawyers.
Gail, I’m not certain of what your point is. It’s easy to compare 2 ships one cheaper than the other but it fails to realize they have different missions. The LPD is a much more complex ship than a simple container ship. The container ship is not designed to protect you or go into combat nor is it designed to carry men and equipment to any place on earth. The LPD is. Yes, it is expensive. Sadly, it is also necessary. My last ship was the USS ABRAHAM LINCOLN (CVN72). It cost $4.5 Billion! So, the LPD is a bargain!
The problem is the crappy QC (and design) and I am talking of the ENGINES which have nothing to do with it being a Naval ship.
I am probably a bit more in tune with the crappy QC problem and SNAFUS since my boy friend and several other friends in QC worked for Raytheon. (Not to mention Hubby’s old girl friend.)
These problems have to do with the engine and only the engine.
Gail, I’m sorry, but the Tale of Two Ships is a simplistic comparison using a worst case build first-of-a-kind naval vessel. I recently supervised a new equipment installation on LPD25. I also supervise work on multiple USN and MSC vessels in the San Diego Area, from CVNs to DDGs to the USNS MERCY (a converted oil tanker). There were multiple issues with LPD17, starting with the CAD software being used, US Navy designs, and poor work by Avondale Shipyard then Earl Industries Shipyard (decertified by the Navy in May 2011 for improper work practices and QC) and Hurricane Katrina. In any case, as stated by Hal Howell, a naval vessel is not a commercial tanker. A tanker, even a double-hulled one, is a thin-skinned tin can with none of the survivability of a naval vessel. A commercial vessel (tanker/containership) maneuvers (speed up, slow down, turns) like a drugged elephant. There is no redundancy on a commercial vessel. I could go on and on.
Regards, Paul Lindsey. LCDR USN (ret), Surface Warfare Officer, Naval Nuclear Propulsion subspecialty.
“…. US Navy designs, and poor work by Avondale Shipyard then Earl Industries Shipyard (decertified by the Navy in May 2011 for improper work practices and QC) …..”
And THAT was what I was pointing out CRAPPY QC!
One QC guy I know who worked on airplanes in Texas yanked some five hash bolts out of the bin and had them tested. They were pot metal! I worked in QC on air craft turbine blades and I caught a tech passing ceramic mold material that would poison the metal upon firing and make the blades brittle. The result?
I was fired and blackballed. The FAA was not at all interested until three planes crashed.
I have had this fight many times. Crappy QC costs but the bean counters LOVE Just-in-time and ISO and it isn’t until a million dollar loss results from a refusal to spend $64 dollars a year that they finally listen to reason.
It has been well demonstrated over several years at this site and at WUWT, that _Jim comments are usually an attack on me. (With no back up info.)
HEY _Jim I AM NOT your ex-wife. My ex’s name was Bill not Jim.
https://media2.stickersmalin.com/produit/100/stickers-devil-smile-R1-143760-2.png
(And yah, my comment was about QC and ISO — ANOTHER ‘international standard org.’ )
Paul,
It has been well demonstrated on this site that on some issues Gail is a complete idiot.
73,
_Jim
And Jim’s comment demonstrates that Jim is just a complete idiot, one assumes most of the time.
Gail was talking about QC,
Paul was talking about design.
Do you understand the difference ?
No design is any good if QC is not up to design spec.
A battleship held together with white metal bolts just isn’t going to last very long, now is it.!
Let’s hope that Paul did proper QC when doing his supervision on those ships, hey !! 😉
Gail,
I was a QC engineering manager at a major military contractor and was as disgusted with many ANSI standards as with ISO. For example – the latest ANSI Std for calibration (Z540.3) is unnecessarily stringent and cost prohibitive for most Measuring and Test equipment calibrations. Responsibility for implementing Z540.3 in a dozen cal labs was a major contribution to my early retirement.Too many National standards are influenced by consultants who, like lawyers, create the need for their expertise.
I believe ISO was created to increase US manufacturing costs so that the international community can compete.
I don’t know if it was intentional but these standards have actually reduced the quality of laboratories because its used in a pecking sort of way.
I worked for a vintage in a winery lab in Australia. I understand why analysis of the final product needed to be done properly according to the national standard but much of the work during fermentation did not have to be very precise as the sampling was poor and the changes to concentration by the time the result got to the winemaker were large.
My job was to get a method using a plate reader working sufficiently well for analysing the fermentation so accuracy rather than precision was important. The test for nitrogen was a bugger but I could get OK results which pissed off some of the permanent staff. To get it to work better, I ordered in some 10 mL volumetric flasks that a certain cow insisted needed to be calibrated. My boss told me to humour her so I went through the motions. When I asked for a table of water densities (changes with temp) she told me that they just used 1. Ahhhhhh!
Nice to see some other QC types.
And yes you have to apply common sense to the matter of QC. Juggling, time, money and the need for precision is very necessary for setting up a reasonable QC protocol. Even a quick and dirty ID test can save millions.
One company refused to let the lab sample incoming trichloroethylene use to degrease yarn. Purchasing made a mistake and ordered trichloroethane. Greasy yarn was used to make the rollers that applied toner in copy machines. Zerox went through the roof when they got that batch of brushes. (I got the authority to do the sampling I wanted.)
Did you know that the personal behavior of about 1% of the U. S. population results in their CO2 footprint being 50 TIMES the actual average / person? Not surprising to anyone. But do you realize this means this small group is responsible for more than 33% of ALL (that’s right, ALL) U. S. CO2 emissions? Were this small group to only emit 25 TIMES the average, overall U. S. CO2 emissions would immediately decline 17% and overall planetary CO2 emissions would decline 2.7%. Yet all the plans being unilaterally implemented by the president will allow this group to continue to spew CO2 unabated while financially hammering the lower income and middle classes, just for being alive. Just a different perspective on the AGW scam.
Drudge has this post on the front page now too….
weasel zipppers has it on front page too….
http://www.weaselzippers.us/247255-christmas-eve-1955-was-much-warmer-than-today/
GO TRUMP!
thank you for the information
I was actually wondering about this yesterday. You have answered the question, as usual, with clear, unadulterated FACT.
Can someone please be sure to tell that Moron Bette Midler this warm weather has happened before so she can come out from under her bed!
NO NO! Leave the witch there!
It’s easier than that hippy….it is so common, it has a name
Indian summer
Reblogged this on Canadian Climate Guy.
No watch some numb nut come on here and claim humans are responsible for this warming. Oh, the gall.
Check out the winter of 1968/1969m, mid December. It was 75 F about a week before Christmas. We were driving around in a convertible in our T-shirts and shorts.
Why the different link for the Drudge page?
http://realclimatescience.com/2015/12/christmas-eve-1955-was-much-warmer/
vs
https://stevengoddard.wordpress.com/2015/12/24/christmas-eve-1955-was-much-warmer/
ahh, He’s still using the old site…
Didn’t you hear?
Obama issued an Executive Order to ban snow because it is racist.
I am in Orlando right now. It might be 86 tomorrow or it may not, but in 1974 when I brought my new wife to this city for a vacation and a visit to my family we went swimming on Christmas Day. Recall that the 70s were mostly cold, and that made the Christmas day in the 80s and swimming even more dramatic.
~ Mark
Mark, my family went to Florida every year for vacation in December in the 1960s and we always went swimming in the ocean. Of course living in the finger lake region (NY) and swimming in the lakes during summer made winter in Florida seem really warm. It was the return to snow that was a pain.
CA is having a “whiteout” Christmas. Christmas Eve morning at Kirkwood, wow:
http://www.kirkwood.com/mountain/web-cams.aspx
Drudge does NOT report news. It is an aggregation site. Blame AccuWeather.com where one is directed with a link that you obviously did not click. But then, you just wanted a button click by having “Drudge” in your story. You should have included “Tim Tebow” and you would have gotten even more clicks.
Oh – I just did so you are welcome.
Matt picks the news he links to…it’s not strictly aggregation
He has included a link to this post too…
It’s racist to prove that Obama is a liar…..
SO!?
yup…truth, the new hate speech
Stealing that!
If that’s all it takes, then color me a racist.
Obviously 1955 was warmer because of the nuclear bombs dropped on Japan which triggered global warming. A delayed reaction, no doubt.
I’d love to know where to get that map of temps (the second one shown). For future reference and to link to the source for people who won’t believe it otherwise.
Thanks!
It is the USHCN database. If you are a programmer, you can use this link to generate the data yourself.
https://stevengoddard.wordpress.com/ghcn-code/
Thanks!
People with short histories. I was in high school in Kentucky in 1982- that December was the warmest one in my memory- the month started hot and ended hot. Today and tomorrow here in Oak Ridge, not all that different in climate to where I grew up near Pikeville, Ky- just a bit warmer on average- will not even come close to those records set in 1982.
I hate to be the bearer of bad news, but the song White Christmas wasn’t written in 1954. It was written years earlier, and originally released in 1942. It was the most commonly played song among the soldiers in WW2, reminding them of home. It was written over a decade prior to the movie.
Actually it was “I’ll be home for Christmas” which was the most popular for the soldiers 1944. Bing Crosby did it first in 1943 and after the great advances across France after D-day it was a common hope and actually belief for many that the war in Europe would end before the year was out. The song was written from the perspective of an American soldier in Europe writtiing home and perfectly expressed the desires of most of them.
‘White Christmas’ was a better seller at home and in fact set records for it’s sales, but “I’ll be home for Christmas” was the most popular tune for the American solider in Europe in 1944 by far.
Both are Bing Crosby Classics and I have both on the 1/4″ thick 78s I inherited from my Grandma.
IMO ‘I’ll be home for Christmas’ falls only behind ‘Lili Marlene’, a German song that was very popular with Germans, Americans, and Brits, in the rank of the most iconic song of WW II from the the perspective of the US WW II service man.
When you read the personal accounts of the US service men involved in the war in Europe, those two songs are by far the most mentioned it seems to me.
It was always my understanding climate change/global warming would result in colder winters and warmer drier summers?
Once again, “weather” is not the same as climate. Check average global temps year over year and this story becomes hogwash. Just because it snows in a city or region, or the polar vortex moves down from the polar region and freezes the Great Lakes, has nothing to do with overall global temps. You righties are being taken for a ride your descendants will regret. But you won’t be here so you don’t care. Comical…..
You might have a point if the story didn’t start with an idiot using a weather event to call people idiots for not believing in global warming, or if it was not so obvious that the fiddling of the global average has made it meaningless.
Weather and climate are synonyms….google climate definition and educate yourself….the first three words in the definition of climate are THE WEATHER CONDITIONS!
Infilling Is Massively Corrupting The US Temperature Record
” Infilling of fabricated temperatures is causing the vast majority of reported warming since 1990. The reason I see this and others don’t – is because I use the actual data reported by USHCN exactly as it is reported.” In the data tables it is marked
https://stevengoddard.files.wordpress.com/2014/06/screenhunter_717-jun-30-07-51.gif
“The divergence coincides with the beginning of wide scale station data loss.”
https://stevengoddard.files.wordpress.com/2014/06/unnamed.gif
From another site:
Here is a look at the actual stations used (vs the stations tossed) for Canada. Canada is 3.5 million square miles – or 6.7% of the land area of the earth, and covering latitudes from 45N to 85N. Notice the stations tossed are those in the far north. “..the most obvious ‘hole’ is the lack of stations above latitude 60N. Yukon, Nunavut and Northwest Territories make up 39% of Canada, but between them have only four stations: Dawson and Whitehorse (Y), Eureka and Coral Harbour (NT)…” — Verity Jones
Black triangle are stations in use:
https://diggingintheclay.files.wordpress.com/2010/04/canada-bypopulation.png
https://diggingintheclay.files.wordpress.com/2010/04/canadastations1975.png
Temperature adjustments gets even more interesting.
Zeke Hausefeather did a hatchet job on Steve in his article @ Judith Curry’s Understanding Adjustments to Temperature Data. The Mosh pup is there defending BEST. Zeke and Mosher are defending the TOBS adjustments that Steve (and I) say are bogus.
Zeke Hausfeather states:
So in addition to the TOBS ‘adjustment’ they do another 0.5 C colder adjustment to the older liquid in glass thermometers. However that adjustment is just as bogus, actually more so than the TOBS adjustment.
So that ‘adjustment’ just like the TOBS adjustment is also in the WRONG direction giving up to a 1.5°C warming bias!
And then there is the question of whether or not the BEST data was actually raw data to begin with.
Zeke says, “In the Berkeley approach every attempt is made to use first reports. We avoid the term “raw” data because one can never know that data that purports to be “raw” is in fact “raw.” ~ http://judithcurry.com/2012/07/29/a-new-release-from-berkeley-earth-surface-temperature/
Turns out that statement too is ‘economical’ with the truth.
Ben says over at Jo Nova’s on January 20, 2014 at 8:53 am
He is referring to Frank Lanser’s The Original Temperatures Project
Note that Frank is an UNPAID researcher while Zeke is PAID by Berkley, a University that is so left wing, Mom threw a hissy fit when I suggested that as the school I wished to attend because it was the only school carrying my first choice of major.
I could go on as the regulars here know, but I will leave it at that.
You might have a point if NOAA used DATA and not fairy dust. NOAA is manipulating data to create a specific outcome which is resulting in the taxing of citizens and the waste of $billions.
https://stevengoddard.files.wordpress.com/2014/02/bgqd5wpcmaajkg3.png
“USHCN adjustments are increasing exponentially. They are now nearly 1.5F total. According to USHCN V1 documentation, the adjustments were supposed to level off after 1990 at 0.5F. Instead of leveling off, they have sharply increased and are now almost three times as large as the USHCN V1 adjustments.”
https://stevengoddard.files.wordpress.com/2014/08/screenhunter_1604-aug-03-06-00.gif
https://stevengoddard.files.wordpress.com/2014/10/screenhunter_3332-oct-05-05-19.gif
“There is an almost perfect correlation between the increase in the amount of CO2 in the atmosphere and how much cheating our friends at NCDC are doing with the US temperature record.”
https://stevengoddard.files.wordpress.com/2014/08/screenhunter_1618-aug-03-09-45.gif
“Our algorithm is working as designed” – Recent NCDC press release
Tell that to Bill Nye…..who uses weather as climate all the time.
“Science advocate Bill Nye explained on Tuesday that many parts of the United States were expected to see record temperatures over the Christmas holiday because of weather patterns associated with climate change.
But Nye chastised meteorologists for refusing to utter the words “climate change” to their viewers. “We have a situation where no one in regular television will say the phrase ‘climate change,’” Nye declared, calling out MSNBC meteorologists by name. “Nobody will mention this phrase. But the world’s getting warmer!”
It’s amazing what Bill can do. He also uses his left foot as his brain much of the time.
https://www.youtube.com/watch?v=sm05Mcah0i8&feature=player_detailpage#t=226
http://orig08.deviantart.net/b75c/f/2009/242/9/2/sigh_facepalm_____by_ghost1334652.jpg
I guess that IDIOT Bill Nye never heard of The Serbian astrophysicist Milutin Milankovitch.
From NASA no less!
Those that can do, do.
Those that can’t do teach.
Those that can teach go on TV and make idiots of themselves.
“Those that can teach go on TV and make idiots of themselves.”
I think you mean….
“Those that CAN’T teach go on TV and make idiots of themselves.”
I very much doubt that anyone has ever learnt anything meaningful from Bill Nye !
We’ve learned what a brainless tool looks like in a bow tie.
And FFS Bill, it was a Nobel PEACE prize….
which has NOTHING to do with science…..
and ABSOLUTELY NOTHING to do with peace.
The guy really is a moronic half-wit !!!
Thanks for the correct AndyG (I was waiting for the tea water to boil and needed my Cuppa.)
Unfortunately Bill Nye Does teach his nonsense drivel to innocent children.
Something truly new:
http://www.mlive.com/weather/index.ssf/2015/12/ef-1_tornado_confirmed_michiga.html
As the Jet streams become more meridional (loopy) and the temperature differential between the poles and the equator increases expect more extreme weather.
A warmer world has zonal jets. Thanks to changes in incoming solar UV during solar minimums which changing ozone formation, a change to a cooler world is going to change the position of the jets and therefore change the rain fall patterns.
Here are the Papers that support that conclusion:
They actually did field research in this study on atmospheric circulation shifts
Two papers about rainfall also with the ‘Sun Connection’ and again with actual field studies.
And if you want a really long paper (33 pages) on the UV/Ozone/ climate connection: Recent variability of the solar spectral irradiance and its impact on climate modelling (2013)
Seems the IPCC is screaming ‘the Science is Settled’ and the ClimAstrologists haven’t even bothered to look at the effects of the sun on the climate or done a decent job of modeling them!
No john, it isn’t. The records only go back 65 years. For it to be “truly new”, it would have to be the first in 4,500,000,000 years.
Looking at the historical tornado database from the Storm Prediction Center, this will be Michigan’s first December tornado since records began in 1950.
What kind of Young Earther are you?
Good job
In winter of 1947 when we were living in Washington. DC it was so warm at Christmas I was wearing shorts and the cherry blossoms emerged much earlier – I think it was early January.
Back in a time when their was more sanity in America and the loony communist scare schemes were knocked down by intelligent society in much contrast with today’s drug soaked minds
Happy Federal Holiday!
(Sorry, but I could not resist the stupid that Progressives birth)
i am old enough to remember the winter of 1949-50. We wore our spring coats the entire winter! There weren’t as many cars then, by a long shot, and NO ONE talked about global warming! It was something that happened every so often – cyclical.. Just ask who gets to make money from promoting “global warming” ? THAT is the so-called “science”!
I am old enough to remember the winter of 1949-50, when we wore our spring coats the entire winter. There weren’t as many cars then by a long shot, and no one talked about “global warming”! It’s a cyclical thing in nature. Just ask who makes money by promoting so-called “man-made global warming”. THAT is the “science”!!!
Quit making sense. It upsets Al Gore.
Just one more Liberal sham to gain voters.
They well know that reformulation of jet fuel can air condition the planet, and solve climate change , but it leaves the New World Order out in the cold. When Science becomes the bastard son of Politics. his daughters are prostitutes.
How bad was Islamic terrorism in 1955?
I live in so called sunny and warm Arizona, we been having extreme cold the last few weeks, being from North Dakota/ Minnesota temperatures in the 30s is not extreme cold the temperature would have to have a minus sign on them to be extreme cold to me, but a Arizona native I would guess so, in any case we have been below normal for Arizona most of the month of December! Frost several days in this month and snow on the mountains. One site near the Grand Canyon recorded fourteen below this month. Yes it is weather but most normal humans in the US don’t live on the East coast.
Well, Its Christmas Day down here…..
So its a great Baaa ! Humbug! to all. 🙂
MCaaHNY !!
Many of you should become familiar with ice core data rather than confusing the media presentation regarding climate variability and the economically based positions taken by our elected officials with science. What occurs in our atmosphere when C02 levels increase is not guesswork. Ice core data going back numerous hundreds of thousands of years proves this out. Ice core data is the best source of historic climate variability data we have.
You have no clue what you are talking about Randy.
Randy, unlike you we are familiar with the ice core data, and it agrees with the British courts who ruled that Al Gore lied about ice core data in his propaganda flick. Time to pitch your much watched, and beloved copy of “An Inconvenient Truth”.
Oh, and BTW…
http://joannenova.com.au/globalwarming/graphs/vostok-ice-cores-150000%20med.jpg
Those Vostok graphs are scary.
Look how low CO2 went.. Plant life was lucky to survive. !!
http://jonova.s3.amazonaws.com/graphs/lappi/Gisp-ice-10000-r..png
Yep.. Shows that the current temps are significantly below those of the last 10,000 years.
Note.. you cannot graft on the CORRUPTED HadCrut or GISS data onto this graph. There has been MAYBE about 0.6C real warming since the end of that graph, thankfully.
That puts us still below the MWP, RWP and most of the rest of the Holocene.
Here are the guys art the GRIP face !!!
https://vimeo.com/14366077
That last line is the clincher..
“We started to observe meteorology at the coldest point in the last 10,000 years.”
(hope I got it right)
And THANK GOODNESS for the small amount of warming there has been.
Randy, if you want to learn the truth about the ice core data read:
http://www.greenworldtrust.org.uk/Science/Scientific/CO2-ice-HS.htm
The ice core CO2 data is as fraudulent as the temperature data after NOAA ‘adjusts it’ They now analyze the CO2 in air bubbles where as earlier they crushed the entire sample and analyzed the CO2 in air bubbles AND ICE.
Think of how flat a bottle of pop goes that is left in the closet for a year. Gases (and other chemicals) migrate through plastic, glass, metal AND ICE. The problem is a major headache for analytical chemists and Chem Engineers. Since CO2 loves cold water it ends up in the liquid water within the polar ice crystal lattice. These original studies showed the CO2 trapped in pre-industrial and ancient ice is rather high, and has a very wide concentration range of up to 7400 ppm.
You may not believe this but there once was a time when we would, could, and did, believe everything our Gov. told us.
They practiced something called honesty.
Today they practice obfuscation, coupled with getting elected.
It will be nice to, once again, be able to take the words of Gov. at face value, and I fully expect this will happen with Republicans in charge, at least, that is my hope.
Indeed, It is possible that there may be need for some concern over this climate change thing, but who, and what, these lying Gov. agencies have become, causes this reader to not believe what they are stating, and attribute their motives to a hidden agenda they are pushing.
And that is sad, that one cannot trust their own gov., people who are supposed to work for us, to tell us the truth.
I think you are confusing the general character of the populace with the elites. The elites have always practiced deceit as a norm. Look up the (uniformly suppressed in academia) scholarship of Antony Sutton regarding the stunning duplicity of the investment bankers who were delighted to do big business with both Stalin and Hitler. More recently we have the blatantly censored revelations of former DOJ attorney John Loftus in his book “America’s Nazi Secret” similarly David Talbot’s book “The Devil’s Chessboard” about the Dulles brothers (which covers some but not all of their war crimes) which has either gone unreviewed or selectively contradicted by the major media.
In contrast I am reminded of the first-person account related to me by Manhattan Project scientist Leon Leventhal who related how in the early 40s he left an armful of expensive textbooks sitting in the student union building on the Berkeley campus, returned after a weekend to find them left exactly where he had left them.
Yet even the elites used to have better character. Most of the people who made up the financial world of the WW2 generation really did conduct business in a “conservative” manner and would be horrified to witness what the libertine brats unleashed by the likes of the Clintons and Rubins have done to this country. The Federal Reserve System of that era never had to supervise a “too big to fail” rescue of the people who were supposed to be the “fiduciaries” when that still meant something; now it seems to mean the opportunity to abuse power in as unprecedented a fashion as possible!
Wall Street and The Bolshevik RevolutionPREFACE
Congressman McFadden put the Wall Street/ Bolshevik Revolution into the Congressional record. For this he was ousted from Congress. When he still would not shut-up he had three assassination attempts against him and finally he was killed.
The Climate Change scam treaty has been approved and the first 100 billion dollars is already set to be transferred to third world countries. Within another 5 years, there will be a “reassessment” and the US taxpayer will no doubt be
hit again. We have been sold out, what is solved by continuing to point out the obvious fraud? The press remains filled with stories of Climate Change “Fear Porn” and I fail to see a reason for it. The Obama administration got everything they wanted. Or is it that they want even more?
Freedom has taken a real beating already, and this is only the beginning.
Do they want more?
Yes, They want to up the amount to a trillion a year and they do not want the Prey to realize they are for lunch, revolt and either demand the USA pulls out of the UN and all the various treaties OR repudiates the government/increases the underground economy/ ‘Goes Galt’
Scams only last as long as the Prey is willing to go along. The Elite rules us only with our blind acceptance. Once awakened the people have been known to retaliate.
https://i2.wp.com/s1.hubimg.com/u/6837072_f520.jpg
“A rendition of the Defenestration of Prague. The manure pile is not featured.”
There are already calls to Repudiate the National Debt and do not forget the Iceland example.
Icelandic Anger Bringing Record Debt Relief
Iceland: The broken economy that got out of jail
Iceland: Where Bankers Go to Jail for 74 Years
Reblogged this on YourDaddy's Politics and commented:
El Nino is responsible for a lot of the warmth this year.
http://www.weather.com/forecast/national/news/winter-2015-2016-what-to-expect
We have the same issues here in Aus. Adelaide just had a record breaking 4 days over 40°C in December, and we hear about it often, but that was for a site in the inner city surrounded by buildings. Before 1979, it was in the park lands surrounding the city centre and on the coastal side of the city centre.
There were only three days above 40 but 5 days above 39 in 1897 and 4 days in 1898.
http://www.bom.gov.au/jsp/ncc/cdio/weatherData/av?p_nccObsCode=122&p_display_type=dailyDataFile&p_startYear=1897&p_c=-106024093&p_stn_num=023000
The average of those 5 days was 41.0°C while the average for those four record days recently the average was 42.0°C. This is only 1 degree higher (and for only 4 days) for a site that is is in a hotter environment and is measured with an automated weather station that usually records higher maximum temperatures than previously.
The airport is on the coastal side of the city and a few kilometers closer to the coast. It only had an average for the 4 days of 39.2°C so its quite plausible that if the older measurements were made in similar conditions that an old record of 5 days above 40 from 120 years ago would still stand.
Merry Christmas, all. The Savior was sent. Nuff said. Ps. 2.
Merry Christmas to you too.
This demonstrates uniformity of thinking, however incorrect, of the GWA, or as Dorothy would sing:”Somewhere over the brain row…”
Ha
Seems like it is roughly a thirty year cycle. Would be interested to know how warm it was in mid-1920’s.
I saw some record daily highs were set, but only broke the previous records by 1 to 7 degrees. And as far as I can tell no monthly record highs were set. Washington DC has had mid 70’s temps even in January. I’m in southern Minnesota, with a trace of snow on the ground and the temp at 9 pm was 18. If we had a foot of snow on the ground as we often do, it would 5 above.
Easy on Drudge … He is on our side ….
Merry Christmas to all. And may the New Year bring many more linkages from the Drudge Report. I hope this New Year will bring us a President who doesn’t believe in the global warming scam.
AMEN!
How come you’ve posted two before me? With an AMEN quote? Global warming scam? Make Trump the president and you’ll rue the day as he is just a worn tool that is lost in the pasture!
Trump would be Way Better than hiLIERy, James Clark. Trump has said global warming is a scam. Why do you think in this latest crimenibus bill of $1.6 trillion budget did they extend solar and wind subsidies for 5 years. They did it because the establishment was afraid their pig slop from the Feral government would be cut off by Trump.
I saw you pick up some admirers and fans posting comments on American Thinker Ms. Combs, keep up the great Work and post far and wide. Mr. Heller is doing a good job in alternative media in bringing out the truth. As more people ‘cut the cord’ I hope they will discover what is really going on in our world. Trump/Cruz 2016 to save our country.
Thanks, I am trying to do what I can to get information out. Only by being informed can we defeat the propagandists who would rule us through lies.
Global climate change isn’t man-made, period.
And another big Amen!
Your ur hope is our hope too. What a scam!
Yeah, cause 99% of all climate scientists are wrong and those few scientist who deny climate change are paid by the oil industry, so lets elect a DUMBASS like you for our next president. Im sure that’ll work out just fine for your idiot grandchildren.
Moron alert
One data point does not dispute a trend. Weather is individual data points, climate is the longterm trend. I’m sorry, but while I find this story interesting, it’s not helpful right now when people are so quick to dismiss the mounting evidence of manmade climate change with one story that cherry picks data.
Most Progressive liberal Chicken Little Climate religionists prefer to believe that this christmas breaks all heat records. Most of them were not alive in 1955 so the heat wave that the running dogs of corporate climate change deniers probably just made it up.
Give me skewed statistics like our Govt, don’t bother me with facts….
Manmade Global Warming is a hoax.
They can call this whatever they want as far as I’m concerned. For the last several years I’ve been suffering in the freeze of the northeast, but this year I’m shopping up here in a tee-shirt! If this is Global Warming we shouldn’t be trying to stop it but should rather be finding ways to accelerate it so it’s like this every year! Merry Christmas everyone!
Thanks for what you do all year long Tony.
So now we have reverse Climate Change?
Where did drudge report “record heat”? Nobody would even read your article had drudge not linked to it.
Moron alert
Yes, but the Dregs Report DID link SG’s article.. Get over it 🙂
Sara seems to think all the people who comment here routinely are ghosts or something.
Sara doesn’t seem to THINK , at all !!
The author says:
Last winter, the East Coast had record cold. That was ignored because it was “less than 1% of the Earth.” But this week, the Eastern US defines the global climate.
Linking this year’s eastern U.S. temps over a couple of days to AGW is obviously wrong. However, last winter, it was winter. That’s why a few record-breaking cold temps weren’t such a big deal to those except in the northeast U.S. and parts of Canada. On the other hand, some people who represent the carbon industry did make hay out of last year’s regional record lows:
Feb 25, 2015
Record Cold And Snow Destroy Global Warming Claims
http://www.forbes.com/sites/jamestaylor/2015/02/25/cold-and-snow-destroy-global-warming-claims/
WHAT BULL!!! Shell Oil and BP have been in on the CAGW con from day one. Ged Davis Shell Oil VP was lead IPCC author and WROTE Agenda 21 “Sustainable Development (B1)” found in the February, 1998 ClimateGate (1) email 0889554019 Also SEE IPCC Emissions Scenarios
Shell Oil wants to push natural gas and that is EXACTLY what we see happening.
https://financere.nrel.gov/finance/files/blog/20130226_blog_fig1.gif
” Net U.S. Power Generation Share by Source, 1949-2012″
Also the world wide cold events were NOT REPORTED that is all.
Japan got plastered last winter and the winter before yet not a peep from the US news agencies. See comment above.
Italy captured the world’s one day snow fall record twice this last winter in March TWICE.
240cm (7.84 ft) in Pescocostanzo
256cm (8.34 ft) of snow Capracotta
10 feet (3 meters) of snow fell on Passolanciano, Majella burying the chairlifts (6 Mar 2015 ) and Record snow fell in Abruzzo, Italy, 5 & 6 Mar 2015
Not far away, the Greek islands in the Mediterranean were buried under 6½ ft (2 m) of snow in January.
During Ice age glaciation glaciers form in two main areas, the eastern half of the USA and the western half of Eurasia. (Scotland and Scandinavia) So what happened there?
In Norway they were forced to remove excessive snow from ski slopes – “During the last two days we’ve got more snow than we had in the last two years together,” says Vegar Sårheim. “I had never believed we would experience this.”
Almost 300 “snow patches” remained in the Highland mountains in 2014
(wwwDOT)bbc.com/news/uk-scotland-33581400
Glacier-like hazards found on Ben Nevis in 2014
http://www.bbc.com/news/uk-scotland-highlands-islands-28885119
August 27, 2015 — Massive Increase in Scottish Snow Patches
https://weatheraction.files.wordpress.com/2015/08/wpid-scottish_snow_patches_20150827t140213.jpg
http://stommel.tamu.edu/~baum/paleoveg/veg-adams-big.gif
For the last three winters:
2013
Record cold in Cape Town, South Africa
Rare snow in Atacama desert
Brazil – Snow in over 80 cities – Roads and schools closed
Worst cold spell in 80 years hammers Chile fruit crops
More than 25 000 animals killed in southern Peru
“Extraordinary” cold and large snowfall for southern Brazil
Lao Cai Province [Viet Nam] alone, an unusual snowfall early this week caused an estimated loss of around VND10 billion
Jerusalem hit by worst snowstorm for TWENTY YEARS as eight inches fall across Holy City
Wintry blast to hit New Zealand
July frosts reduce Brazil wheat, coffee
Tibetan nomads in Ladakh call out for help, Thousands of livestock perish
first time snow has fallen in the state of Arkansas during the month of May
Single-day record May snowfalls have likely fallen in Iowa, Minnesota, and Wisconsin.
Blizzard Of 2013 Reaches Top 5 Snowstorms In New England History
Snow in Malta 2013 -. Malta has experienced just four snowfalls since 1895.
Rare June snow blankets northwest China.
2014
Record snowfall (almost 7 ft) in northern Iran
Temperatures up to 40 degrees below normal in the [US] High Plains
Slovenia paralyzed by snow and ice
Southern Austria on highest avalanche alert after heavy snow – A meter of snow in two days – Valleys and roads cut off
Serbia – 1,000 evacuated from cars, buses and trains – Snow drifts 3.5 meters high
Poland – Heavy snowfall and blizzards
Heavy snowfalls and blizzard hammer southern Romania
Tibetan nomads in Ladakh call out for help, Thousands of livestock perish
Brisbane – Vegetable prices expected to soar due to cold snap
Green Bay made it 49 days with subzero temperatures, the most in a winter. The previous record, 48 days, was set in 1976-77. Just before 4 a.m., the temperature was minus 18, breaking the previous record of minus 17 set in 1962. The mercury continued to fall to minus 21 just before 5 a.m., according to the National Weather Service office in Ashwaubenon.
Aemi tropical Tokushima, Japan (34.0° N same as South Carolina) has been hit with major snow storms roofs collapsed, at least 8 dead.
NOVEMBER 2014
Iran – Snow and blizzards began in early November and still continue
Turkey – Heavy snowfall knocks out power for 4 days – and still counting
Russia – Minus 32 degrees and Heavy Snow in Tomsk
One meter of snow in eastern Turkey
Buffalo – 30 major roof collapses, 100 minor collapses (SEVEN FEET of snow in one storm)
Ice on the Mississippi River in Iowa (Nov 20
DECEMBER 2014
Heavy snowfall shuts down six highways in China
Early Winter Storm Hammers Vermont – Power Outages “Unprecedented”
Heavy snow shuts down Trans Canada Highway east of Quebec City
Algeria – Heavy snowfall brings complete paralysis of most educational institutions
Japan – Heavy snowfall kills eight
Kazakhstan – 530 people rescued from snowdrifts since the beginning of winter
Heavy snow knocks out power to 10 municipalities in Bulgaria
Heavy snowfall traps people on the road in Mersin, Turkey
Austria ice storm – So bad that authorities use tanks to move supplies
Heavy snowfall continues in Japan
Six greenhouses collapse under heavy snow in NE China
Waist-deep snow in China – Most severe snowstorm in years
Record snowfall in Juneau, Alaska
Serbia – Ice storm and deep snow – People experiencing mental breakdown after 48 hours without electricity, water and heating
Austria – Rare ice storm hits Waldviertel
100,000 Czech travelers stranded due to freezing arctic weather
Eastern Turkey – Heavy snowfall reduces visibility to 16 feet (5 m)
All these snow events resulted in Northern Hemisphere snow cover last fall highest ever on record.
2015
Canberra’s coldest winter in 15 years
Bogota, Colombia, covered in 24 inches of snow
Record snow in Abruzzo, Italy (elevation 36 ft) for about 24 consecutive hours it snowed persistently recording a total accumulation of 1 meter and a half.
World Record Snowfall in Capracotta, Italy Previous record Silver Lake, Colorado, USA with 75.8 inches
Greek islands in the Mediterranean buried under 6½ ft (2 m) of snow
Heavy snowfall causes road closures in Mexico
A very unusual snowing forced the closure of the Mexico City – Puebla City 150-D highway
Norway – Forced to remove excessive snow from ski slopes – “During the last two days we’ve got more snow than we had in the last two years together,” says Vegar Sårheim. “I had never believed we would experience this.”
Several inches of snow on the ground and expecting 4-8 inches more with high winds. Even more expected in the high country. Warm? Wouldn’t know about it.
Several inches of snow on the ground and expecting 4-8 inches more with high winds. Even more expected in the high country. Warm? Wouldn’t know about it. Merry Christmas to all from snowy Colorado.
Who was around to explain the palm leave core samples gotten from the drilling for oil at Pt. Barrow Alaska.
Those look like combat infantrymen that Bing was singing to. I didn’t know we had battles up in Vermont in 1940.
Moron alert
It is interesting when “it’s not the warmest, but only the second warmest” is somehow a news item.
wasn’t it just last February the same places were setting record lows?
it’s global irritable climate syndrome!!
We must have more tolerance for weather diversity!
Drudge linked this posting about all the cold in the US, Its just Steve Goddard had the Santa on the beach Drudge headline.
“Last winter, the East Coast had record cold.”
That’s a very unscientific statement. Perhaps if you wish to restate this in precise scientific terms.
I have no idea what you mean by the above statement.
http://modernsurvivalblog.com/wp-content/uploads/2014/10/average-temperature-anomaly-at-us-hcn-stations.jpg
http://modernsurvivalblog.com/wp-content/uploads/2014/10/northern-hemisphere-autumn-snow-cover.jpg
http://iceagenow.info/wp-content/uploads/2013/08/RecordEvents-21Aug13.png
http://kratko-news.com/2013/02/20/v-sibiri-poxolodalo-do-71/
http://www.thedailyobserver.ca/2013/02/23/oymyakon-the-coldest-village-on-earth
Also Antarctica has had record sea ice the last few years. Since Antarctica sea ice is much closer to the equator it reflects FIVE TIMES as much solar radiation as does the Arctic.
Utter hog-wash. The highest temp in S. Burlington VT in December of 1954 was 45f. That was on the 28th. The average temp for the month was 29f.
Jason thinks 1954 is 1955. a real genius.
I could say lots of stuff: Here are two items. the US comprises 6 million sq miles, while the entire globe is almost 200 million sq miles. Do you really think that this 3% of the globe is an accurate representation of the entire globe? Do you think that one day (1/3 of 1%) is an accurate representation of the average temperature over the entire globe. This makes as much sense as claiming that being able to balance your checkbook makes you some sort of math genius.
Second point. All you AGW deniers are dumber than trees. Dumber than micro organisms
http://www.dnusbaum.com/AGWdeniers.html
Trans, do not say more, as F.I.M. disease is choking you. This entire post is about how one small part of the 2 percent, on ONE day was FALSELY claimed to be a record.
I think transrp had too much eggnog and got a tad disoriented. I think by now he’s back among the organisms with the same advanced reasoning abilities as his own:
https://coloradowellington.files.wordpress.com/2015/12/bernie-hillary-and-climate-change.png
https://twitter.com/SenSanders/status/681552243653488640
And who could forget these two advanced specimen? 😀
http://www.youtube.com/watch?v=sm05Mcah0i8
Bill Nye: “The main thing is, the Intergovernmental Panel on Climate Change got a Nobel Prize! They got a scientific prize for making a discovery! They didn’t get a minor award. This is a big deal! They discovered climate change, through all kinds of evidence!”
Maddow should repeat one of these séances with Bill Nye and transrp explaining things to their fellow higher organisms. I would watch!
😀 😀 😀
The US doesn’t accurately represent the entire globe, but the arctic does, right tranny?
He took it on the chin. Eggnog, climate terror, total meltdown.
The Terrifying Storm That Will Melt the North Pole This Week – The Atlantic
The depth of ignorance and stupidity is — Well as einstein said, ““Two things are infinite: the universe and human stupidity; and I’m not sure about the universe.”
Clearly not a single person here understands the difference between a data point being part of a pattern, as opposed to an outlier. Yes, it would be nice if there were no outliers cause they really do require some kind of explanation. But contrary to very simple minded people, a single bit of data does not always invalidate a theory. This is especially true if the theory is about large fuzzy systems like environments and climates. Or even relatively simple systems like biological organisms. If a single data point did invalidate a theory , then we would no longer have the germ theory of disease.
But clearly this level of subtlety is way beyond the mental abilities of almost everyone here. See einstein quote above.
One more item. Name calling — the rhetorical technique used when a person doing the name calling has neither the logic nor information to make an intelligent argument so needs to use debate techniques that anyone with a triple digit IQ abandoned by 5th grade.
“
transrp says:
One more item. Name calling — the rhetorical technique used when a person doing the name calling has neither the logic nor information to make an intelligent argument so needs to use debate techniques that anyone with a triple digit IQ abandoned by 5th grade.
———-
Second point. All you AGW deniers are dumber than trees. Dumber than micro organisms.
😀 😀 😀
No go and do a science show with Rachel Maddow and Bill Nye.
I promise I will watch! 😀 😀 😀
Hell, I’ll bring the whole family! It will be a gas!
Now go, transrp. Run, einstein, run.
One more thing, transrp. I totally forgot about your earlier meltdown. I would have thought you wouldn’t want to call anyone’s attention to it. I reckon you think it’s smart to remind everyone. Go figure.
“I could say lots of stuff:”
And all of it would be meaningless GARBAGE !!!
That’s all you have ever produced.
Amazing how all that Alarmist Me-toos can do is spew Ad Homs or at best regurgitate Cartoonist SkS talking points and link to the Connellated Wiki pages.
I am sure most of them could not read a peer- reviewed paper and actually understand it. Instead they just call it ‘Scieny Stuff’ and bloviating. Which is really quite funny given they call us The Anti-Science Climate Denier Caucus or Anti-Science ‘Skeptics’ [who] Are Not Skeptics
As the Wall Street Journal says:
That last Ad. Hom.(Anti-Science ‘Skeptics’ [who] Are Not Skeptics) was by a ‘scientist’, a biologist. That he would stoop to the use of Ad Hom INSTEAD of using science say point blank that he isn’t much of a scientist. He is instead, as his article shows a bought and paid for ‘expert wittness’
Instead of using actual science he uses unjustified analogies.
Real Clear Science? No Mister Pomeroy, I do not think so. Real Clear Psych-Ops would be a better title for that blog article. Many of the commenters also see that article for what it is.
The data for UAH USA compared to the only pristine surface data in the world is an almost EXACT TREND MATCH.
The temperature data extraction methodology of the satellite is ABSOLUTELY VERIFIED.
There has been NO WARMING for 18+ years,
and, as EL Ninos are solar and wind forced, there has been NO CO2 warming in the whole satellite record.
So , yet again, the tranny produces NOTHING but a blustering heap of excrement from one of his brain-washed , moronic bletheren.
Meaningless and empty.. as always.
“Meaningless and empty.. as always.”
I see you are finally trying to know yourself. That is ancient wisdom and you will profit from it if you ever realize that you are doing enormous projection with all the ad homs.
On the off chance that you really want to know what is the truth, try this one from Dr. Ball:
http://drtimball.com/2013/a-basic-and-powerful-analysis-of-greenhouse-effect-fallacies/
Tranny says:
“….Clearly not a single person here understands the difference between a data point being part of a pattern, as opposed to an outlier. Yes, it would be nice if there were no outliers cause they really do require some kind of explanation. But contrary to very simple minded people, a single bit of data does not always invalidate a theory. This is especially true if the theory is about large fuzzy systems like environments and climates…..”
…………………………
And yet the warmists take micro changes of 0.1 or even 0.01 degree C in a yearly global temperature (which is a very unscientific measure of energy to begin with) and blow it all out of proportion. ESPECIALLY when you consider the USA has the best weather station system and 70% of those stations has (error >= 2C)
http://www.surfacestations.org/Figure1_USHCN_Pie.jpg
Now look at the temperature from 1880 to present adjustments and all:
http://earthobservatory.nasa.gov/Features/GISSTemperature/Images/giss_temperature.gif
The error is twice the size of the ‘trend’
The Alarmist are making a mountain out of an imaginary mole hill.
You forgot to tell us about your degree in statistics that qualifies you to interpret this data, and to reject the interpretations of those who actually have such degrees. Or is it just that the data is “obvious”. You know… Like it is obvious that the sun goes around the earth, and the earth does not move
Keep digging, keep digging …
Bring more attention to your meltdowns earlier on this thread. 😀
One more item. Name calling — the rhetorical technique used when a person doing the name calling has neither the logic nor information to make an intelligent argument so needs to use debate techniques that anyone with a triple digit IQ abandoned by 5th grade.
And yet his link was to a site that did nothing but name call. These clowns really are confused, so it only makes sense they would buy into a failed hypothesis.
He is also bring attention to the fact he does not have any understand of error or that NO GRAPH should be presented in a science discussion without error bars.
As an example of the correct presentation WITH ERROR included I like this graph.
http://www.biomind.de/realCO2/bilder/CO2back1826-1960eorevk.jpg
If ClimAstrologists presented the correct error bars including ALL error on their temperature graphs we would see this whole expensive boondoggle for the idiocy that it is.
What an impressive graph. Somewhere, on some part of the planet, despite more cars, more power generation from coal, more wood being burned, you found a place where CO2 dropped from 380 to 320, or more than 15%. And this is evidence of what, exactly, other than gullibility, or the most extreme case of cherry picking I have ever seen.
“Somewhere, on some part of the planet, despite more cars, more power generation from coal, more wood being burned, you found a place where CO2 dropped from 380 to 320, or more than 15%. ”
Or maybe CO2 is more variable than we think. Or maybe CO2 is NOT well mixed. Or maybe CO2 does not have as long an atmospheric half life as we think.
Tranny doesn’t even recognize the graph.
Of course since the alarmist only use cherry picked parts of that graph he wouldn’t.
The circled values are the cherries that were picked.
http://tamaracksheep.com/images/Global%20warming/global%20warming_clip_image001_0001.jpg
Yet, none of the circled points go past 340 ppm, but your graph tops out at very close to 380 ppm. Yet you see no inconsistency.
transrp says: “Yet, none of the circled points go past 340 ppm, but your graph tops out at very close to 380 ppm. Yet you see no inconsistency.”
I think that the reason why it seems that Gail sees no inconsistency, is that you did not read her comment closely, and no, I am guessing that you do NOT recognize the graph.
You are correct. I did not read carefully. I assumed that anybody with a triple digit IQ would know that CO2 over industrialized land masses are not representative of global CO2 concentrations, and should be ignored. How could I have been so foolish.
You do know that there is a reason that the preferred place to measure CO2 is the middle of the pacific, away from concentrations caused by industry and vehicles right?
Tranny’s so busy measuring his IQ he doesn’t see what’s in front of him:
https://coloradowellington.files.wordpress.com/2015/12/mean-co2-in-eu-nam-peru-1800-1955-w-cherry.jpg
ROFLMAO.
Recent actual measurements show that CO2 is pretty well mixed, and the higher concentrations are often away from industrial areas.
https://wattsupwiththat.files.wordpress.com/2015/10/clip_image0021.jpg
Your 2 digit IQ is not standing up too well, is it. 😉
Compared to what. Someone who thought a measurements in the 19th century of PPM over 400 PPM and as high as 550 ppm represented anything close to an accurate measurement of global CO2. Really? But hey, decreasing CO2, even with gigatons of fossil fuel burned fits your paradigm, so go with it. Never mind logic, or measurements. There are invisible pink CO2 eating flying unicorns that can explain the decrease. See, more CO2 means more food more the invisible pink CO2 eating unicorns, so the CO2 levels go down even though more CO2 is produced. Makes sense to … someone
Here are his triple digit buddies! 😀
https://twitter.com/SenSanders/status/681552243653488640
https://coloradowellington.files.wordpress.com/2015/12/bernie-sanders-single-digit-up.jpg
“Never mind logic, or measurements.”
Ah.. the two things you are massively allergic to !!
I very much doubt that Tranny personally knows anyone with a 3 digit IQ !
It has been shown that humans produce about 3% of the atmospheric CO2,
NATURE does the rest.
Even a minor fluctuation in NATURAL CO2 would completely wipe out the human released fraction.
(Please excuse the disjointedness of this. I have a migraine headace coming on and can barely see so it is bits and pieces I have gathered without a decent flow between.)
>>>>>>>>>>>>>>>>>>>>>>>>>>>>
In response to:
“….I assumed that anybody with a triple digit IQ would know that CO2 over industrialized land masses are not representative of global CO2 concentrations, and should be ignored…..”
>>>>>>>>>>>>>>>>>>>>>>>>>>>>
So we look at the Barrow ALASKA data for 1947-1948 data gathered by Beck from the historical record and the average is 420 ppm! (average of 330 samples)
In more recent data you see more than 80 ppm variation in Harvard forest. From 320 ppm to around 420 ppm with a set of outliers to 500 ppm.
The only reason “official source” data does not have that type of variation is because it is not RAW DATA. And I quote:
If any data that is not within 2 standard deviations is rejected then of course you will never see swing of 80 ppm, because it has already been edited out of the final “product”
Beck’s data indicates that the “background” level of CO2 does not exist anywhere:
i.e. the “background” level is mythical. Indeed, this mythical nature of the “background” level is why Keeling searched for a place where he may be able to discern this “background” level and chose a volcano actively dumping CO2 in the air by an ocean full of plankton buzy sucking it down not to mention the winds traveling between the two. Pick a number any number and I can find it for you….. especialy when I use an IR spectrophotometer that was never validated. (AND believe me I tore my hair out trying to validate that blasted machine for use as an analytical instrument – no such luck.)
……………………
Dr Glassman says
The well mixed and Mankind is responsible canard is based on a very long CO2 residence time in the atmosphere. That has been found to be invalid as Dr Glassman mentions.
On top of that the annual flow of carbon into the atmosphere from the burning of fossil fuels is less than 0.02% of the carbon flowing around the carbon cycle. (NASA provides an estimate that the carbon in the ground as fossil fuels is 5,000 GtC and humans are transferring it to the carbon cycle at a rate of ~7 GtC per year.)
Is it not obvious that so small an addition to the carbon cycle is Absolutely certain to disrupt the system because no other activity in nature is so constant that it only varies by less than +/- 0.02% per year? /sarc
When I was a climatology student, CO2 residency was known to be @ 7 years. The IPCC and their alarmist idiots have done their best to bastardize real settled science…
https://wattsupwiththat.files.wordpress.com/2013/12/co2_residence_times.png
If this isn’t fraud, I don’t know what is.
I get to touch on a couple of things here: By the way, I should say that I am grateful. There are actually some ideas and data put forth here that are not obviously wrong, and I am digesting them to get a full and clear understanding of the depth and breadth of their wrongness so I can respond. But this one is easy.
First a note on the accusation that I complain about name calling and then refer visitors here to my article which someone claims is nothing but name calling. My article is not about name calling, and let me explain, though few here will understand. If I were to accuse someone here of being an ignorant foolish psychopathic pedophile, then that would be name calling since I have said that X is (names) and given no standards of how one measures those names, or supporting evidence.
In my article http://www.dnusbaum.com/AGWdeniers.html. I give a definition of various words like intelligence and stupid. These standards include metrics that are easily verified. I then give references about how, by these standards, animals are aware of global warming and are acting accordingly in order to improve their chances of survival. Of course, almost all the plants and animals on the planet may be wrong. However, it is seldom a good idea to bet against the observed behavior of the entire ecology of the planet. But that is what stupid people do.
Now about this article. I have no idea when gator69 was a climatology student, or if he passed the course. But one error is obvious in his graph. Quite often scientists get more accurate measurement, and learn new stuff. Comparing recent measurements (2007) with other measurements, almost all of which are at least 25 years old, and then simply stating that the most recent measurement is wrong without offering any evidence or reasons for why the most recent measurement is wrong is simply poor science.
CO2 does not just go away. It takes a lot of energy to break up a CO2 molecule. In fact, the heat of formation of CO2 is 40% greater than that of water. So, without some sort of energetic reaction, CO2 is going nowhere. Here is a more detailed explanation of why Gator69 is totally wrong. https://www.skepticalscience.com/co2-residence-time.htm. I would like to add, that just because someone does not understand an argument, does not mean that the person or people putitng forth the argument are stupid, or dishonest. It may just mean that the person not understanding the argument is not nearly as smart as they think that they are, and/or are suffering from dunning Kruger syndrome.
Now, some have argued that humans only contribute about 10% so that they can not possibly be causing any problem. Yea… Consider this statement. John consumes 2000 calories a day, and weighs 180 lbs. He has changed his diet, because he discovered Ben and Jerries /death By chocolate ice cream, and is not eating 2200 calories. Heck, lets be generous and say that he is eating 2150 calories. He still has the same amount of physical activity. Are you going to actually claim that at the end of a year, having consumed an extra 54000 calories that John has not going to have gained any weight? That at the end of 10 years, with that extra intake are you going to claim that John will not be seriously obese?
Well you say, maybe he started being more active and thus consuming more calories. Great. What, exactly, is the analogy for Earth and CO2? Is the earth getting 10% more plants every year? 10% more algae or 10% more trees>? Where are they?
You are like people, who for hundreds of generations, since there were cities, believed that you could dump shit in the street, or the nearby stream, and that because when you lived in a village, that was not a problem, then it is still not a problem when you live in a community in excess of 100,000. And we know how that works out don’t we? And because most people are (made by evolution to be) stupid, you keep repeating the same errors on ever grander scales.
And if that CO2 is not significant, then why is the ocean becoming more acidic? Oh wait. That is just another set of lies. The entire world is made up of stupid liars. Only you, and a few fossil fuel companies (Not even most any more — most fossil fuel companies, having a time frame of more than next year, are realizing that if they want to stay profitable over a time span of a decade, and, perhaps, leave their children a habitable planet, need to deal with global warming — Not climate change, a term fabricated by AGW deniers and republicans, but global warming) Yes, Fossil fuel executives are greedy lying psychopaths, but when the evidence becomes overwhelming and they can see that their AC mansions will not be nough to insulate them from the consequences of a planet wide failure, that they must change.
http://news.yahoo.com/ten-big-energy-firms-vow-fight-climate-change-004820526.html
Have you noticed than when any scientist or company or person changes sides in this debate they are moving away from your side? Probably because of the international Jewish Banking conspiracy.
gator,
I have yet to find ONE part of the Global Warming crap that is not out right fraud. The Progressive Elite have corrupted just about every branch of science. Honesty and the scientific method are dead and we all will suffer as a result.
Scientific fraud and the power structure of science
The paper then goes into the accepted practice of Fraud.
This paper deals with concrete examples where the FDA looks the other way on fraudulent medical papers.
Research Misconduct Identified by the US Food and Drug Administration: Out of Sight, Out of Mind,
Wow, trancer has really been on the “whatever he takes” this time.
That would have to be one of the most incoherent loads of unscientific garbage even he has ever produced.
He provides us with a new definition of STUPID, based solely on his ramblings.
That first link from the trancer, appears to have been written by a scientifically illiterate low-IQ 15 year old. Seriously , what a meaningless load of incoherent nonsense.
Transrp says:
—–
—–
—–
Accusation? Heh. Who’s accusing you? You make it easy. Just quoting your own words. 😀
Wiggle, little wormy, wiggle. And write us another treatise on name calling. 😀
You are not really good at this, are you?
Actually tranny, when one finds that a single measurement is well outside of all other measurements, it is considered a red herring and discarded. But zealots will discard the majority to find a singular red herring measurement or explanation to fit their narrative, Zealots will also refer to a cartoonist’s blogs, and their own rantings of proof of whatever they want to support. Do me one little favor tranny…
1- List all climate forcings, order them from most to least effectual, and then quantify them all.
2- Please provide even one peer reviewed paper that refutes natural variability as the cause of recent, or any, global climate changes.
There is nothing unusual or unprecedented about our climate, or how we got here. For 4,500,000,000 years climates have always changed, naturally. This means there has been a set precedent, and the burden of proof falls on natural climate change deniers like yourself.
Gator, I assume that our resident transrational prophet is now searching his own writings and assorted cartoonist literature for the correct answers. I’m sure that having heard of Dunning–Kruger he will be very careful to match the complexity of the materials to his own cognitive ability.
It is amusing to note that some folks think that redefining terms actually alters physics. PsyopsicalScience sure does reel them in…
https://scout-story-images.s3-us-west-2.amazonaws.com/wired2fish/2014/07/square-bill-crankbait-bass.jpg
ASQ certified Quality Engineer for over thirty years.
Andy, This is really over the top!!! He really must think we are brain dead.
“….CO2 does not just go away. It takes a lot of energy to break up a CO2 molecule. In fact, the heat of formation of CO2 is 40% greater than that of water. So, without some sort of energetic reaction, CO2 is going nowhere….”
WTF??? Is this guy that uneducated???
CO2 + H2O + photons –> CH2O + O2
( photo wavelength between 300 nm and 700 nm)
PHOTOSYNTHESIS
CO2 + rain water (H2O) ====> Carbonic acid
H2O+CO2 ===>H2CO3
This VERY VERY common reaction is why rain water is acidic. It is why distilled water is acidic and it is why a lot of the USA, Europe China, South America, Africa… is hollow. (Has limestone and marble caves)
https://www.youtube.com/watch?v=sjxUwDTkd4g
Doesn’t this guy understand that his body is composed of CO2 + H2O(water) + a bit of N2 (nitrogen) and a sprinkling of minerals CA, Na, K (and even chlorine and arsenic)???
What the heck type of crap are they teaching these days?
“CO2 + H2O + photons –> CH2O + O2
( photo wavelength between 300 nm and 700 nm)
PHOTOSYNTHESIS”
Yep, and the land biosphere is increasing quite significantly. Using that CO2 for LIFE.
One can only imagine what the ocean biosphere is thinking about actually having some small amount of available CO2 for a change !!
“WTF??? Is this guy that uneducated???”
Every post he makes certainly proves that, yes, he REALLY IS that UNEDUCATED.
And they call us ‘science deniers’ Projecting*** much?
***Psychological projection, also known as blame shifting, is a theory in psychology in which humans defend themselves against their own unpleasant impulses by denying their existence while attributing them to others.
https://disqus.com/by/dougnusbaum/
Meet the trancer… a certifiable nutter !!
Hey Andy. Specifically, for which of my statements can you provide information to show that it is wrong?
You don’t make any rational statements. Just aimless ranting.
Biosphere has expanded measurably over the last few decades as the level of available atmospheric CO2 increases.
http://wattsupwiththat.com/2014/09/17/another-benefit-of-climate-change-and-increased-co2-trees-continue-to-grow-at-a-faster-rate/
Yes … Forrests in some places are growing faster. Like where there is sufficient water. But if you have droughts, or droughts followed by floods which wash away the soil, you get this:
http://www.salon.com/2015/08/17/california_droughts_dangerous_toll_millions_of_dying_trees_are_putting_human_lives_at_risk/
the question is, what is the situation globally? Which you did not address. Turns out that globally they are doing better. (You were to lazy to bother to look —- right??) But then you have to look to the future.
http://phys.org/news/2015-12-amazon-rainforests-transition-savannah-like-states.html#nRlv
It is so nice that you just assume that you can change the entire global eco system at one of the fastest rates ever and expect that everything will be OK. You may be right, but that is not where most of the money is being bet.
#1. MORE CO2 not only makes C3 plants more drought resistant it also make C4 plants more drought resistant.
Effects of Elevated CO2 and Water Stress on a C4 Grass
I am sure that the trees in Ca, and the farmers dealing with drought in the SW US and other parts of the world will be happy to know this.
#2. According to CAGW conjecture. more CO2 ==> temp rise ===> more evaporation and more water vapor in the air. Since water will eventually come out of the air you get rain (or as the Alarmst are now trying to tell us more snow) therefore less drought.
We can look in the past and see the results of an increase in temperature.
From the Peer-reviewed paper Temperature and precipitation history of the Arctic (2010)
Here is Africa at Wisconsin Glacial Maximum
http://www.esd.ornl.gov/projects/qen/afr(22-.gif
Over half of the Africa is desert.
Africa at present
http://www.esd.ornl.gov/projects/qen/afr(pre.gif
About 1/3 is desert.
Africa 9,000 14C y.a. (about 10,000 ‘real’ years ago) when the Arctic was about ” 1-3°C above 20th century averages”
http://www.esd.ornl.gov/projects/qen/afr(9ky.gif
Hardly any extreme desert at all and just a small band of semi-desert.
Excellent bit of information Gail. To the extent that it may be problematic it is because models, and I am aware that they are only models, predict that increased precipitation will tend to follow a pattern of places that now get some will get more, and those that tend to get less, will get even less.
Frankly, I am not convinced, though so far that seems to be the case. Viz, our east coast is getting a lot more rain, and the southwest and west are getting less. I also question your maps since I do not notice any but the smallest changes in coastlines and given the changes in sea levels, one would expect to see more. As you can see: http://www.globalwarmingart.com/wiki/Special:SeaLevel Those changes in Sea level should have taken out part of Sinai, or at least removed the need for a canal.
Also, even if you are correct, and that more land becomes wetter, there is the fact that a large percentage of the worlds population lives near the sea, some in major cities. There will be large population movements. rivers will flood (See what is happening to the Mississippi this year) Here is an article from one of those lying conspiracy magazines. http://www.scientificamerican.com/article/deadly-heat-waves-flooding-rains-crop-failures-among-climate-change-plagues-already-afflicting-americans/. In any case, crops are now grown where they are “best fit”. That will change. And unlike in previous times when the changes took place over millennia, these changes will happen over generations.
A mess, no matter how you look at it. Pretending that it is not going to happen, is probably not the best course of action.
“Turns out that globally they are doing better. ”
Yes they are.
And a future “could” based on meaningless climate projections from models which have been shown to be a total farce… seriously.
Methinks you have been living on a mix of climate kool-aide and eggnog for most of the last few years, and it has certainly had an adverse effect on your already stunted rational thinking abilities.
If CO2 does not just “go away” (to use Doug’s moronic science speak) he needs to explain this
http://aps.group.shef.ac.uk/apsrtp/aps-rtp-2008/taylor-lyla/webphanerozoic.jpg
and this….
http://profilerehab.com/facebook_covers/scenic/white_cliffs_of_dover_cover_1.jpg
Actually Andy — I do not need to explain “this”. Anyone with a triple digit IQ would understant that I am referring to time frames in the hundreds or thousands of years. Over millions of years anything is possible. If you were to live that long, you might even grow a brain
“If you were to live that long, you might even grow a brain”
You.. no chance. !!
You obviously have ZERO comprehension of anything to do with the carbon cycle.
Keep up your wilful ignorance, and your attempts to show you have something more than a single figure IQ…. its funny. 🙂
Andy,
Do you know why transrp keeps bringing up his intelligence? Is this triple digit IQ thing a sore point for him or a matter of pride?
For him, triple figure IQ is an insurmountable goal.
You should have said aspirational, Andy. It’s more positive and uplifting. He’s trying.
Seriously, its like trying to talk to a mid-low IQ pre-pubescent teenager.
He shows the monumental ignorance backed by a baseless ego so common in children ofthat age.
OH, and this is another very funny quote from our Learned Task Master:
“Now consider Global warming. A search of the internet will quickly demonstrate that the vast majority of species on the planet are moving to the poles, or are moving, if they can, to higher elevations.”
GEE, I moved SOUTH to mid North Carolina from New England and we actually saw a Snow Owl last year.
Snowy Owl Range
http://www.defenders.org/sites/default/files/snowy-owl-range-map.jpg
And then there was the Siberian Swans that showed up in the UK the earliest ever recorded:
The arrival of winter, traditionally heralded by the migration of Siberian swans, has come early as 300 birds flock to Britain
Of course since biologists are PAID to find evidence of species moving north they do…
The past decade had the snowiest winters (December-February) on record.
https://stevengoddard.files.wordpress.com/2010/09/2000_decade_snow.png
September Snow Cover Was Highest On Record In North America in 2014
https://stevengoddard.files.wordpress.com/2014/10/screenhunter_3455-oct-08-22-43.jpg
The Great Lakes obliterated all records for springtime ice last year, and this year.
On March 1, 2014 the Great Lakes were approaching 100% Ice Cover – For The First Time On Record, only Lake Ontario was the only major holdout
https://stevengoddard.files.wordpress.com/2014/03/lice-00-1.gif
March 3, 2015: Great Lakes ice cover over 88%, more than last year
The number of snowpatches remaining in late summer in scotland has gone through the roof.
https://weatheraction.files.wordpress.com/2015/08/wpid-scottish_snow_patches_20150827t140213.jpg
But that is OK the Alarmist will continue to shout “Warmist Year EVAH!
http://ia.media-imdb.com/images/M/MV5BMTcwMjMwNTA3MV5BMl5BanBnXkFtZTcwMjk4OTgyMQ@@._V1_SY317_CR0,0,214,317_AL_.jpg
All of these instances can be explained as being caused by global warming, or as being freakish outliers. I will take the simplest, easiest to explain, and the one that needs no research. Even then, I expect that most of you will not get it.
The situation is GLOBAL warming. The globe includes that 66?% of the surface that is ocean. When the ocean warms, more moisture goes into the atmosphere. It does not stay there. No, that moisture comes back down. In the winter it comes down as snow. That is right. Even if the average temperature in winter goes up by a couple of degrees F over the course of 100 years (see this picture — http://cdn.phys.org/newman/csz/news/800/2015/30yearsofabo.png) and http://www.climatecentral.org/news/winters-are-warming-all-across-the-us-15590 what comes down will be snow, that simply means that average temperatures in a place like Wisconsin will be — and I am just guessing — 27 degrees, rather than 25 degrees. At 27 degrees it still snows in the winter. It does not rain. Hence more snow in the winter is evidence of global warming.
And I am sure that none of you will understand this. This probably also explains the great lakes freezing. And I am just guessing here… See — Ice and snow are big carriers of what can be called negative heat. All that snow cools the lakes enough so that even though the ambient air temp is a bit warmer, since that temp is still below freezing, less heat has to leave the water for it to freeze. Here is a fun experiment you can do. Take two glasses of water. at room temp. But an ice cube in one of them. Let it melt. Put both into the freezer. Guess which one will freeze over first.
NO the USA is not warming.. USCRN says its NOT warming.
UAH says its NOT WARMING.
http://s19.postimg.org/bbw6r5lwz/USA48_land.jpg
You either have INCORRECT information or are DELIBERATELY LYING.
There is NOTHING happening with the world’s climate that is outside the boundaries of NATURAL VARIABILITY.
And you still are totally unable to produce one single paper that shows that there is.
Get off the meds and let your brain settle down to some sort of rational thought, Doug.
You are making a rancid fool of yourself.
Straw man argument. I did not say anything about temp trends in the US other than, even if it gets warmer, that it will still be cold enough to snow in the winter in the north.
No single scientist has ever claimed that global climate is outside the boundaries of natural variability. That is a stupid argument to make, and is one made by stupid people. Katrina, was not outside of Natural Variability. By your logic, costal cities should not prepare extreme weather that will probably become more common,. In fact, such storms are already more common across the globe.
As for your graph. Again, probably something that you made up, or got from WUWT. They love to make up things. Try this instead: http://www.climatecentral.org/wgts/heat-is-on/HeatIsOnReport.pdf, and this: http://www.climatecentral.org/news/the-heat-is-on
As to your “pause”. Have fun with his picture: https://www.climate.gov/sites/default/files/styles/inline_all/public/GlobalTemps_WarmestYears_2015_610.png?itok=muVpIYHV
and this: http://www.cnbc.com/2015/12/28/feeling-a-little-warm-this-year-2015-will-set-a-record.html
So, you agree that all the recent weather is within natural variability.
Thank you. !
If you had the ability , you could do that graph yourself.
But that is your problem.. you DON’T have the ability.
You have to rely totally on the paid propaganda monkeys because you don’t have the capability to actually check anything against real data.
As for your first graph.. roflmao.
No continuity from year to year.. the LIEs and FABRICATION writ large for all to see.
And really “climate central” the paid propaganda site for the AGW scam.. and CNBC far left warm-mongers.
Real unadjusted, unfabricated data shows that 2015 WAS NOT the warmest in any way.
Its only the massively adjusted and fabricated (nearly 50% is now “estimated”) of the NCDC/NOAA farce that 2015 is any warmer. Its a LIE.. but its all you have.
Its only the massively adjusted and fabricated (nearly 50% is now “estimated”) of the NCDC/NOAA farce that 2015 is any warmer. Its a LIE.. but its all you have.
Yep… And now we get to the core of your argument. It is that 90+% of climatologists, almost all businesses, insurance companies, the pope, Mos of the smartest and richest people in the world, at least 20% of the petroleum companies, the defense dept, and almost everyone associated with them are not simply wrong. No, they are part of a vast global conspiracy and are dishonest.
Have you ever thought that you need to keep those thoughts to yourself, or else “THEY” are going to come and take you away and lock you in a padded room?
No single scientist has ever claimed that global climate is outside the boundaries of natural variability.
====
maybe not singly…but they have collectively
NOAA says that climate models can not predict the current changes…without factoring in made man CO2 forcing.
“It is very unlikely that the 20th-century warming can be
explained by natural causes”
“The human influence on climate very likely dominates over all other
causes of change in global average surface temperature during
the past half century. “
And of course USCRN (you know, pristine data) and ClimDiv…
Both show essentially ZERO USA WARMING
http://s19.postimg.org/vje7x78s3/USCRN.jpg
http://s19.postimg.org/fzbfkeo1f/Clim_Div.jpg
But don’t let REAL DATA kick you up the arse end on the way out, you mathematically illiterate putz.
Oh goody. More unsourced hand made images. Used to support whatever you want to say. And we all believe because you are the one true source of all knowledge.
Oh dear , poor Doug is on another medically induced rant.
REAL DATA stings you, doesn’t it Doug. 😉
Anyone can check that a large percentage of the NOAA/NCDC data is fabricated.
Even you could do it if you had got past junior high school.
Again.. If you had even a basic intelligence, you could verify my graphs.
But you DON’T, do you.. and that hurts your baseless ego so very much.
transrp says: cojoining climate change and man caused climate change…
…I know, it’s tricky like that
https://stevengoddard.files.wordpress.com/2014/06/screenhunter_236-jun-01-15-54.gif
https://stevengoddard.wordpress.com/2014/06/01/more-than-40-of-ushcn-station-data-is-fabricated/
transrp says:
January 2, 2016 at 12:34 am
Oh goody. More unsourced hand made images.
====
psst….hint: put USCRN in google images
Poor Doug.
His lack of research or any mathematical ability is catching up with him.
Doug.. Go and find the USCRN and ClimDiv data since 2005.
Download it, graph it and put a linear trend line on the graph.
Its very basic junior high stuff. Can you at least TRY !!!!!
When I see something that supports my position, I copy and paste. If what you had was real, you would do the same. I am mnot wasting any more of my time chasing your fakes.
ROFLMAO..
You have just made a MONUMENTAL GOOSE of yourself.
You have shown that you are only interesting in propaganda LIES that suit your brain-washing.
You have shown that you lack neither the inclination, intelligence , or capability to do any thinking or research of your own.
You are a JOKE !!!
Here’s a couple more USCRN graphs, just for Doug.
Not quite as up to date as mine is, though. 😉
You really should at least TRY, Doug.
https://wattsupwiththat.files.wordpress.com/2015/06/uscrn-trend-plot-from-ncdc-data.png
http://4.bp.blogspot.com/-BbobxTbASe0/VX3p6hIZFvI/AAAAAAAAJss/Mc8soISyOJM/s1600/USCRN.png
http://i.kinja-img.com/gawker-media/image/upload/ju5ljek5ygqbrxvi5g3z.png
I really like the last graph that you created. The addition of a kind of watermark is a nice touch. What program did you use?
transrp says:
January 2, 2016 at 12:44 am When I see something that supports my position, I copy and paste. If what you had was real, you would do the same. I am mnot wasting any more of my time chasing your fakes.
===
putting USCRN in goggle images is above your pay scale huh
Oh boy.. you really have been on the turps , haven’t you, trancer
You seem to be TOTALLY INCAPABLE of even the simplest image search.
So hilariously FUNNY to watch you slipping an sliming your way out of your position of total ignorance.
“and the one that needs no research. ”
Yes, it is VERY OBVIOUS that you have done NO research.
You are monumentally wrong… ALWAYS. !
Now explain why summers in the USA have been getting COOLER. !!
http://s19.postimg.org/3yle5xr8z/UAHUSA48_JJA.jpg
WHOOPS.. Wrong columns.. that’s for Australian winter..
Better fix things.. and show the WINTER COOLING in the USA..
Again.. the REAL DATA is contrary to Doug’s ravings.
Winters are COOLING in the contiguous USA.
http://s19.postimg.org/bslzrbz1v/UAHUSA48_DJF.jpg
Thats an easy one. You probably turned the graph upside down:
http://assets.climatecentral.org/images/made/2-13-13-WarmingWinters-SummaryGraphic_500_337_s_c1_c_c.jpg
I could not find the source of your graph. Maybe you just made it up. I tried various combinations of USA48 DJF average UAH. No luck. well unless you think that WUWT to be a reliable site. But like you they kind of make things up, lie, etc.
Again … what is the source of your graph? And why is it better than mine?
transrp….your chart is from Climate Central
Here, here’s NOAA
http://www.worldclimatereport.com/wp-images/winter_solar_fig1.JPG
Looks like there is no warming trend for the US if you look at century time scales. But there is a small warming trend on a last 45 years scale. But a cooling trend when looking at the last 15 or 20 years.
I find it difficult to be concerned about a trend that is so weak that you can get sign changes by just shifting your data window a decade or two.
…and there’s the elephant in the room
Global warming is supposed to increase winter temps in higher latitudes.
The U.S. is higher latitude…and there’s the winter temp trend
“I tried various combinations of USA48 DJF average UAH. No luck”
Again, Doug admits his incompetence. But do keep trying, Doug.
Eventually, in about 10-15 years, you may get there. !!
But do keep trying, Doug.
Eventually, in about 10-15 years, you may get there. !!
Not likely. that is, I am not likely to find a actual source from an actual sciency place. Your image comes from a place were anybody can post anything. In other words, you make crap. Put the crap on this self posting site, then say — hey, look — CRAP!!!
Poor Doug, it is not up to me to teach you basic data analysis.
That is something you should have learnt in high school.
A bit late for you now though, senile dementia setting in and all.
Poor Doug. still unable to verify anything himself.
Must suck for him to be sooooooo mathematically illiterate.
“I am not likely to find a actual source from an actual sciency place.”
Poor Doug.. you could at least try to find the REAL DATA and analyse it yourself.
Oh wait.. YOU CAN’T, can you.
Incompetent, by your own admission.
The December update for USCRN and ClimDiv is due on 7th January.
I’ll update my graphs and trends then.
( just for you Doug…… because I know you can’t manage it yourself.) 😉
@ Jason.
Since the end of the 2000, USA48 Winter trend is basically dead flat (as shown)
Spring and Summer are very slightly positive, Autumn is basically flat.
Overall, its basically dead flat in USCRN (since 2005) and UAH48, and very slightly negative in RSS USA and ClimDiv (since 2005).
Again, anyone can get access to the data for all four sets, and with a bit of simple analysis can verify these statements.
And Trancer Doug,
… if you want to verify my results, you will need to go and find an average intelligence junior high school student to help you.
transrp….you do realize that global warming is on the bottom of everyone’s “don’t give a shit” list…..
That and the lost North Pole ice that global warming just completely melted in North Pole, AK is what causes his pain and suffering.
AND while scientists lie, or at least get the results they are paid to get — SEE: PEER REVIEWED PAPER: Scientific fraud and the power structure of science
ICE AND SNOW does not lie and snow is increasing in the NH and sea ice in the SH, yet we are not much past the solar cycle 24 Maximum
Arctic sea ice has not increase because of a positive NAO/gulf stream but soon will when the AMO flips to negative. (2009 was the last solar minimum and if you bother to look you can see it on the following NH snow charts. Cycle 23 was not a strong cycle.)
Northern Hemisphere SNOW from NOAA
October (2015)
http://www.ncdc.noaa.gov/sotc/service/global/snowcover-nhland/201510.gif
November (2015)
http://www.ncdc.noaa.gov/sotc/service/global/snowcover-nhland/201511.gif
December (2014)
http://www.ncdc.noaa.gov/sotc/service/global/snowcover-nhland/201412.gif
January(2014)
http://www.ncdc.noaa.gov/sotc/service/global/snowcover-nhland/201401.gif
February (2014)
http://www.ncdc.noaa.gov/sotc/service/global/snowcover-nhland/201402.gif
I explained how GW will lead to an increase in snow cover. I stated that you would not understand it. I made a prediction. You confirmed my prediction.
be careful with predictions….especially about snow
“Children just aren’t going to know what snow is,” Dr. David Viner
“you can argue that may be our projection of [an ice-free Arctic by 2013] is already too conservative.” Wieslaw Maslowsk
Trans, you explained nothing. You made a child’s theory, more heat equals more rain, equals more snow in areas that are well below 32 f anyway.
However that is not what OBSERVATIONS show. They show a greater percentage of NH land snow covered. Understand this child’s observational fact. That means that southern latitudes, where W/V usually falls as rain, has been falling as snow. Kapesh?
In truth there was not more percepitation, it was just colder. The precipitation records prove this. Also see the great Lakes ice cover for instance. This is not the result of anything but cold, and certainly not the result of warming.
Global precipitation is not increasing, and if it was increasing due to greater warmth, then the percentage of land under snow would decrease. Instead it is, contrary to CAGW alarmist predictions, increasing.
Never had any theory made so many predictions, and gotten so much wrong. No increase in extreme storms, floods, droughts, hurricanes (see global hurricane basin ACE numbers) sea level rise, global sea ice trends are dead flat, and all KNOWN stand proven benefits of CO2 are manifesting in global observations; crop yields, greening of aird expanses, accelerated tree growth etc, etc.
CAGW, as a scientific theory is dead, as a politically expedient means of power centralisation, it is, unfortunately still alive.
What you refuse to understand is how glaciation starts.
FIRST – low solar insolation at 60 degrees North in June
The PEER Reviewed paper, Can we predict the duration of an interglacial? gives the calculated solar insolation values @ 65N on June 22 for several glacial inceptions:
Current value – insolation = 479W m?2 (from that paper)
MIS 7e – insolation = 463 W m?2,
MIS 11c – insolation = 466 W m?2,
MIS 13a – insolation = 500 W m?2,
MIS 15a – insolation = 480 W m?2,
MIS 17 – insolation = 477 W m?2
(Changes near the north polar area, about 65 degrees North, are considered important due to the great amount of land.)
So the present solar insolation is in the correct ballpark for glacial inception.
>>>>>>>>>>>>>>>>>>>>>>>>>>>>>>>>
SECOND – Where does glaciation start?
Glaciation starts in Hudson Bay
August 13, 2015: 2nd highest ice coverage for Hudson Bay since 1971 at mid-August – only 1992 higher
The sea ice on 25 July 2015. (Note the location of the Great Lakes and think of the record ice the last couple of winters and the 6F below normal summer water temperature.)
https://polarbearscience.files.wordpress.com/2015/07/hudson-bay-breakup-july-25-2015_cis.gif
The Great Lakes obliterated all records for springtime ice last year, and this year.
On March 1, 2014 the Great Lakes were approaching 100% Ice Cover – For The First Time On Record, only Lake Ontario was the only major holdout
https://stevengoddard.files.wordpress.com/2014/03/lice-00-1.gif
What is the shape of the weather patterns of glaciation?
Meridional or ‘loopy’ jets
https://stevengoddard.files.wordpress.com/2014/01/screenhunter_257-jan-22-17-17.gif
Finally what do the experts in the field of Paleoclimatology say?
Any hope that the Holocene would go long was shot down by Lisiecki and Raymo in 2005 in their rebuttal of Loutre and Berger, 2003. Lisiecki and Raymo in a landmark paper took an exhaustive look at 57 globally distributed deep Ocean Drilling Project seabed cores.
A Pliocene-Pleistocene stack of 57 globally distributed benthic D18O records
Since then no one in Quaternary Science has rebutted Lisiecki and Raymo. Not a fact to give one warm fussy feelings. Their research says no warming for ‘another 65 thousand years’ and a good possibility of a return to the Ice Box ‘without human influence’
Others agree.
A fall 2012 paper “Can we predict the duration of an interglacial?” says…
An earlier paper from 2007 “Lesson from the past: present insolation minimum holds potential for glacial inception” says
The two major questions I have is:
1. If we pump out enough CO2 into the atmosphere will it be enough to keep the earth from massive cooling? Even during the time between the two precession cycle peaks in MIS11 the temperature was darn cold and the climate chaotic and nasty. (Think Little Ice Age or worse.)
2. Do the Elite actually believe we are headed into either Little Ice Age conditions or worse. Are we being Grubered so they and their descendants can survive while we die? Is that why the emphasis on population control started in the 1970s at the same time Hays and Shackleton proved the Milancovitch theory with hard data from sea bed cores?
No matter what we need to quit playing games with idiotic toys like solar and wind and get serious about building nuclear power generating stations and desalinization plants, while we devote time and money to fission power.
Gail, help me out here regarding 65 degrees north and precession.
My understanding of precession theory is not that the axial tilt changes, but that the earth very slowly ( over 24 thousand years) wobbles around the same tilt, so that the time when the earth is closest to the sun slowly changes from the current month of January, to June, and then back, one cycle taking 24 k years.
Is there also a longer axial tilt change?
Odd.. trying to post an image but it keeps getting kicked out…… last try
http://s19.postimg.org/mkjk6feib/CO2_greening.jpg
https://stevengoddard.files.wordpress.com/2014/01/shockingpolarvortexfrom20000yearsagovs20140122v001.png
Andy, just a comment on the satellite maps of CO2 and ‘well mixed’
The “CO2 nadir resolution of 90 km X 90 km” means that even looking at a large area (averaged) it is STILL not well mixed!
As far as snow and the polar vortex goes.
?UV/Euv ===> ? Ozone ===> QBO ===> shift from zonal vs meridional jets.
This paper Recent variability of the solar spectral irradiance and its impact on climate modelling has some of the information.
More information with lots of peer-reviewed papers, I am not going to lay it all out again.
jet stream has gone from zonal to a meridional
Jet stream changes
brewster-dobson cycle
ozone
transrp says:
” Consider this statement. John consumes 2000 calories a day, and weighs 180 lbs. He has changed his diet, because he discovered Ben and Jerries /death By chocolate ice cream, and is not eating 2200 calories. Heck, lets be generous and say that he is eating 2150 calories. He still has the same amount of physical activity. Are you going to actually claim that at the end of a year, having consumed an extra 54000 calories that John has not going to have gained any weight? That at the end of 10 years, with that extra intake are you going to claim that John will not be seriously obese?”
Which, given the book I am now reading, is extremely funny.
It seems it is not HOW MANY CALORIES, but WHAT TYPE OF FOOD that you eat that puts on the weight.
Sugars and starches, esp. fructose flip a switch (insulin) that causes storage of fat within the liver. This causes a cascading bunch of nasty effects like calories stored as belly fat instead of being used, high blood pressure, cardiovascular disease, diabetes, liver damage and even cancer of the liver. It also has the effect of slowing the metabolism so you literally do not move as much while sitting or sleeping. Your body goes into starvation mode and conserves energy. So you eat less go on a conventional diet, cut calories, don’t eat enough fat or protein and continue gaining weight.
And yes transrp, I have read some of the peer-reviewed lit. I was struck by the definition of “low Carb” = 300 gr per day. That is over ten times what I consider my upper limit. And yes I lost 30 pounds counting carbs not calories when conventional diets just kept packing on the pounds. (My blood pressure dropped like a rock too.)
Where in my post did I mention changing food type? Are you going to change the type of CO2 that goes into the atmosphere? I know at least as much about diet and nutrition as you claim to which is why at almost 70 I take no medications, and can ski black diamond slopes. I only score a 9 on this test: http://discovermagazine.com/2013/nov/05-sit-down, but am working on it. I also got rid of allergies and asthma.
Keep experimenting. What works for some people does not work for others. I avoid HFCS like the plague. Lots of Dark Chocolate though
I suppose that some people on a 2000 cal diet that is working for them, could add 150 to 200 cal a day, and not gain weight. I would be surprised if anyone could produce a study that this worked for a majority of people in a random sample. I do not care how good the diet was.
Hey transrp! Wow! Sounds like whatever your diet and lifestyle are, it works for you! Keep it up!
And Gail, yes, I did pretty much the same as you almost a year ago. I cut way back on starches and sweets, but ate a lot more fat and protein. Not alwaysveasy for a vegetarian — but I lst about 30 pounds with no hunger or other issues. Feel a lot better now!
Yeah, loose thirty pounds and ten years!
That HFCS is shear poison.
Mother Jones has a story on how we got stuck with the crap.
http://www.motherjones.com/politics/1995/07/dwaynes-world
I seldom watch videos, and much prefer to read. But I watched this to the end
https://www.youtube.com/watch?v=dBnniua6-oM all 90 min of it. And on the subject of health and medicine I laughed so hard I cried. https://www.youtube.com/watch?v=QmSX5Kvj4BM
I still find it funny. On a more serious topic, look up chronic disease and inflammation. Bear in mind that I had (note the past tense) asthma. My crp is now about .5. I say about because at that level it gets hard to measure. Given that asthma involves inflammation of the respiratory tract, I am fairly sure that my CRP was at 2 or more when I had Asthma. http://medind.nic.in/iae/t09/i4/iaet09i4p213.pdf
After you check it out, go here: http://www.dnusbaum.com/immune26/My_story.html
Supposedly, since CRP binds with leptin, this should have helped me loose weight. But I am still just shy of being obese, at 215 lbs. Since I can ski hard, I tell myself that it is big bones and muscle 🙂
Well on the food we do agree. Esp the dark chocolate.
As far as adding calories. If you went from the 2000 calories of bread and pasta and HFCS ===> 2200 calories of meat + a few leafy green veggies you could increase the calories and actually lose weight since the impact of protein is to raise the blood levels of glucagon, a fat mobilizing hormone along with the insulin while carbs only raise the fat storage hormone insulin. The correct fats also actually help in weight loss by mobilizing the fat stored in the liver. Of course since fat and protein will sate the appetite while carbs will not you quit eating as much anyway.
I am only part way though the book and have not had a chance to do any research to confirm what they are saying. One bit of info especially for middle aged women is to stay away from dairy. No cheese or cream or milk. A bit of butter is OK.
The Doctors have no idea why dairy stops weight loss but it does based on hundreds of their patients. (I love cheese so that is not something I wanted to read.)
I might add that these people start with a full work up including hormones since it is aimed at us older folks.
Oh, and if you were not aware, something like 70% – 90% of Americans are deficient in iodine. The level of iodine consumption has dropped by 50% in the last 30 to 40 years. I read that else where too and checked it. The problem is the salt in all the junk food is not iodized. Only the salt you buy for home use is. That is going to really through your metabolism off especially for older folks who have to curb their salt intake.
This is all I have on iodine as far as peer-reviewed goes.
http://www.ncbi.nlm.nih.gov/pubmed/19534625
and a pop article:
http://www.lifeextension.com/magazine/2011/10/The-Silent-Epidemic-of-Iodine-Deficiency/Page-01
Here is the info on iodized salt in junk food.
Medscape Medical News from the:
American Association of Clinical Endocrinologists (AACE) 19th Annual Meeting
http://www.medscape.com/viewarticle/720930
…………………….
Another bit of dietary info: (If you have a wife she need this.)
Coenzyme Q10
http://www.ncbi.nlm.nih.gov/pubmed/16375724
http://www.ncbi.nlm.nih.gov/pmc/articles/PMC2785862/
http://umm.edu/health/medical/altmed/supplement/coenzyme-q10
transrp says:
“…The situation is GLOBAL warming. The globe includes that 66?% of the surface that is ocean. When the ocean warms, more moisture goes into the atmosphere. It does not stay there. No, that moisture comes back down. In the winter it comes down as snow. That is right. Even if the average temperature in winter goes up by a couple of degrees F over the course of 100 years (see this picture — http://cdn.phys.org/newman/csz/news/800/2015/30yearsofabo.png) and http://www.climatecentral.org/news/winters-are-warming-all-across-the-us-15590 what comes down will be snow, that simply means that average temperatures in a place like Wisconsin will be — and I am just guessing — 27 degrees, rather than 25 degrees. At 27 degrees it still snows in the winter. It does not rain. Hence more snow in the winter is evidence of global warming.
And I am sure that none of you will understand this. This probably also explains the great lakes freezing. And I am just guessing here… See — Ice and snow are big carriers of what can be called negative heat. All that snow cools the lakes enough so that even though the ambient air temp is a bit warmer, since that temp is still below freezing, less heat has to leave the water for it to freeze. Here is a fun experiment you can do. Take two glasses of water. at room temp. But an ice cube in one of them. Let it melt. Put both into the freezer. Guess which one will freeze over first…..”
Where to start on that mess….
We will start with the statement
When the ocean warms, more moisture goes into the atmosphere.
The first question is WHY do the oceans warm?
The answer is The SUN! and not only the sun but the part of the sun’s spectrum that changes the most. (See NASA and the paper I cited above)
Wavelengths of solar energth that penetrate and warm the ocean. Notice that IR is absent.
http://lasp.colorado.edu/media/projects/SORCE/images/news_images/SORCEchart5.png
A closer look
http://www.john-daly.com/sverdrup.gif
So it is again the variable sun that causes ocean warming to vary. Not only that Usoskin et al. (2014) identified a rare and unique Grand maximum of solar activity, which has occurred only once in the past 3,000 years. A “unique” and “rare” event in terms of both magnitude and duration. SEE: A History of Solar Activity over Millennia
That Grand Solar Maximum is now coming to a close.
MORE EVIDENCE:
Solar variability and climate change’ Geomagnetic aa index and global surface temperature
E.W. Cliver •and V. Borikoff •
Air Force Research Laboratory, Hanscom Air Force Base, Massachusetts
J. Feynman [Sister of Richard Feynman]
Jet Propulsion Laboratory, Pasadena, California
Predicting Solar Cycle 24 and beyond
Mark A. Clilverd,1 Ellen Clarke,2 Thomas Ulich,3 Henry Rishbeth,4
and Martin J. Jarvis1
Gail.. that’s way too much for the trancer.
Seems he is barely capable of basic arithmetic ! 😉
And emulates Phil Jones when it comes to Excel.
OUCH! Andy that is not nice to compare someone to an inept fool like Jones. I have no computer training and had no problem producing graphs for reports in Excel.
Although I will say this statement was a real rib cracker. “negative heat?” If there is no change of state the snow does nothing energy wise except what would be expected from its temperature. Rain would do the same.
“…Ice and snow are big carriers of what can be called negative heat. All that snow cools the lakes enough so that even though the ambient air temp is a bit warmer, since that temp is still below freezing, less heat has to leave the water for it to freeze….”
Seems he hasn’t been far enough north to realize that it is the clear nights that are bitter cold and you can actually freeze a bucket of water by insulating the bucket and exposing it to the night sky when the temperature is above freezing.
It is one of the experiments I want to try some fall or spring if we ever get a clear cool night.
Gail, Here’s a nice find.
Succinct and well put together.
https://wryheat.wordpress.com/2014/11/19/evidence-that-co2-emissions-do-not-intensify-the-greenhouse-effect/
This part is fun.. (my caps)
“there has been a significant DECREASE in down-welling, long-wave infrared radiation from increasing greenhouse gases over the 14 year period 1996-2010 in the US Great Plains.”
Actually Andy that is about what you would expect when you think about it. It just confirms Stevens graphs showing the USA has cooled over that period.
If the temperature of the land is cooler then you get less IR radiation going up and therefore less reflected back. (Taking it nothing else changes.)
John Kehr has a good article titled Temperature Dependence of the Earth’s Outgoing Energy (WordPress won’t let me link)
http://the…incon…venient…ske…ptic.com/
ok, just post the link, but break it up with some dots at a couple of random places.
Seems to work 🙂
http://theinc…onvenient…skeptic.com/2012/08/temperature-dependence-of-the-earths-outgoing-energy/
Now, anyone that wants to read it can just copy the link, remove the sets of 3 dots and any line spacing. Paste into a new window.. Done 🙂
Further
http://jennifermarohasy.com/wp-content/uploads/2013/12/AGW_Falsified_Michael_Hammer.pdf
And
http://hockeyschtick.blogspot.com.au/2013/03/man-made-global-warming-theory-is.html
Thanks Andy, now I have my reading for the week end.
Ah yes… The great plains. Comprising just over 1/2 M sq miles. Give the global surface is just over 50M sq miles you are talking about 1% of the surface. Oh… and that is only for long wave IR. Short wave IR carries mor energy. This is not cherry picking, it is picking the stems off of the seeds of the cherries.
One can selectively cherry pick data. For example AGW deniers love to show graphs of ocean surface temps. Again we are speaking of Global warming. When ice melts from the poles and glaciers it flows into the ocean as COLD FRESH (as in less dense) water. The densest cold water is less dense than seawater. So, that water stays near the surface, hence surface temps, so favored by AGW deniers, is not a reliable indicator of global temps.
Going back to all the the link above. An abundance of data. And I have to confess that I do not see its relevance. Really, what exactly is the connection between the heliomagnetic field and the temp of the earth? From fig 13 we can see that the HMF has increased by a factor of at least 5 in the past 500 years. And this correlates to global temperatures how exactly??
I would suspect that the bottom line in this stack of mostly irrevelant data, is total solar irradiance. The energy from the sun hitting the top of the earths atmosphere.
https://www.google.com/url?sa=i&rct=j&q=&esrc=s&source=images&cd=&cad=rja&uact=8&ved=0ahUKEwiUvfnW6Y3YAhUF6mMKHWZTDSgQjRwIBw&url=https%3A%2F%2Fskepticalscience.com%2Fsearch.php%3Ft%3Dc%26Search%3Dit%2527s%2Bthe%2Bocean&psig=AOvVaw2I7awXQrVLkEQX0Q0rbdw4&ust=1513489344309161
Observe that in 300 years this has increased by .1% or 1 part in 1000, and for the last fifty years it has remained the same or gone down. Yet in thpast 500 years the Global temp has increased by three times as much, most of that in the past fifty years when the TSI has either been constant or gone down.
Now you can change your claim to — well the sun really does not matter. It is actually cosmic rays, unicorn farts or something else. Not sure aboutr univorn farts, or other sources of hot air like the people who claim that CO2 has no effect, but this link puts to bed the myth of cosmic rays being a factor: https://www.skepticalscience.com/print.php?r=277
One can selectively cherry pick data. For example AGW deniers…
Still projecting, and still going for bad info from bad sources…
Skeptical Science is a climate alarmist website created by a self-employed cartoonist, John Cook. It is moderated by zealots who ruthlessly censor any and all form of dissent from their alarmist position. This way they can pretend to win arguments, when in reality they have all been refuted. The abuse and censorship does not pertain to simply any dissenting commentator there but to highly credentialed and respected climate scientists as well; Dr. Pielke Sr. has unsuccessfully attempted to engage in discussions there only to be childishly taunted and censoredwhile Dr. Michaels has been dishonestly quoted andsmeared. The irony of the site’s oxymoronic name “Skeptical Science” is that the site is not skeptical of even the most extreme alarmist positions.
John Cook is now desperately trying to cover up his background that he was employed as a cartoonist for over a decade with no prior employment history in academia or climate science.
Thanks to the Wayback Machine we can reveal what his website originally said,
“I’m not a climatologist or a scientist but a self employed cartoonist” – John Cook, Skeptical Science
A link from the Skeptical Science “About” page originally went to his cartoonist page,
“John Cook: A cartoonist working from home in Brisbane, Australia” – SEV
It is very important for Mr. Cook to keep up this facade, as once people learn of his lack of credentials and scientifically worthless employment history they are unlikely to take his website seriously no matter how he desperately pads his resume. As opposed to the highly credentialed climate scientists his staff harassed and censored;
Patrick J. Michaels, A.B. Biological Sciences, University of Chicago (1971); S.M. Biology, University of Chicago (1975); Ph.D. Ecological Climatology, University of Wisconsin-Madison (1979); Research and Project Assistant, Center for Climatic Research, University of Wisconsin (1976-1979); Assistant Professor of Environmental Sciences, University of Virginia (1980-1986); Virginia State Climatologist (1980-2007); President, Central Virginia Chapter, American Meteorological Society (1986-1987); Executive Board, American Association of State Climatologists (1986-1989); Associate Professor of Environmental Sciences, University of Virginia (1986-1995); President, American Association of State Climatologists (1987-1988); Chair, Committee on Applied Climatology, American Meteorological Society (1988-1999); Senior Fellow in Environmental Studies, Cato Institute (1992-Present); Visiting Scientist, Marshall Institute (1996-Present); Member, American Association for the Advancement of Science; Member, Association of American Geographers; Member, Sigma Xi, The Scientific Research Society; Professor of Environmental Sciences, University of Virginia (1996-Present); Contributor and Expert Reviewer, IPCC (1990, 1992, 1995, 2001, 2007)
Roger A. Pielke Sr., B.A. Mathematics, Towson State College (1968); M.S. Meteorology, Pennsylvania State University (1969); Ph.D. Meteorology, Pennsylvania State University (1973); Research Assistant, Pennsylvania State University (1968); National Science Foundation Trainee, Pennsylvania State University (1968-1971); Research Meteorologist, Experimental Meteorology Laboratory, NOAA (1971-1974); Assistant Professor, Department of Environmental Sciences, University of Virginia (1974-1977); Distinguished Authorship Award, NOAA (1974); Leroy Meisinger Award, American Meteorological Society (1977); Associate Professor, Department of Environmental Sciences, University of Virginia (1978-1981); Chief Editor, Monthly Weather Review (1981-1985); Fellow, American Meteorological Society (1982); Associate Professor of Atmospheric Science, Colorado State University (1982-1985); Abell New Faculty Research and Graduate Program Award (1984); Deputy Director, Cooperative Institute for Research in the Atmosphere (1985-1988); Professor of Atmospheric Science, Colorado State University (1985-2000), Abell Research Faculty Award (1987/1988); Researcher of the Year, Colorado State University Research Foundation (1993), Pennsylvania State Centennial Fellow (1996); Alumni of the Year, Pennsylvania State College of Earth and Mineral Sciences (1999); Colorado State Climatologist (1999-2006); Engineering Dean’s Council Award, Colorado State University (2000); Adjunct Professor, Department of Civil and Environmental Engineering, Duke University (2003-2006); Fellow, American Geophysical Union (2004); Visiting Professor, Department of Atmospheric Sciences, University of Arizona (2004); Senior Research Scientist, Cooperative Institute for Research in Environmental Sciences, University of Colorado-Boulder (2005-Present); Senior Research Associate, Department of Atmospheric and Oceanic Sciences, University of Colorado-Boulder (2005-Present); Professor Emeritus of Atmospheric Science, Colorado State University (2007-Present)
References:
Refuting 104 Talking Points from Skeptical Science(PDF) (28pgs) (Lubos Motl, Ph.D. Theoretical Physics, March 29, 2010)
Skepticalscience – Rewriting History (Shub Niggurath Climate, October 10, 2011)
Roger Pielke Sr at the SS.com: A dark day in the climate science debate (Shub Niggurath Climate, September 18, 2011)
Skepticalscience.com quote surgery on Pat Michaels(Shub Niggurath Climate, January 18, 2012)
My Interactions With Skeptical Science – A Failed Attempt (So Far) For Constructive Dialog (Roger A. Pielke Sr., September 17, 2011)
Final Comments On My Interaction With Skeptical Science (Roger A. Pielke Sr., September 21, 2011)
Response To Skeptical Science On A Series Of Weblog Posts (Roger A. Pielke Sr., October 25, 2011)
A Response to Skeptical Science’s “Patrick Michaels: Serial Deleter of Inconvenient Data” (Patrick J. Michaels, January 17, 2012)
Update: In March of 2012, the climate alarmist website Skeptical Science had their forums “hacked”and the contents posted online. What was revealed is simply astonishing,
Skeptical Science: The Censorship of Poptech
“The impact of that ban on PopTech was to silence him.” – [Skeptical Science]
Skeptical Science: “Ding dong, the witch is dead”
“Conservative commentator Andrew Breitbart is dead at 43” “Ding dong, the witch is dead…” – John Hartz [Skeptical Science], March 2, 2012
Skeptical Science: “[W]e’re all a bunch of leftists”
“It’s official, we’re all a bunch of leftists” – John Cook [Skeptical Science], August 26, 2011
Skeptical Science: The Partnership with Al Gore
“This morning, had a long skype call with a guy working with Al Gore’s Climate Reality Project. […] He brought up the possibility of a partnership. […] an exciting opportunity and another vindication of what we’re doing” – John Cook [Skeptical Science], September 27, 2011
Skeptical Science: From Al Gore to Al Jazeera
“Al Jazeera want[s] to feature SkS as the Site of the Week… Am sending them some info and pics now.” – John Cook [Skeptical Science], September 28, 2011
Skeptical Science: Too Inaccurate for Joe Romm
“Just got this email from Joe Romm: You must do more post vetting. More errors are creeping into posts and it will start making people like me wary of using them.” – John Cook [Skeptical Science], December 2, 2011
Skeptical Science: “Drown Them Out”
“Badgersouth [John Hartz] and I were just discussing the potential of setting up a coordinated “Crusher Crew” where we could pull our collective time and knowledge together in order to pounce on overly vocal deniers on various comments sections of blogs and news articles.” – Rob Honeycutt [Skeptical Science], February 11, 2011
http://www.populartechnology.net/2012/03/truth-about-skeptical-science.html?m=1
Class dismissed!
NEXT transrp says:
“…And I am sure that none of you will understand this. This probably also explains the great lakes freezing. And I am just guessing here… See — Ice and snow are big carriers of what can be called negative heat. All that snow cools the lakes enough so that even though the ambient air temp is a bit warmer, since that temp is still below freezing, less heat has to leave the water for it to freeze….”
This of course is the latent heat of vaporization, ?Hvap = 2257(kJ/kg)
As anyone knows who boils a kettle for tea as I do in the morning, with energy going into ?Hvap the temperature does not change but the state of the water does from liquid to vapor. The energy instead of raising the temperature breaks down the intermolecular attractive forces, and also provides the energy necessary to expand the gas. Water’s latent heat of fusion is only 334 kJ/kg so when water vapor in the atmosphere forms ice crystals it releases 2,591 kJ/kg
This BTW is the reason temperature is a rotten measure of earth energy.
>>>>>>>>>>>>>>>>>>>>>>>>>>>>>>>
So now what happens? The water vapor rises and forms clouds of water and ice RELEASING THE HEAT IN THE UPPER TROPOSPHERE!
In other words water transports the heat from the surface to the tropopause where it takes off for outer space. Since there is little or no water in the stratosphere there is nothing to prevent this escape of heat.
The water, now in the form of rain, snow or hail can be carried for miles on the jets to be dropped over land.
Sleepalot and I took a look at an actual example, the humid Brazilian rain forest, Barcelos, Brazil (L= 0.9750° S), and the dry N. African Desert, Adrar, Algeria. (L= 27.8667° )
This data is from May (2012) which is midway between the vernal equinox and the summer solstice.
Barcelos, Brazil
….monthly min 20C, monthly max 33C, monthly average 26C
Average humidity 90%
Adrar, Algeria
…..monthly min 9C monthly max 44C, monthly average 30C
Average humidity around 0%
The effect of the addition of water vapor (~ 4%) is not to raise the temperature but to even the temperature out. The monthly high is 10C lower and the monthly low is ~ 10C higher when the GHG H2O is added to the atmosphere in this example. The average temperature is about 4C lower in Brazil despite the fact Algeria is further north above the tropic of Cancer. Some of the difference is from the effect of clouds/albedo but the dramatic effect on the temperature extremes is also from the humidity.
I took a rough look at the data from Brazil. Twelve days were sunny. I had to toss the data for two days because it was bogus. The average humidity was 80% for those ten days. The high was 32 with a range of 1.7C and the low was 22.7C with a range of 2.8C. Given the small range in values over the month the data is probably a pretty good estimate for the effects of humidity only.
You still get the day-night variation of ~ 10C with a high humidity vs a day-night variation of 35C without and the average temp is STILL going to be lower when the humidity is high and the effect of clouds is removed.
DATA from: classic(DOT)wunderground.com/history/station/82113/2012/5/22/MonthlyHistory.html
This data would indicate GHGs have two effects. One is to even out the temperature and the second is to act as a “coolant” at least if the GHG is H2O, the most significant GHG.
This graph shows the effect of the sun in the desert with no or little water
https://web.archive.org/web/20140227102218/http://www.shadowchaser.demon.co.uk/eclipse/2006/thermochron.gif
an article I came across: https://skepticalscience.com/some-facts-change-conservative-minds.html
On the other hand, no information will change the mind of an insect or a plant. And as my article shows most AGW deniers are literally dumber than plants and insects. See, you can cherry pick and lie all that you want about what different observations and measurements are or mean. But I would like to see a AGW denier find a single living species that is moving towards lower latitudes or towards lower elevations. Find an ecosystem that is not changing in a way that indicates a warming planet.
For example, we know that behavior patterns of ecosystems are determined by the length of day or temperature changes. We know that the length of the days are not changing other than seasonally. So, how does one explain earlier flower blooming, earlier / later migrations, etc.? Are all of those life forms wrong? Perhaps paid by the elite intellectuals?
How about later foliage color changes? Later freezing and earlier thawing of bodies of water?
Blog has move, a year ago, to https://realclimatescience.com .
And as my article shows most AGW deniers are literally dumber than plants and insects.
The fact that you are ignorant enough to believe that, think that, and even dumber still to put that in a comment tells skeptics all we need to know about our incredibly ill informed and gullible adversaries.
You are a joke that does not even recognize its own punchline.
Yet you did not refute a single one of my allegations. You give no counterexamples. You did not, for example, point to a single life form that is moving towards lower latitudes or elevations. You did not point to a single species that is migrating later in the year as opposed to earlier. All that you can do is engage in ad-hominem attacks and name-calling.
Now you can accuse me of the same thing, viz. dumber than plants and insects, but I support my allegations with numerous examples of other life forms being responsive to their environment. You support your statement with zero evidence.
Here is a guess… I bet that you are a trump supporter 🙂 The only large body of literate people on the planet who deny AGW are American conservatives.
Your self inflicted example was all I needed.
Thanks!
You remind me of the following: For every complex problem there is an answer that is clear, simple, and wrong.
But it would fit your attention span. Not more than 144 characters.
Not only are you a Trump supporter, you probably one of the people that he loves. The uneducated. I doubt that you ever took, let alone passed an upper division physics course. And of course, you know that I am right.
Who I am (or claim to be) makes no difference, but all you have to offer are ad homs, so that is what I get from you. The truth is all that matters, and the truth is you are projecting on a massive scale.
Do you have a point to make? All I see is you wasting time yammering on about natural processes like migration and melting ice.
“but all you have to offer are ad homs, so that is what I get from you. ” You admitted to not reading my link. :Your self inflicted example was all I needed.
Here you demonstrate your basic ignorance of science: “The truth is all that matters,” Science deals in evidence and making predictions that can be substantiated or falsified. It does NOT deal in truth. You. of course, are too ignorant to know that
Next: As with true, one can not prove anyting in the world of science. Proof is reserved for logic and mathematics: But again, your are to ignorant to know this. Worse, you are to ignorant to bother looking up the concept. Much like the president of whom you are a fan, you suffer from the belief that you have all knowledge and need not learn anything more.
https://en.wikipedia.org/wiki/Scientific_evidence#Concept_of_“scientific_proof”
While the phrase “scientific proof” is often used in the popular media,[13] many scientists have argued that there is really no such thing. For example, Karl Popper once wrote that “In the empirical sciences, which alone can furnish us with information about the world we live in, proofs do not occur, if we mean by ‘proof’ an argument which establishes once and for ever the truth of a theory,”.[14][15]
Bottom line you do not know the meaning of the words that you use. This is evidence, BUT NOT PROOF, THAT You are, literally, scientifically illiterate. In fact, I suspect that most of your post was a cut and paste from the conservative echo chamber
And speaking of Trump: I accidentally came across this:
noun
1. attractive articles of little value or use.
adjective
1. showy but worthless.
“trumpery jewelry”
transrp says:
December 31, 2015 at 4:01 pm
One more item. Name calling — the rhetorical technique used when a person doing the name calling has neither the logic nor information to make an intelligent argument…
Now, if you want to prove that man is responsible for global climate changes, you must…
1- List all climate forcings, order them from most to least effectual, and then quantify them all.
2- Please provide even one peer reviewed paper that refutes natural variability as the cause of recent, or any, global climate changes.
There is nothing unusual or unprecedented about our climate, or how we got here. For 4,500,000,000 years climates have always changed, naturally. This means there has been a set precedent, and the burden of proof falls on natural climate change deniers like yourself.
Let the science speak for itself.
a : knowledge or a system of knowledge covering general truths
I suspect that you had to search a lot of sources to find that. Well… cherry picking That is what AGW deniers do. One of the few fields in which they are expert.
This is probably beyond your attention span, but I thought that it gave a fairly good description of the relationship between how truth is used in the field of science.: http://berkeleysciencereview.com/truth-in-science/ Note this key sentence:
. The strongest scientific evidence is compiled into a consensus, which we take as our empirical truth. So even if we take your definition of truth, then it is clear that
And of course, the current scientific consensus is among the scientists that wrote the 97% of published papers that show that the climate is warming 🙂 Again, a bit of data known by almost all life forms on the planet. So, even if we take yor poor definition of truth at its value, you and your equally ignorant right wing friends in the echo chambers are shown to be wrong.
You confuse common usage of language with technical. Karl Popper got it right. By definition, if something is technically true, then it can be proven. This just does not happen in the real world. As an example, consider all those poor fools that had idiots like you on a jury who found them guilty beyond a reasonable doubt. Cause the prosecutors told the truth. Yea… that worked.
You do not even know the meaning of truth. In fact, if you had bothered to look you wouuld fimnd that its definition is circular. But again … probably beyond your attention span.
I am amazed that you place more value on a common dictionary than on the statements of Karl Popper who basically established the philosophical foundations of science in the 20th century.
And what science does is make predictions. And Climate scientists have made many. Most of them, from extended fire seasons to more extreme weather to more frequent and violent storms have come to pass.
Here are some lists: https://climate.nasa.gov/effects/
By the 1960s and ’70s, climate scientists were making more detailed predictions. They said that as the surface of the Earth warmed, the temperature in the highest reaches of the atmosphere would fall. That is exactly what happened.
https://www.nytimes.com/interactive/2017/07/28/climate/more-frequent-extreme-summer-heat.html
Anyway, I write this because I came across this demonstration of ignorance at your level:
http://www.cnn.com/2017/12/15/opinions/federal-judgeships-toobin-opinion/index.html
The difference is that at least Matthew Petersen has a degree, whereas it is unlikely that you even went to college. Well, maybe a few courses at a local community college
I suspect that you had to search a lot of sources to find that.
Nope, just the old standby, Merriam Webster’s.
Well… cherry picking That is what AGW deniers do.
Nope, I know that 1979 was not the day the Earth formed, pure projection on your part.
The strongest scientific evidence is compiled into a consensus, which we take as our empirical truth.
Consensus is not science, it is a popularity contest.
And of course, the current scientific consensus is among the scientists that wrote the 97% of published papers that show that the climate is warming.
Warming is s natural phenomenon.
am amazed that you place more value on a common dictionary than on the statements of Karl Popper who basically established the philosophical foundations of science in the 20th century.
I prefer hard science to pop-science. Hard science adheres to the scientific principle, not consensus.
Now that you have been schooled once again, let’s have it.
1- List all climate forcings, order them from most to least effectual, and then quantify them all.
2- Please provide even one peer reviewed paper that refutes natural variability as the cause of recent, or any, global climate changes.
There is nothing unusual or unprecedented about our climate, or how we got here. For 4,500,000,000 years climates have always changed, naturally. This means there has been a set precedent, and the burden of proof falls on natural climate change deniers like yourself.
Wonderful… As for schooling me. There are many dictionaries. They all have similar but different words to define a specific word. There is one that is considered to be the definitive dictionary, the OED, but that requires a paid membership. So, I did a search of dictionaries and definitions of science: These were the top five that came back.
Please note that none of them use any version of the word true or truth. This is not surprising since other than formal logic or mathematics there really is no definition of truth that is not circular. The closest that one can come is that a true statement is one that conforms to reality. But if you look up real that is usually defined as that which is or which is true.
In fact, even in formal logic, you could easily change truth tables to smurf tables, and none of the axioms or theories would change. Viz. If A is smurf, and B is smurf than that statement A and B is also Surf and Not A is “not smurf” etc. Except for the words true and smurf, a smurf table would look exactly like a truth table.
Now lets look at the FIVE definitions that I found:
3 a : knowledge or a system of knowledge covering general truths
https://www.Merriam-webster.com/dictionary/science
Wonderful… As for schooling me. There are many dictionaries. They all have similar but different words to define a specific word. There is one that is considered to be the definitive dictionary, the OED, but that requires a paid membership. So, I did a search of dictionaries and definitions of science: These were the top five that came back.
Please note that none of them use any version of the word true or truth. This is not surprising since other than formal logic or mathematics there really is no definition of truth that is not circular. The closest that one can come is that a true statement is one that conforms to reality. But if you look up real that is usually defined as that which is or which is true.
In fact, even in formal logic you could easily change truth tables to smurf tables, and none of the axioms or theories would change. Viz. If A is smurf, and B is smurf than that statement A and B is also Surf and Not A is “not smurf” etc. Except for the words true and smurf, a smurf table would look exactly like a truth table.
So, in most of the universe, science, as both I and Karl Popper have said, science has no formal connection with truth or true. Only common people, or those ignorant of the nature of science and living in a Humpty Dumpty world think that there is a connection.
And as I said, other than circular definitons, I really could not find any formal definition of true, truth, reality, etc. Perhaps you could find one. Given your failure to find or understand what Science is, I doubt it.
Not that it matters, but I have a degree in Remote Sensing, was a climatology student right in between the ice age scare and the great global warming swindle, after having spent 4 years in the geology department.
Hmmm. Geology is not climatology. They are, at best, distantly related. Remote sensing would imply some knowledge of physics and math, but maybe not. You may just have learned how to some equipment and interprete the results. I did a search and saw no evidence that there was any math requiremment, though I assume that you may have some understanding of algebra. But heck, that level of math is sufficient to prove the basics of special relativity.
Here, again, you demonstrate your scientific illiteracy:
I prefer hard science to pop-science. Hard science adheres to the scientific principle, not consensus.
The closest that I came to the concept of pop Science is to mention Karl Popper. https://en.wikipedia.org/wiki/Karl_Popper He is generally regarded as one of the 20th century’s greatest philosophers of science.[11][12][13]
You really do have very poor reading comprehension skills.
As to this: The strongest scientific evidence is compiled into a consensus, which we take as our empirical truth.
Consensus is not science, it is a popularity contest.
Gee — not according to: https://en.wikipedia.org/wiki/Scientific_consensus
which uses the word popular only once.
You are probably not familiar with: https://en.wikipedia.org/wiki/Consilience which includes: The strength of the evidence, considered together as a whole, results in the strong scientific consensus that the theory is correct.[6] In a similar way, evidence about the history of the universe is drawn from astronomy, astrophysics, planetary geology, and physics.[2]
Your use of words reminds me of : this quote from Througu the Looking glass
‘When I use a word,’ Humpty Dumpty said, in rather a scornful tone, ‘it means just what I choose it to mean — neither more nor less.’
‘The question is,’ said Alice, ‘whether you can make words mean so many different things.’
‘The question is,’ said Humpty Dumpty, ‘which is to be master — that’s all.’
Now to your requests and the incredible amount of ignorance of which they are evidence.
1- List all climate forcings, order them from most to least effectual, and then quantify them all.
This would be equivelant to stating that to show evidence that, say Substance X causes cancer that a scientist first needs to:
List all causes of cancer, and order them from most to least effectual and then quantify them all
2- Please provide even one peer reviewed paper that refutes natural variability as the cause of recent, or any, global climate changes.
http://journals.ametsoc.org/doi/abs/10.1175/2010JCLI3659.1?prevSearch=%5Bauthor%3A+delsole%5D&searchHistoryKey=
While the IMP can contribute significantly to trends for periods of 30 yr or shorter, >>> it cannot account for the 0.8°C warming that has been observed in the twentieth-century spatially averaged SST. <<<***
this is ust one of five papers: https://www.skepticalscience.com/resources.php?a=links&arg=461&peer=1
Here is another — from meterologists who actually know the difference between climate and weather http://www.ametsoc.net/eee/2016/2016_bams_eee_low_res.pdf which contains this gem, which because of our poor reading comprehension skills will make you think that this paper supports your position and refutes mine:
A big question raised by this collection of research
is whether these findings undermine the axiom that
“no event is caused by climate change alone and that
natural variability always plays some role.” The short
answer is no. While several of the studied events were
found not to be possible without climate change,
natural variability still laid the foundation for the
events to occur, and the authors acknowledge this
in their papers.
and while searching I came across this bit that appears to imply that not only are AGW deniers flat out dumber than plants. They are also something that plants are NOT. Dishonest..
https://www.snopes.com/400-papers-published-in-2017-prove-that-global-warming-is-myth/
The first time that Breitbart ran a NTZ based-story, numerous scientists listed in the report pointed out their their graphs had been digitally altered by NTZ to omit data, and that NTZ had either misinterpreted their papers or read them so superficially that the author of the post did not realize he was sometimes quoting from general background material and not the actual findings of the papers themselves.
Are you working NOW in any science field? Well maybe for some right wing site or some fossil fuel site that wants someone who can do simple sciency tasks. But not for a corporation whose income and survival depends on accurate valid science, like a fossil fuel company, or any energy company, or any real university (Bob JOnes university does not count) Cause if you are, and they see these posts, you will need to update and shop your resume, and pray that any possible employer does not do a search on your name. Cause you have poor reading comprehension skills, and as I have shown, are really scientifically illiterate, not even knowing what science is..
(Yawn) Still tryin g to redefine “truth” and “science”, how Orwellian.
Hmmm. Geology is not climatology.
I also told you I was a climatology student, but then your reading comprehension skills are next to nil.
Thanks for all the kiddy fairytale stuff.
The fact that you believe you found a paper that refutes natural variability proves you are scientifically illiterate, as no such paper exists. Can you guess where you went wrong?
Care to try again? LOL
Evolution is a theory, and you could not be more wrong.
“(Yawn) Still tryin g to redefine “truth” and “science”, how Orwellian.”
Let me see. You had a single definition of science that used the term truth. But truth, as my several examples showed, is not defined. I, on the other hand, provided at least 5 definitions of science that did not include the concept of truth, as well as a description laid down by Karl Popper, who is generally acknowledged to be one of the most important philosophers of science in the 20th century. Given those stated facts, just who is redefining science and truth?
Yes… I saw that you said that you were a student of climatology. Did you pass the 1, 3, ??? courses that you took? Did you ever work in the field. I was a student of and got A’s and B’s in quantum mechanics courses. That does not mean that I really know anything about the concept. I do not, however, feel bad since more than one physicist has said something to the effect that anyone who claims that they understand quantum mechanics does not understand quantum mechanics. So you were a student of climate. That is not evidence that you understand it..
now this gem: “The fact that you believe you found a paper that refutes natural variability proves you are scientifically illiterate, as no such paper exists. Can you guess where you went wrong?”
And you know that no such paper exists because you read them all? And of course, as I predicted, you did not understant this:
A big question raised by this collection of research
is whether these findings undermine the axiom that
“no event is caused by climate change alone and that
natural variability always plays some role.” The short
answer is no. While several of the studied events were
found not to be possible without climate change,
natural variability still laid the foundation for the
events to occur, and the authors acknowledge this
in their papers.
exactly what part of the phrase “While several of the studied events were
found not to be possible without climate change,” did you not understand??
Here is one. It has pictures so possibly you can understant it:
https://www.ncdc.noaa.gov/monitoring-references/faq/global-warming.php
Over several centuries, it may be possible to observe the effect of these orbital parameters, however for the prediction of climate change in the 21st century, >>>these changes will be far less important than radiative forcing from greenhouse gases.<<<
And yes. Evolution is a theory. So are Newtons Theories, General and Special relativity, The standard model of Quantum Mechanics. All are theories. What, exactly, was the point that you were, in your scientific illiteracy, trying to make?
Karl Popper is one misguided philosopher, and you found him, congratulations! Popper thumbed his nose at centuries of established scientific rigor, which suited his and your agendas greatly. You are both sophists.
Thanks for finally admitting that you did not know that evolution was a theory.
Class dismissed.
I noticed that you never mentioned the field in which you made a living. My guess is that it was nowhere related to STEM, except maybe working as a janitor in a building where actual scientists work.
While you may not be a young earth creationist since you state that the climate has been changing for over a 4M year, everything else about screams young earth creationist… Few outside of the YEC school would think that acknowledging that a general statement about how the world works can be anything other than a theory. That is, a statement about how the world works and will work in the future can be falsified, or shown a need to be modified. In fact, from Newtons theories to the germ theory of disease to the standard model of physics, almost theories have needed to be modified To the extent that there are facts in science, those are more likely to be mathematical laws. such as the inverse square law of light from a point source.
Then there is your method of response. You cherry pick a few items that I say and then respond in a way that you think is clever. For example your statement that Karl Popper is a Sophist. Maybe to you, and very few others. By what metric to you Judge Dr. Popper? Your own revealed truth? This was #2 after the Wikipedia entry. https://plato.stanford.edu/entries/popper/
Karl Popper is generally regarded as one of the greatest philosophers of science of the 20th century.
and this: https://www.britannica.com/biography/Karl-Popper which mentions that he was knighted. I wonder if what universe you will ever be accorded any recognition at all.
And at this point, given your continued repeated demonstrations of scientific illiteracy, inability to learn (seriously, when was the last time that you learned anything from anybody than someone else in your echo chamber) cherry-picking, refusal to acknowledge the points that I make a 99% track record of making statements that I have refuted with an abundance of evidence etc etcl, I have reached my limit as to what you can teach me. And yes one can even learn from bad examples/fools like you.
My time is valuable, and future responses to you will just be wasting it..
I said class dismissed! Why are you still prattling on?
You were ignorant enough to believe that there are papers to disprove natural variability, because you are ignorant of the conclusions of the papers you posted. You failed climate science 101, and I do not give mulligans or passing grades to those who fail to even try to learn.
Arrogance is ignorance Ms transrp, and you have both in spades.
Care to try again? Fools do love fools errands. LOL
Here you demonstrate your basic ignorance of science: “The truth is all that matters,” Science deals in evidence and making predictions that can be substantiated or falsified. It does NOT deal in truth.
Definition of science
1 : the state of knowing : knowledge as distinguished from ignorance or misunderstanding
2 a : a department of systematized knowledge as an object of study the science of theology
b : something (such as a sport or technique) that may be studied or learned like systematized knowledge have it down to a science
3 a : knowledge or a system of knowledge covering general truths
https://www.merriam-webster.com/dictionary/science
Now that you have been schooled once again, let’s have it.
1- List all climate forcings, order them from most to least effectual, and then quantify them all.
2- Please provide even one peer reviewed paper that refutes natural variability as the cause of recent, or any, global climate changes.
There is nothing unusual or unprecedented about our climate, or how we got here. For 4,500,000,000 years climates have always changed, naturally. This means there has been a set precedent, and the burden of proof falls on natural climate change deniers like yourself.
As an example, consider all those poor fools that had idiots like you…
The difference is that at least Matthew Petersen has a degree, whereas it is unlikely that you even went to college. Well, maybe a few courses at a local community college
Once again, you have no argument and resort to unfounded personal attacks. This is especially amusing considering you wrote…
And as my article shows most AGW deniers are literally dumber than plants and insects.
Not that it matters, but I have a degree in Remote Sensing, was a climatology student right in between the ice age scare and the great global warming swindle, after having spent 4 years in the geology department.
Once again…
1- List all climate forcings, order them from most to least effectual, and then quantify them all.
2- Please provide even one peer reviewed paper that refutes natural variability as the cause of recent, or any, global climate changes.
There is nothing unusual or unprecedented about our climate, or how we got here. For 4,500,000,000 years climates have always changed, naturally. This means there has been a set precedent, and the burden of proof falls on natural climate change deniers like yourself.
Several people made the observation that I said: One more item. Name calling — the rhetorical technique used when a person doing the name calling has neither the logic nor information to make an intelligent argument so needs to use debate techniques that anyone with a triple digit IQ abandoned by 5th grade.
Yet I said that AGW deniers are dumber than plants. Having very poor reading comprehension skills,, them missed the part where I said that that technique is used when the person using it “has neither the logic nor information to make an intelligent argument “. But I put forth abundant logic and information showing that plants and micro-organisms are “smart enough” to sense the change in temperature and are either moving towards the poles or to higher elevation. Given the abundant articles describing that change in their ranges (a search on the words plant animal response global warming range gets 13M+ hits) why would you doubt that plants and animals are engaging in more intelligent behavior than those who simply deny the existence of AGW? Really, what exactly is the evidence that an AGW denier is not dumbeer than a plant?
Quit running from the central issue of this debate.
Once again…
1- List all climate forcings, order them from most to least effectual, and then quantify them all.
2- Please provide even one peer reviewed paper that refutes natural variability as the cause of recent, or any, global climate changes.
There is nothing unusual or unprecedented about our climate, or how we got here. For 4,500,000,000 years climates have always changed, naturally. This means there has been a set precedent, and the burden of proof falls on natural climate change deniers like yourself.