In 1931, CO2 levels were a very safe 305 PPM.
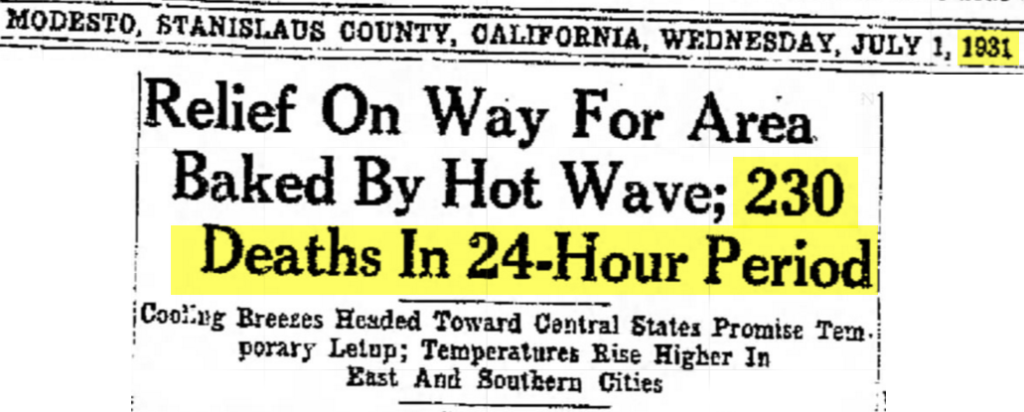
The US had one of the worst heatwaves in history, killing one person every six minutes.
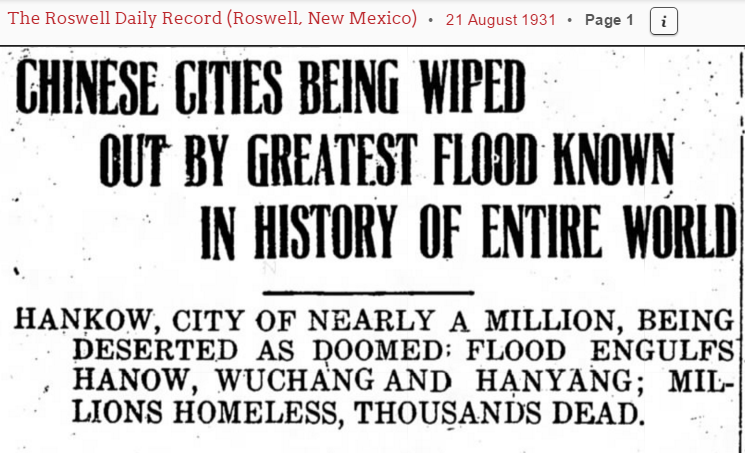
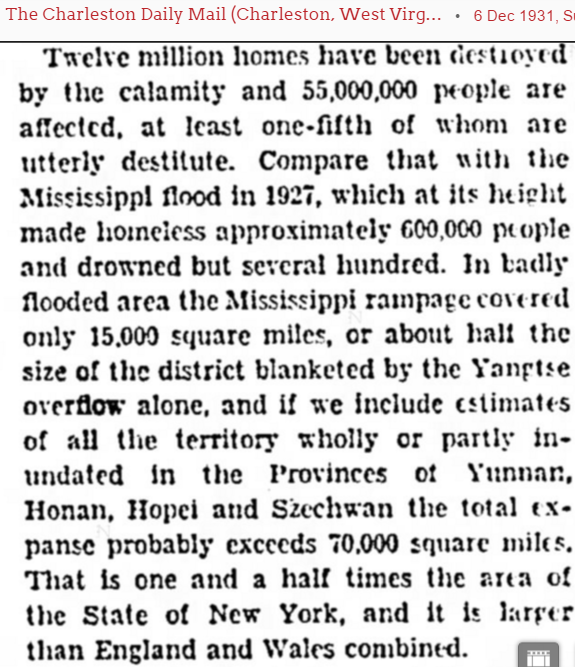
A few weeks later, a flood in China killed millions of people, and left 50 million homeless.
Climate experts hope to restore the safe, stable happy climate of 1931. #COP21


January 3, 1890…CO2 levels were very low and it was very cold….
5 degrees in Tacoma. -4 in Portland, Oregon.
https://news.google.com/newspapers?nid=1982&dat=18900102&id=EC8iAAAAIBAJ&sjid=8aMFAAAAIBAJ&pg=1873,31888&hl=en
Here is a paper that shows the change to modern temperatures was abrupt and happened over 150 years ago. LINK
So what happened a decade before the abrupt change in temperature in the mid 1800s?
Solar Cycle 7
Began in May 1823 with a smoothed sunspot number of 0.1 and ended in November 1833. Peak count ~105
http://www.solen.info/solar/cycl7.gif
Solar Cycle 8
Began in November 1833 with a smoothed sunspot number of 7.3 and ended in July 1843.
Peak count ~210
http://www.solen.info/solar/cycl8.gif
Now that was quite a jump in sunspot activity! What is happening now?
http://solen.info/solar/images/comparison_recent_cycles.png
The earth has just come out of a rare and unique Grand maximum of solar activity, which has occurred only once in the past 3,000 years. SEE: A History of Solar Activity over Millennia
The sun has now gone ‘sleepy.’ Dr Evans Notch-Delay Solar Theory says there is a delay of one sunspot cycle between a change in the sun and the change in climate here on earth.
Current Solar Cycle 23 & 24
Peak count Cycle 24 ~110
https://cbdakota.files.wordpress.com/2013/05/cycles23_24april13.png
The cycle 24 peak is about the same as cycle 7 and has been falling since December 2014.
The variability of the sun
https://cbdakota.files.wordpress.com/2011/05/400yearsofsunspot_numbers.png
Livingstone and Penn’s forecast is for a Solar Cycle 25 maximum amplitude of 7.
https://wattsupwiththat.files.wordpress.com/2014/03/clip_image018_thumb.gif
Interesting information. Thanks for posting Gail.
Excellent points and resources, Gail.
Thanks Spock, welcome to the site.
Thanks, Gail. Information about the Sun started and ended the scientific revolution:
1. The scientific revolution began in 1543 when Copernicus reported a giant fountain of energy at the center of the solar system – the Sun.
2. The scientific revolution ended in 1945 when atomic bombs revealed energy in the Sun that made and sustains every atom, life and planet in the solar system.
Immediately after WWII, the internal composition of the Sun was changed from
_ a.) Mostly iron (Fe) in 1945 to
_ b.) Mostly hydrogen (H) in 1946
Other information frightened world leaders tried to hide from the public after WWII:
https://dl.dropboxusercontent.com/u/10640850/Solar_Energy.pdf
Let’s also ‘restore’ the ‘climate’ to 1935 and 1936. If weather is NOT the same as the climate then someone should tell ALL Warmists right now. WE are the ones who must act now for the sake of sanity.
UAH November Global is in. a slight drop to +0.33Cº anomaly.
On a year to end November basis.. anomaly Cº in order from least cold.
1998 — 0.505
2010 — 0.366
2015 — 0.253
By my calculations that means that December needs an anomaly of +2.772Cº for 2015 to be the “hottest heifer”
http://vignette3.wikia.nocookie.net/southpark/images/d/d0/Red_Heifer.jpeg
Actually that’s wrong.. Whole of year 1998 had an anomaly of 0.483Cº ..
so the anomaly for December would need to be (0.483*12) – (0.253*11) = + 3.013Cº
You can’t prove that anything bad happened in China. How do we know that all those people didn’t die of natural causes?
Oooohhh! Good point, Andy!
Yeah! That was no proof at all! All you have shown is that some people died, and we all agree that people died. We demand proof! Anecdotal, old tales, with no more substantiation than contemporaneous eyewitness reports, photos, multiple printed records, historical news clippings, and meteorological charts and not proof. Heck, they are not even evidence! You can’t PROVE that stuff happened, no matter what you say! Those people could have been part of a suicide cult! You’ll have to do better than that, Steven. You’ll have to provide proof — you know, like an unsubstantiated poll of self-proclaimed experts, one where most subjects don’t respond, the questions are vague, and where you throw out the answers that don’t fit your agenda. You know… PROOF!
(Pardon the sarcasm, Steven….. if that is REALLY who you are!)
🙂
Yangtze river has always been problematic. Three Gorges dam might have reduced the risk of flooding.
As I remember, from 1998 Years flood disaster, the river flows in a narrow gorge until it reaches large lowlands at a level round 40 m above the ocean. Fast flowing goes into slow flowing. Wetlands is agricultural land and China is crowded.
Think rice paddies.
Origin of rice agriculture on the Middle and lower Yangtze River
December 12, 1919 CO2 was low and it was very cold….
https://news.google.com/newspapers?nid=1310&dat=19191212&id=nX0zAAAAIBAJ&sjid=2O8DAAAAIBAJ&pg=6180,2850947&hl=en
Decadal Climate Boundary Movement is in lower graph
http://www.sturmsoft.com/climate/suckling_mitchell_2000_fig2_3.gif
Köppen climate classification, ?widely used, vegetation-based empirical
climate classification system developed by German botanist-climatologist Wladimir Köppen.
Note that 1910 decade was almost as cold as the 1970s
this is such a great post !
so simple … a few words, 3 newspaper clips … but saying it all … (to every one who is able to read and wants to see …)
boy, did they have a freaky climate back then !