CRU Fraud – Making The Hiatus Disappear

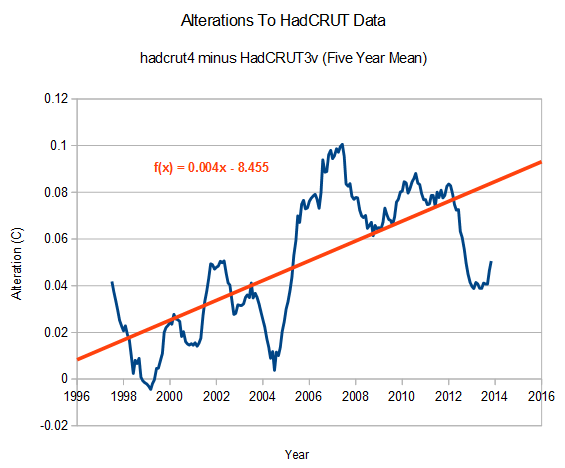
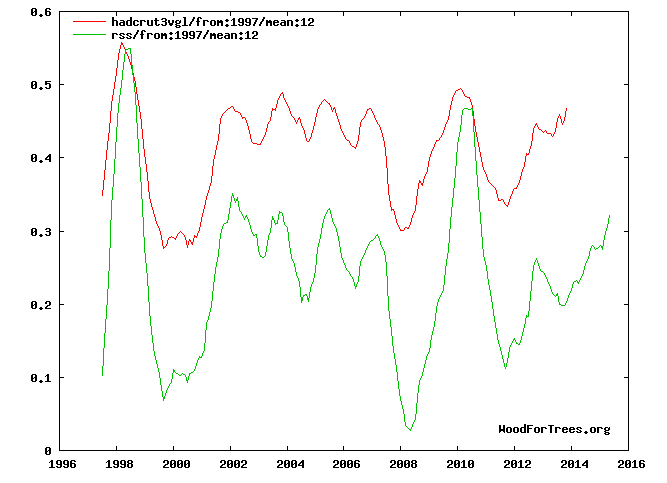
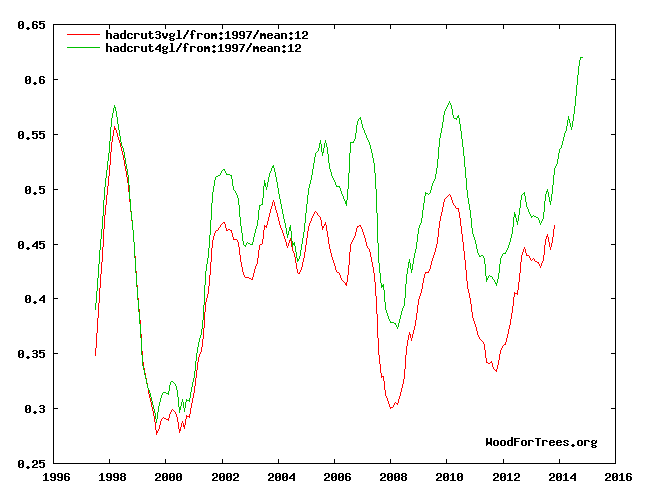
The Climatic Research Unit at the University of East Anglia used to show the “hiatus” very clearly. Then they talked it over with their fellow fraudsters at NOAA and NASA – and made the hiatus disappear by switching to a new version of their data.

2015-12-20-07-56-31

Wood for Trees: Interactive Graphs

If you remove their recent 0.1 degree data tampering, then 1998 becomes the hottest year – which agrees with satellites.

2015-12-20-07-54-14

Previously, CRU had excellent agreement with satellites about the hiatus. Satellites are supposed to show larger swings than surface data, but the trend was the same. Also note how satellite data shows much larger spikes during El Nino events, like 1998 and 2010.

2015-12-20-08-06-36

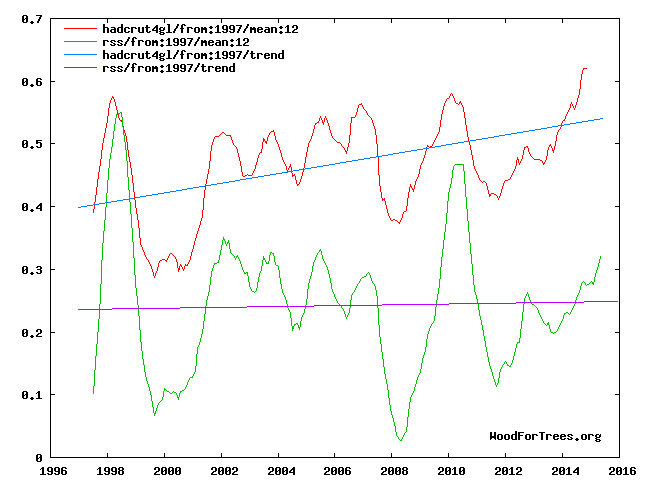
The new CRU data creates a warming trend where there is none. But the real smoking gun of fraud is the divergence with satellites during the current El Nino. They should be converging, not diverging.

2015-12-20-08-13-58

Wood for Trees: Interactive Graphs

About Tony Heller

Just having fun
This entry was posted in Uncategorized. Bookmark the permalink.

7 Responses to CRU Fraud – Making The Hiatus Disappear

  1. rah says:

    They can play with their numbers and even scrub away their data but their words are forever!
    http://theclimatescepticsparty.blogspot.com/2014/07/quotable-warming-hiatus-quotes.html

    Dr. Phil Jones – CRU emails – 5th July, 2005
    “The scientific community would come down on me in no uncertain terms if I said the world had cooled from 1998. OK it has but it is only 7 years of data and it isn’t statistically significant….”

    Dr. Phil Jones – CRU emails – 7th May, 2009
    ‘Bottom line: the ‘no upward trend’ has to continue for a total of 15 years before we get worried.’

    Dr. Phil Jones – BBC – 13th February 2010
    [Q] B – “Do you agree that from 1995 to the present there has been no statistically-significant global warming”
    [A] “Yes, but only just”.

    • Gail Combs says:

      The Climategate emails are worth a reread now and then.

      Tony will love this one!
      Climate gate e-mail 2729

      Email 2729
      The issue Ray alludes to is that in addition to the issue of many more drifters providing measurements over the last 5-10 years, the measurements are coming in from places where we didn’t have much ship data in the past. For much of the SH [Southern Hemisphere] between 40 and 60S the normals are mostly made up as there is very little ship data there.
      [Phil Jones]

      And they claim two decimal places????
      Climate gate e-mail 1650

      [Matthew Lazzara] this brings up a series of issues and concerns. First, to maintain these sites, there would be a need to perhaps visit the sites yearly, especially as some of the sites suffer from snow accumulation, altering the height of the sensors above the surface. (These comments are noted by George Weidner, co-PI of the AWS project) Unfortunately, we have not been able to service/visit all of these sites over the last several years. Next, the elevation of these stations to GSN status, and the need to perhaps visit them more often would require a commitment from the National Science Foundation and its supporting sub-contractors (RPSC, etc.) to commit to being able to have our group or partners visit these sites yearly – a goal that might not be realistic due to the demands on the US Antarctic Program logistics. Next, some of these stations are maintained jointly with us and by other national Antarctic programs, and in some cases, there are no formal memorandums of agreement or understanding in place that have the level of service or care that might be required for a GSN station. The selection of these stations over others has made us wonder why the following sites listed below were not considered: 89872 Univ. of Wi. ARGOS ID 8929 (Ferrell) 77.884 S 170.818 E 45 Meters 89376 Univ. of Wi. ARGOS ID 8911 (Gill) 79.985 S 178.611 W 55 Meters 89866 Univ. of Wi. ARGOS ID 8906 (Marble Point) 77.439 S 163.754 E 108 Meters These sites have a fairly long record, and Gill represents one of the coldest spots on the Ross Ice Shelf. This leads to the next series of points: some of stations on the list are not operating well at this time (Byrd Station), some sites may not be able to be visited again due to USAP’s logistic reach (Mount Siple), some sites have moved (SKI-HI is now SKI-BLU in a nearby location, Larsen Ice has moved inland some to stay inland of the retreating Larsen Ice Shelf C icefront), some sites do move on the Ross Ice Shelf over time (Lettau, Gill, Ferrell), knowing the elevation adequately (Mt. Siple, among others), some do not have a full “suite” of sensors, just the temperature and pressure (Mount Siple, Possession Island). In any case, I wish to make everyone on the AGG/AOPC aware of these issues, etc.

      Climate gate e-mail 0693

      Sorry for sounding a bit testy here. I’ve been fielding a whole raft of questions, comments, and criticisms from Mike Mann, Tom Crowley, and Malcolm Hughes. Some of them useful, many of them tiresome or besides the point. I never wanted to get involved in this quixotic game of producing the next great NH temperature reconstruction because of the professional politics and sensitivities involved…I should also say that the amount of ignorance about tree rings in the global change/paleo/modeling community is staggering given what has been published. Like it or not, they simply don’t read our papers.).

      This all reinforces my determination to leave this NH/global temperature reconstruction junk behind me once I get this paper submitted. It’s not worth the aggravation.
      [Ed Cook]

  2. Gail Combs says:

    The ‘Team’ was well aware that Mann’s hokey stick stunk. (And so was Mann)
    Climate gate e-mail 3555

    We actually eliminate records with negative correlations (this is mentioned breifly in the GRL article,), and we investigated a variety of weighting schemes to assure the basic robustness of the composite–but I certainly endorse your broader point here. Many of these records have some significant uncertainties or possible sources of bias, and this isn’t the place to get into that.  [Michael Mann]

    It was a majority decision to leave the Mann and Jones 2000-year series in the Figure 1 (as it was to remove the Briffa and Osborn tree-ring based one) , and the details of the logic used to derive the Mann and Jones series is to be found in the (cited) text of their paper. Signing on to this letter , in my mind. implies agreement with the text and not individual endorsement of all curves by each author. I too have expressed my concern to Phil (and Ray) over the logic that you leave all series you want in but just weight them according to some (sometimes low) correlation (in this case based on decadal values). I also believe some of the series that make up the Chinese record are dubious or obscure , but the same is true of other records Mann and Jones have used (e.g. how do you handle a series in New Zealand that has a -0.25 correlation?) . Further serious problems are still (see my and Tim’s Science comment on the Mann 1999 paper) lurking with the correction applied to the Western US tree-ring PC amplitude series used (and shown in Figure 2). There are problems (and limitations ) with ALL series used. At this stage , singling out individual records for added (and unavoidably cursory added description) is not practical. [Keith Briffa]

    More damning ClimateGate emails from Tim Osborne: They didn’t commit fraud, they just “applied a completely artificial adjustment to the data”
    Tim Barnett on the hockey stick- “statistics were suspect”–the rest of the team knew of problems with Mann’s reconstruction

    #4758 Tim Osborne – Criticizing other people for doing the same thing
    Because how can we be critical of Crowley for throwing out 40-years in the middle of his calibration, when we’re throwing out all post-1960 data ‘cos the MXD has a non-temperature signal in it, and also all pre-1881 or pre-1871 data ‘cos the temperature data may have a non-temperature signal in it! If we write the Holocene forum article then we’ll have to be critical or our paper as well as Crowley’s!

    Tiim Osborne [#4005–corrected from 4007 thanks to a commenter]
    Also we have applied a completely artificial adjustment to the data after 1960, so they look closer to observed temperatures than the tree-ring data actually were
    Tim Osborne #2347
    Also, we set all post-1960 values to missing in the MXD data set (due to decline), and the method will infill these, estimating them from the real temperatures – another way of “correcting” for the decline, though may be not defensible!

    This is from Dr Alley of the Greenland ice core temperature reconstruction. He seems more of a scientist and lest an activist than the rest.
    Climate gate e-mail 3234

    Despite assurances from Ed and Keith, I must admit that I still don’t get it. The NRC committee is looking at a number of issues, but the one that is most publicly noted is to determine whether, and with what confidence, we can say that recent temperatures have emerged from the band of natural variability over the last millennium or two. Millennial reconstructions with high time resolution are mostly tree-ring based, mostly northern hemisphere, and as I understand it, some are correlated to mean-annual temperatures and others to seasonal temperatures. The performance of the tree-ring paleothermometry is central. Taking the recent instrumental record and the tree-ring record and joining them yields a dramatic picture, with rather high confidence that recent times are anomalously warm. Taking strictly the tree-ring record and omitting the instrumental record yields a less-dramatic picture and a lower confidence that the recent temperatures are anomalous. When a big difference is evident between recent and a millennium ago, small errors don’t matter; the more similar they are, the more important become possible small issues regarding CO2 fertilization, nitrogen fertilization (or ozone inhibition on the other side…).
    Unless the “divergence problem” can be confidently ascribed to some cause that was not active a millennium ago, then the comparison between tree rings from a millennium ago and instrumental records from the last decades does not seem to be justified, and the confidence level in the anomalous nature of the recent warmth is lowered. This is further complicated by the possible small influence of CO2 fertilization…. I was just looking at some of the recent Mann et al. papers, and at the Osborn and Briffa paper from this year. In that one, as nearly as I can tell, there are 14 long records, of which 2 extend to 2000, 8 end in the early to mid 1990s, 1 in the early to mid 1980s, 2 in the early to mid 1970s, and one in the late 1940s. That looks to be a pretty small data set by the time you get into the strongest part of the instrumental warming. If some of the records, or some other records such as Rosanne’s new ones, show “divergence”, then I believe it casts doubt on the use of joined tree-ring/instrumental records, and I don’t believe that I have yet heard why this interpretation is wrong.
    I’m open to hearing what I have screwed up. Please note, I have no direct stake in this! I went to the meeting, I spoke, I’m done. But, I think you have a problem coming, that it involves the IPCC and particularly chapter 6 and paleo generally, that I really should let Susan know what is going on (if you’ve seen all the increasingly publicly disseminated emails, you know the story). I’d rather go back to teaching and research and raising money and advising students and all of that, but I’m trying to be helpful. Casting aspersions on Rosanne, on the NRC panel, or on me for that matter is not going to solve the underlying problem.
    [Richard Alley]

Leave a Reply

Your email address will not be published. Required fields are marked *