
Climate experts predicted that the Arctic would be ice-free no later than 2015.

Their prediction was not looking good until today – when the third spike of the last two months (up to -1C) melted the last remaining ice cube.
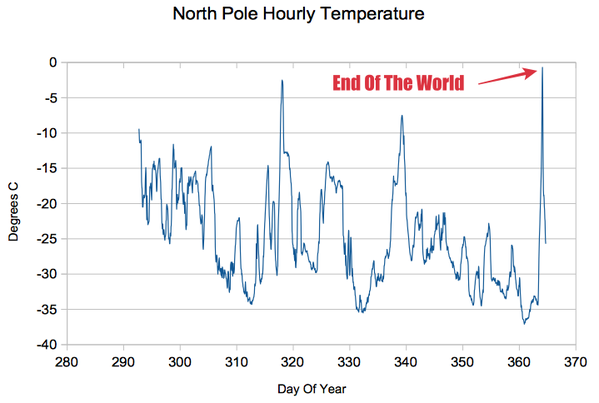
Fortunately, this disaster occurred after Christmas – and saved Santa Claus.
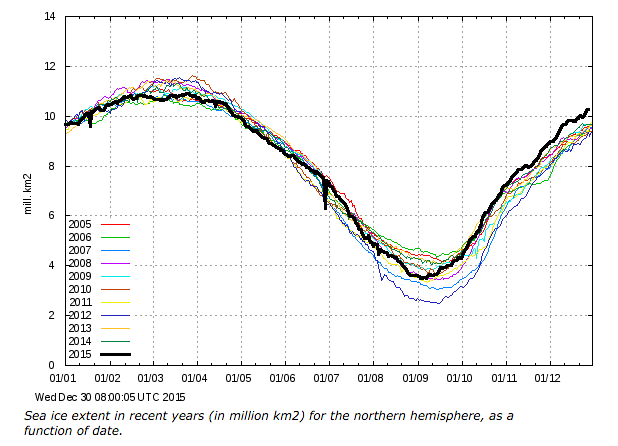
Earlier today, sea ice extent was at a 10 year high. But experts say it all melted during one hour at -1C this afternoon.

And check out the trend on that graph!
https://www.youtube.com/watch?v=_-pTAcdEYOA
Holy Cow! Was that a REAL Greenpeace ad? It is becoming more and more difficult to tell what is real and what is over-the-top parody. After the CAGW exploding school children ad, I have a hard time telling.
Wow! A calving glacier. That never happened before industry invented CO2.
The forecast high pressure over the Barents Sea.
http://earth.nullschool.net/#2016/01/05/0000Z/wind/surface/level/overlay=mean_sea_level_pressure/orthographic=-344.40,69.97,1024
Eskimo Hunters, 1949
I wonder if Greenies are ready to live like this, the greenest people ever? Very little fossil fuels. Hunt for your food. Animal skins for clothes. Raw meat, very few vegetables. Cold tundra.
https://youtu.be/b-XP30aG8bE
Nice video. This should be mandatory training for everyone who wants to ditch all fossil fuels and save the Arctic from supposed man-made global warming.
Thanks for the link—I watched it last night. I expected adversity but I also found very uplifting the matter-of-fact, contented and cheerful way the family members went about their hardscrabble daily life. I understand it was partially staged—it would be difficult for the cameraman to be at the right place and not a hindrance when the father shot the seal and the caribou. I’m also sure a subsistence hunter buying his own Winchester rounds would have taken a longer aim after bringing up his rifle or that it’s impossible to throw a haul-back line perfectly into the water every time as shown. And I assume they all enjoyed the attention and distraction this filming gave them in the monotonous winter life of their village. Nevertheless, there is nothing faux about the approach to life this film shows.
I think all schoolchildren should watch this documentary and not just for the reasons you listed. So should many parents.
https://www.youtube.com/watch?v=G9PyW259YWY
The WaPo says the near freezing recorded and/or modeled temperatures at/near the North Pole were 50 degrees above normal.
https://www.washingtonpost.com/news/capital-weather-gang/wp/2015/12/30/freak-storm-has-pushed-north-pole-to-freezing-point-50-degrees-above-normal/
A few days ago, Chihuahua, Mexico, had a foot of snow and temperatures near zero, or about 50 degrees below normal.
http://wattsupwiththat.com/2015/12/29/noaas-new-pauses-buster-sea-surface-temperature-data-the-curiosities-extend-into-the-1st-half-of-the-20th-century/#comment-2109372
Funny how nature likes to even things out, unlike our climate models that predict “tipping points”.
Not to mention Winter storm dumps record snow on South Plains – 7-10 feet in areas along the Texas/New Mexico border.
“During cooler climatic periods, however, the high-altitude winds are broken up into irregular cells by weaker and more plentiful pressure centers, causing formation of a “meridional circulation” pattern. These small, weak cells may stagnate over vast areas for many months, bringing unseasonably cold weather on one side and unseasonably warm weather on the other. Droughts and floods become more frequent and may alternate season to season,”
https://stevengoddard.wordpress.com/2014/09/17/in-1975-scientists-blamed-jet-stream-dips-on-global-cooling/
Thanks for the link. The comment continues
Thus, while the hemisphere as a whole is cooler, individual areas may alternately break temperature and precipitation records at both extremes. If global temperatures should fall even further, the effects could be considerably more drastic.
Depending on the amount of energy still stored on the oceans, due to the solar grand maximum of the XX century, we may see some abnormal localized high (and cold) temperatures, but with solar radiation declining this scenario will probably not last very long.
Probably not after 2017 world’s temperatures should stabilize with marked lower averages than now.
If this happens, this El Nino, and following La Nina, will define another step change in world’s temps- similar to the 1997-2001 event- this time breaking the “hiatus” towards a *lowering trend* worldwide.
The same jet stream bringing cold weather to Turkey.
http://cci-reanalyzer.org/DailySummary/
Mus, Erzurum, Van and surrounding areas in eastern Turkey face substantial snow as UNSEASONABLY cold air plunges southward from eastern Europe and a pair of storm systems arrive from the Mediterranean Sea.
http://www.accuweather.com/en/weather-news/biggest-snowstorm-so-far-eastern-turkey/54467733
Extreme weather is indicative not of ‘global warming’ but of a climate getting close to Glacial Inception where the earth flips from the warm phase to the cool phase.
And Guam will tip over, too:
https://www.youtube.com/watch?v=v7XXVLKWd3Q
GC is Correct…. usually lower temps involved with greater precipitation storms ect due to Gradient temp DIFFERENCES between NORMAL warmer tropical but COLDER polar areas air masses.
That was taught in Geo 101 as the cause of glaciation. I can remember the Prof. saying glaciation was not caused by really cold temperatures but by polar air masses colliding with warm tropical air masses and dropping tons of snow. If it is too cold you just do not get much snow. That is why Antarctica is a polar desert.
Glaciation also needs cool summers.
Hey, did y’all know that since in the 20th century, despite all the fabricated warming, that Greenland maintained 99.7% of its mass. How scary is that, hey !!!
http://wattsupwiththat.com/2015/12/30/greenland-retained-99-7-of-its-ice-mass-in-20th-century/
Looks like the “arctic sea ice recovery” has been cancelled? Is solar activity or perhaps UHI to blame?
How about natural variabilty? Or have you hit your head again, and forgotten that natural variability has never been disproven?
This does not look like natural variability, unless a change of regime can be called natural. LIA ended 150 years ago or thereabouts, what is causing the recent rapid Arctic warming? Perhaps it was the unproven tampering of US temperature records?
It looks perfectly natural. If you remove a block of ice from a freezer, does it stop melting after the first minute?
And let’s just put it out there again…
1- List all climate forcings, order them from most to least effectual, and then quantify them all.
2- Please provide even one peer reviewed paper that refutes natural variability as the cause of recent, or any, global climate changes.
There is nothing unusual or unprecedented about our climate, or how we got here. For 4,500,000,000 years climates have always changed, naturally. This means there has been a set precedent, and the burden of proof falls on natural climate change deniers like yourself.
Remember this from waaaay back?
cfgjd says:
December 9, 2015 at 3:27 pm
Submit to a Journal or it does not exist…simple rule.
So refutation of natural variability “does not exist”! 😆
I will mention that there are possible lunar causes too.
Paper: The influence of the lunar nodal cycle on Arctic climate
lunar papers in Geoscience World (Most are not on climate)
Up to and including the ~1500 year relative movement from the equator to the pole and back. SWAG department: link
QBO is a lunar-solar forced system (References two further papers)
and A Remarkable Lunar Paper and Numbers on Major Standstill
You know nothing about AMO, do you?
And its not as if he hasn’t been shown.
He just is either totally incompetent to understand, and/or suffering wilful ignorance.
LIA ended 150 years ago…
First they tell you the LIA ended in 1850….then when temps continued to climb at the same rate…
….they tell you it’s global warming
If we take nomalies relative to 1951-1980 unadjusted GHCN v2 means for Akureyri, Grimsey, Hofn Island, Teigarhorn, Reykjavik, Keflavik and Stykkisholmur, doesn’t matter which is which. (the black line is the 5-year average) we see the standard pattern of the AMO with the superimposed climb out of the LIA.
http://s19.postimg.org/45zuayng3/iceland.jpg
Enough newspaper articles exist to show a quite rapid decrease in Arctic sea ice around 1920-1940, and an increase from about 1945-1970. (a hunt back through SG’s posts will yield many)
As you can see there is a pronounced bulge in the temperatures in the 1930-1940’s.
I suspect that if we had accurate data for Arctic sea ice levels the pattern would be very close to an inverted version of the temperature graph.
But of course no “fabrication” by paid alarmista would ever show a big dip around the 1930-1940 time, because that would totally destroy the whole propaganda story.
“….LIA ended 150 years ago or thereabouts, what is causing the recent rapid Arctic warming?….”
>>>>>>>>>>>>>>>>
Hopefully, unlike Martin, you are willing to look at the peer-reviewed papers I am referencing.
So what could be a possible cause of the recent warm period since the LIA ended?
The Grand Solar Maximum, the highest activity in 3000 years. SEE: A History of Solar Activity over Millennia Usoskin et al. (2014) and reviews at the end.
The ignoring of the sun by the IPCC is shown in the paper Recent variability of the solar spectral irradiance and its impact on climate modelling (2013)
Ice cores from the Freemont Glacier show it went from Little Ice Age cold to Modern Warming warm in the ten years around 1850.
Dr. Evans Solar Notch-Delay Theory predicts a delay of about 11 years from a change in solar conditions to a change in earth climate.
So what happened around 1840? Solar Cycle 8.
It began in November 1833 with a smoothed sunspot number of 7.3 and ended in July 1843. Max sunspot number ~210. The prior Solar Cycle 7 began in May 1823 with a smoothed sunspot number of 0.1 and ended in November 1833. Max sunspot number ~105. And thus began the Grand Solar Maximum, highest in 3,000 years which has just ended.
http://www.solen.info/solar/cycles1_24.png
And in further news from Royal Astronomical Society (RAS):
“Solar activity predicted to fall 60% in 2030s, to ‘mini ice age’ levels: Sun driven by double dynamo.” ScienceDaily. ScienceDaily, 9 July 2015.
http://www.sciencedaily.com/releases/2015/07/150709092955.htm.
COMMENTS ON Usoskin et al. (2014)
A review of “A History of Solar Activity over Millennia” by Ilya G. Usoskin
Grand maxima of solar activity:
http://solarphysics.livingreviews.org/open?pubNo=lrsp-2008-3&page=articlesu16.html
What are you talking about? Isn’t water still frozen at 0C?
Looks like we will enter 2016 from a very low Arctic Sea Ice Area situation:
http://meteomodel.pl/klimat/arcticice.png
And yet we still have more ice in the Arctic than the average of the past 9000 years. Oh well, just weather.
How is the situation 9000 years ago relevant now that AGU has caused Arctic temperatures to skyrocket so that the polar vortex is getting hit? Remember the time when the arctic mostly stayed in the arctic and warm weather didn’t pummel the North Pole in the middle of winter? Me too.
If you cherry pick this most recent cool period, you can convince yourself that the current situation is special. it’s not.
I will see your 150 years and raise you 9000. Or you can just go on denying the climate history of our planet.
“How is the situation 9000 years ago relevant”
cfgjd, the claim by the CAGW adherents is that we are currently experiencing unusual, even unprecedented, climate change — change that is caused by human created CO2 additions to the atmosphere. If, in fact, what we are currently experiencing is neither unusual nor unprecedented , then what we are experiencing cannot be unusual nor unprecedented.
If someone claims that CO2 has turned them into a newt, when in fact they are NOT a newt, then CO2 is not a witch.
Please point me to the scientific paper where CO2 is “predicted” to cause a loopy jet stream.
Interesting that of the two available graphs at http://meteomodel.pl/BLOG/?page_id=10640
cfgjd picks that one** (Showing the most ‘decline’) instead of this one
NSIDC – zasi?g (extent) pokrywy lodowej Arktyki
(NSIDC – range (extent) of the Arctic ice cap)
http://meteomodel.pl/klimat/arcticice_nsidc.png
**that one = Cryosphere Today – powierzchnia (area) pokrywy lodowej Arktyki
(Cryosphere Today – area (area) of the Arctic ice cap)
(And yes the language is Polish)
“Earlier today, sea ice extent was at a 10 year high. But experts say it all melted during one hour at -1C this afternoon.”
What I want to know is why should anyone care about the ice? It is all floating and so can’t raise sea level any. Why should we care if it melts in the summer? What difference would it really make?
If all the ice at the north pole melted, then the alarmists would see that it is no big deal. (well maybe not the religious alarmists)
I understand that the north pole has been ice free in the past and life on the planet survived that situation just fine. Why not now? Are we that much more fragile than life forms of the past?
Ice disappearing during summer would be a huge environmental change. Of course this is expected to happen sooner or later on a warming planet.
A “huge environmental change”?? How so? And even if it were a “huge environmental change”, that does not make if bad. Warm is good, and cold is bad. Give me a lot more warming anytime.
We were promised warmer nights and warm near the poles if there really was any “global warming”. What is bad about that?
If ice-cover the size of the US disappears in just a few decades does it not fit the category of “huge environmental change”? I think any reasonable person would agree it does.
The loss of sea ice will of course change large-scale weather patterns, which has already started.
If ice sheets covering much of the US disappeared, does that not fit the category of “huge environmental change”? I think any reasonable person would agree it did.
The loss continental glaciers changed large-scale weather patterns, which has already happened.
It’s called “nature”, and it isn’t static.
The Arctic at some distant past was warm enough to support the organic material that was eventually transformed into oil and gas.
Naturally!
The Arctic has been ice free in the recent past. Life isn’t static and the earth certainly isn’t. We are just lucky enough to be in an essentially unchanging climate during a not very erratic interglacial. Actually the Holocene has been a remarkably stable interglacial. The last four before the Holocene were hotter spike and then back to the icebox.
http://www.brighton73.freeserve.co.uk/gw/paleo/400000yearslarge.gif
It also shows CO2 climbing AFTER the temperature no doubt because the warming oceans released CO2.
Here are your peer-reviewed papers.
Ice free Arctic Ocean, an Early Holocene analogue
Temperature and precipitation history of the Arctic
And in Norway new research shows the glaciers had all melted away and have only reformed 600 years ago.
A new approach for reconstructing glacier variability based on lake sediments recording input from more than one glacier January 2012
I occurs to me that the Elite who own the media, the world economy and our governments are using FEAR to manipulate the Alarmist followers. Unfortunately they FEAR the wrong thing.
As the 1974 CIA report noted it is COOLING that is the real fear not to mention the totalitarians who want to ‘Fundamentally Transform Civilization’ to better fit THEIR needs and not ours. The fact they are letting us know this is a real concern BTW.
The 1974 CIA Report
“A Study of Climatological Research as it Pertains to Intelligence Problems”
http://www.climatemonitor.it/wp-content/uploads/2009/12/1974.pdf
As usual, Gail, I 100% agree with you.
We really don’t know when exactly the next glacial inception will happen, but it’s obviously “knocking at the door” already.
I’m firmly convinced that people will stop talking about AGW until the end of this decade.
The present ENSO could bring another step-change in world’s climate.
Dmh,
It doesn’t even have to be glacial inception. Whether the Holocene will end at half precession or follow a similar pattern as MIS11 is hotly debated although the recent evidence is leaning toward glacial inception.
What does matter is the earth will in either case be near glacial inception and the earth will see the roller coaster climate that was seen between the two MIS11 peaks. The ‘Climatic Madhouse’
That is why the Alarmists would be falling down laughing funny if it weren’t for the fact they are succeeding in changing our economic model.
Gator what is your criteria for deciding whether something fits inside “natural variability” or not?
4,500,000,000 years of set precedences. The set precedences you deny.
Paper please!
Why so many years? Sounds frankly idiotic, and a way to deny even the possibility of detecting any man-made change. Come up with something defensible please.
ps. if the thousands of climate skeptics produce on average one poster total per year, how many years does it take to publish all natural cycles? Or are natural cycles like gods that can be used ad hoc to explain any possible event?
Yes, I know, to you science and logic are idiotic.
Paper please!
NEVER ask a geologist what is a precedence if you are expecting something less than say a few decades. Unfortunately cfgjd, there are a lot of geologists or those with geology minors on this blog. We tend to think of climate in terms of millennia or more.
http://jonova.s3.amazonaws.com/graphs/lappi/Five_Myr_Climate_Change_Rev.jpg
I had been a geology student for about 7 years when I took my first climatology class, and was immediately struck by the “Young Earth” attitude of my climatology professsor. As a geology student I was taught that the Earth is a dynamic and ever changing venue, whereas my climatolgy professor seemed to think that the Earth should be static. Weird.
“…the Earth should be static. Weird.”
Yes very weird. I have no where near your extensive background but only a fool or an insulated city type would not have an understanding that the earth is a dynamic system and a heck of a lot tougher and stronger than we puny humans are.
This is a really interesting illustration that you probably already know about.
The Ghost Forest
Amagnitude 9.0 earthquake rocked the Washington coast off Grays Harbor, causing the land to instantly drop in elevation by up to 6 feet around the region.
Cascadia Earthquake of 1700
Any bets on which will happen first?
1. Another big earthquake and California follows the Ghost forest into the ocean
2.The N.Korans or Iran lob a nuke into Yellowstone and set off a mega-volcano?
https://media2.stickersmalin.com/produit/100/stickers-devil-smile-R1-143760-2.png
“If ice sheets covering much of the US disappeared, does that not fit the category of “huge environmental change”? I think any reasonable person would agree it did.”
Of course. That took many thousands of years, naturally.
And we should be thankful that the Earth warmed, naturally.
Paper please!
How come the skeptic community produced one measly poster for AGU? Are you guys like creationists, not producing any science but still thinking you are terribly scientific in your opposition of science? LULZ
Paper please!
How come alarmist are ignorant of hundreds of papers supported by literally thousands of experiments and real world observations that make any rational person skeptical of CAGW?
Even when repeatedly shown links to peer reviewed research, they go on blindly aserting it’s non-existence.
Do you read the posts of, for example, Gail Combs in this blog?
Do you think you can understand her posts?
And you have produce no science, EVER…….NOTHING, NADA… ZIP. !
Is it ineptitude, or base-level ignorance on your behalf.. or both.
Because the AGU is now infested with Alarmists to the point they are deleting non-alarmist papers from their website.
If you want the skeptic papers then you go HERE.
When a group of people are vilified and ostracized they will form a new group and start ignoring the corrupt groups. That is what I see happening today. Even Nobel SCIENCE prize winers are walking away from the corrupted organizations.
If Climate Change always takes thousands of years…. (it doesn’t, that’s a myth) why are there flash frozen wooly mammoths in the fossil record?
Hey Dave! That whole “flash frozen wooly mammoths” things is one of the most wonderful puzzles. Personally, I am leaning more and more to the catastrophic, comet-strike-to-the-Arctic-Ice-Cap theory. Certainly, whatever the cause of the flash freezing was, it is difficult to ascribe it to any common occurrence.
I sometimes consider the possibility of a long lasting Polar Vortex.
If it lasts for, say, “months” instead of “few days” as it usually does, it could easily cause the “flash frozen wooly mammoths” type of phenomena and probably also glacial inception.
I don’t know if it’s possible, though.
And why are there tree stumps under retreating glaciers. 🙂
And why did Dr Alley say he saw evidence in the Greenland Ice core that the climate switched from the Wisconsin Ice Age to the Holocene IN ONE YEAR!!!
John D. Cox,— Climate Crash: Abrupt Climate Change and What it Means for our Future (John Henry Press, an imprint of the National Academies Press, ISBN: 0-309-54565-X, 224 pages, 2005)
Notice the description of the “Dust in the windy ice age atmosphere… a completely new state“
Summer , Winter.
CF – Of course. That took many thousands of years, naturally.
http://ipcc.ch/ipccreports/far/wg_I/ipcc_far_wg_I_chapter_07.pdf
Page 224. N. Hemisphere snow extent was still going up through 1978 -. Fig 7.19: Was that before you were born, because I was not 1,000’s of years old upon graduation from high school.
1973 & 1974 Arctic Ice extent was 700,000 km^2 below the 1998 Average.
Sea Ice – 1973-1990 https://stevengoddard.files.wordpress.com/2015/12/screenshot-2015-12-29-at-11-10-12-pm.png
Changes and fluctuations in Arctic sea ice extent have been analysed by Mysak and Manak (1989); they find no long term trends in sea-ice extent between 1953 and 1984 in a number of Arctic ocean regions but substantial decadal time scale variability was evident in the Atlantic sector. These variations were found to be consistent with the development, movement and decay of the “Great Salinity Anomaly” noted in Section 7.7.
Sea-ice conditions are now reported regularly in marine synoptic observations, as well as by special reconnaissance flights, and coastal radar. Especially importantly, satellite observations have been used to map sea-ice extent routinely since the early 1970s. The American Navy Joint Ice Center has produced weekly charts which have been digitised by NOAA. These data are summarized in Figure 7.20 which is based on analyses carried out on a 1° latitude x 2.5° longitude grid. Sea-ice is defined to be present when its concentration exceeds 10% (Ropelewski, 1983). Since about 1976 the areal extent of sea-ice in the Northern Hemisphere has varied about a constant climatological level but in 1972-1975 sea-ice extent was significantly less.
About where we are now.
http://arctic.atmos.uiuc.edu/cryosphere/IMAGES/seaice.anomaly.arctic.png
IPCC so you know it is true and peer reviewed. For your viewing pleasure.
Gator is trying to use the “if you do not know everything you cannot know anything”-fallacy. I guess that helps you with dealing with the real issues. A fragile soul perhaps.
Yeah, logic sucks.
Who was it that said that if something is not found in the peer reviewed literature it does not exist?
Paper please!
Paper listing everything that can be known about the climate system does not exist, and will never exist. How is that evidence for anything?
Skeptics have not made a good case that all that has happened since 1950 is “natural variability”. Perhaps the case is made in a poster in 2016? Fingers crossed…
Skeptics are not claiming a new mechanism for climate change, so we have nothing to prove. Logic dictates that the new hypothesis is moot until natural variability is ruled out. If I claim the ice in my freezer is made by elves, and not my icemaker, I need to first prove the icemaker in my fridge does not exist.
If you want to believe in elves, great! Just don’t ask me to support them with my tax dollars.
They certainly have made a excellent observation based case that climate senstivity is well below 1.5 degrees, and largely net beneficial. Google NIPCC, and begin your PhD peer reviewed education.
Over 20 such papers support this lower senstivity. Hundreds of papers support the overall assertion.
CF, actually, when the benefits side of peer review is considered, thousands of papers based on real world observations and in-field studies, support the skeptics.
What accounts for the warming from 1910 to 1940… or did that get erased in Revision 456,654?
David A
Not only have the skeptics produced those papers, they have also taken the basic climate model apart, rebuild it after correcting the flaws and the new basic model gives a CO2 sensitivity in line with the empirical evidence.
Climate Scientists Misapplied Basic Physics. A mistake in climate model architecture changes everything.
It sounds to me like he is saying that within the current interglacial nothing outside of normal weather patterns has happened. Virtually 100percent of the “unprecedented” claims, are shown to be false within the last 100 years.
Please show me your list of unprecedented weather events if you think it exists.
Look at the reconstructed Arctic temperatures and sea ice extent since about 1900. There was no period when the sea ice was even nearly as decimated as now.
I said show me. Only an insane propaganda promoter would base 100 years of history on thirty Years of favorable ENSO cycles.
The early satellite record shows much lower sea ice. 1979 is a huge cherry pick, ignoring the peak of the ice age scare it is based on. Many studies indicate arctic icel loss flux, comparable to today from the1940s.
In addition the polar seesaw is a well known observation, demonstrating GLOBAL sea ice to be about normal.
That is a reconstruction is an alarmista fabrication DELIBERATELY leaving out the dip around 1930-1940.
There are many papers and reports showing decreasing Arctic sea ice in the 1920-140 period.. but that would just destroy the whole Arctic sea ice HYPE wouldn’t it.
And you still totally ignore the fact that for the first 3/4 of the Holocene, summer Arctic sea ice levels were quite often ZERO. Again.. wilful ignorance of facts is your MO.
The current level is actually anomalously HIGH because we are only just out of the COLDEST period in the last 10,000 years.
Turn this graph upside down, and you would almost certainly get a pattern closer to reality than that crap propaganda fabrication you are forced to rely on.
http://s19.postimg.org/45zuayng3/iceland.jpg
Look at the reconstructed Arctic temperatures and sea ice extent since about 1900. There was no period when the sea ice was even nearly as decimated as now.
https://stevengoddard.files.wordpress.com/2012/04/screenhunter_707-apr-25-06-06.jpg?w=640&h=491&h=491
that’s odd…wordpress blocks Tony’s graph on his own blog
let’s try this one…
https://wryheat.files.wordpress.com/2014/02/sea-ice-anomaly-1975-1990.jpg
Lat, its the stuff after the .jpg that stuffs things up.
trying again
https://stevengoddard.files.wordpress.com/2012/04/screenhunter_707-apr-25-06-06.jpg
Thanks Andy!…I erased like you said…..worked!!
Let’s have a look at that temperature graph, inverted and with GISS/GHCN V3/Tom Wigley style “adjustments™” done on the “inconvenient peak™”
http://s19.postimg.org/59jymx837/Iceland_adjusted.jpg
Amazing how similar it is to the one cfool relies on. 😉
you know it’s all linear….they are really not “computing” anything
Is the “if you do not know everything you cannot know anything”-fallacy similar to the “if you don’t agree with me and 97% of my closed friends you are wrong”-fallacy?
Sorry, “closest friends.”
closed-minded friends 😉
“How come alarmist are ignorant of hundreds of papers supported by literally thousands of experiments and real world observations that make any rational person skeptical of CAGW?”
Sounds like that’s about 1% of all relevant papers and experiments, if even true.
Really? Logic does elude you, but you can still type. Most CAGW papers have 0 to do with atmospheric physics. Intead a circle jerk of Grant grubbing enviromentsl study yahoos study the harm caused by a drought here, or a flood there and then, based on falsified climat models, that project more heat cold etc, in the future, they publish a ragabout frogs getting bigger, or smaller, or polar bears drowning, or bees dying etc, etc. This is not hyperbole, but thousands of such nonsense papers are published with billions of dollars of agenda driven anti-science.
In addition truth is not established, except in an idiots mind, by the number of papers published. Truth is established by real world observations, and cause papers based on those observations, not atribution papers based on failed climate models.
It’s too bad none of the Earth Science communities hasn’t been convinced by the very scarce skeptic papers that AGW does not exist.
https://en.wikipedia.org/wiki/Earth_science#Partial_list_of_the_major_earth_science_topics
Most be a major conspiracy then. Way bigger than the Moon Landing Hoax, wow.
It’s too bad none of science journals have published any papers proving that NV does not drive all climate changes.
https://www.google.com/search?site=&source=hp&ei=P1KFVvyqIM-OjwO8zpjABw&q=null+hypothesis&oq=null+hypothesis&gs_l=mobile-gws-hp.3..0i131j0l4.121.5122.0.5854.15.13.0.5.5.0.1315.7046.4-1j1j2j4.8.0….0…1c.1.64.mobile-gws-hp..9.6.1467.n3MjrIlOJl8
Most be a major conspiracy then. Way bigger than the Moon Landing Hoax, wow.
Actually that is another falsehood. Here is your original 97% ‘survey’
https://wattsupwiththat.files.wordpress.com/2012/07/98_percent_climate_scientists_graph.png
Did you get that???
SENT: 10,257
REPLIED:3,146
Didn’t get the right answer so choose subset
CLIMATE SCIENTISTS: 77
Answered YES: 75
Here is that survey as it appeared in EOS:
AND they have the unmitigated gall to call those SEVENTY SEVEN cherry picked scientists “..an unbiased survey of a large and broad group of Earth scientists.”
And you wonder why we think ClimAstrologists are lying bags of porcine feces?
Just maybe because they have PROVED that they will lie!
That Scientific Global Warming Consensus…Not! – Forbes
Let’s do a survey of the world’s religious leaders to find out whether they approve of drug use. Of those who reply, we will then throw out all except the ones who are practicing Rastafarians…
Gail, it should always be noted the type of ‘Earth Scientist’ it was sent to and what they were asked..
Doran and Kendall Zimmerman, 2009 – http://tigger.uic.edu/~pdoran/012009_Doran_final.pdf
An invitation to participate in the survey was sent to 10,257 Earth scientists. The database was built from Keane and Martinez [2007], which lists all geosciences faculty at reporting academic institutions, along with researchers at state geologic surveys associated with local Universities, and researchers at U.S. federal research facilities (e.g., U.S. Geological Survey, NASA, and NOAA (U.S. National Oceanic and Atmospheric Administration) facilities; U.S. Department of Energy national laboratories; (and so forth). [Note only government scientist, private sector need not apply]
This brief report addresses the two primary questions of the survey
With 3146 individuals completing.
In our survey, the most specialized and knowledgeable respondents (with regard to climate change) are those who listed climate science as their area of expertise and who also have published more than 50% of their recent peer-reviewed papers on the subject of climate change (79 individuals in total). Of these specialists, 96.2% (76 of 79) answered “risen” to question 1 and 97.4% (75 of 77) answered yes to question 2.
CF, it is hard to convince someone who’s livelihood depends on not being convinced.
I was at Scrpps Institute of Oceaography, thoroughly thrashing a PHD student in a debate about CAGW.
Finally he liked at me and said, partly as a confession, partly in fear and anger mixed, ” my family depends on this”. I nodded and told him our debate was over. 2004
What is the salinity of alarmist tears and at what temperature do they freeze?
Here’s a graph of historical Arctic sea ice extent:
https://tamino.files.wordpress.com/2010/10/polyakfig2.jpg
…modern extent s exceptionally low. Also, before the start of the graph we were recovering from the Little Ice Age…who believes Arctic sea ice was almost gone back then?
Interesting that Amundsen managed to sail his boat through the NW passage in 1906 with the ice extent so much higher than your graph shows for the more recent period when it was blocked.
The graph contains ship data so his observations might be included in it. Of course error-bars are larger in the past but present-day low extents can be ruled out.
Also known as “my graph is useless as any sort of historical reference”.
Your graph shows that he sailed his boat through the passage on a year that had as much ice as the “modern maximum” (1979).
I’m calling bullshit.
What error bars?
There is currently more ice in the Arctic than the average of the past 9000 years. Why would you cherry pick the LIA, the coldest point of the interglacial? Desperate much? 😆
Where did the graph originate? How was it made?
“It’s too bad none of science journals have published any papers proving that NV does not drive all climate changes.”
How would you prove that? Are models allowed? Where are the skeptic Earth System Models BTW? Can we expect a poster in AGU 2020 shedding some light on this? 😀
“…Where are the skeptic Earth System Models BTW? ….”
They are right here:
The Alternative Basic Climate Model. (for CO2)
Notch-delay solar theory
And yes you are talking two brand new papers.
About the Author
What is more there is a PREDICTION not a wiggle out of PROJECTION.
Great, where are the papers?
20 page synopsis (light on the equations.)
Disproving NV is not my problem, it is your problem and a big one at that. I know you idiots don’t like facts, and dismiss the scientific method whenever it is inconvenient for you. You move goalposts and cherry pick to try and support your unsupportable claims.
Remember fool, you said if it is not in the peer reviewed literature it does not exist, ergo refutation of NV does not exist, and is the logical answer. You could grow two more arms and double your hand waving, but that still will not make the Null Hypothesis go away.
Paper please!
“Your graph shows that he sailed his boat through the passage on a year that had as much ice as the “modern maximum” (1979).
I’m calling bullshit.”
Check the history, it took Amundsen THREE YEARS to make the passage.
He only sailed through in 1905 as he was finished mapping and making scientific observations, it is recorded in his journal that he could have sailed through in 1904 but decided to wait until 1905 as he was not finished with his scientific observations.
Sorry, I made a mistake saying 1906, it was 1905 that he sailed through.
He could not have known that sailing through would have been possible in 1904 as the route can be blocked in so many places.
Beats me, I didn’t write his journal. Now you are calling one of the worlds foremost Arctic explorers a liar.
Sorry again, I should know better than to check Wikianydamnthing for dates, I was right the first time on 1906.
His wasn’t the only boat up there…..there were plenty of other people along the way to tell him if it was open or not
Yes, and in those 3 years, the NWP was open enough for his to get through in a small wooden boat..
Most recent passages have required the assistance of nuclear powered ice-breakers.
Rather OT, but Tasmania’s reliance on hydro could come back to bite them hard.
http://www.abc.net.au/news/2015-12-22/cable-fault-leaves-tasmania-unable-to-import-power/7047876
http://www.abc.net.au/news/2015-11-15/concerns-over-tasmania-hydro-output-follow-dry-forecast/6942438
http://www.abc.net.au/news/2015-12-11/workers-return-to-fire-up-tamar-valley-power-station/7021122
It will be interesting to see if they can repair BassLink before the hydro dams run out of usable supply.
Perhaps it is time to round up all the Alarmists, ESPECIALLY the academic and journalist Alarmists and ship them to Tasmania and forget about repairing BassLink. No exodus allowed and the only imports allowed are solar panels and wind turbines.
I wanted to put thes together so I could look at them.
AndyG’s Graph with temperature*** graph, inverted and with GISS/GHCN V3/Tom Wigley style “adjustments™” done on the “inconvenient peak™” [It would be good to remove at least part of the 1940s blip, but we are still left with “why the blip”]
https://i2.wp.com/s19.postimg.org/59jymx837/Iceland_adjusted.jpg
cfgjd …. Tamino’s graph of Arctic sea ice extent
https://tamino.files.wordpress.com/2010/10/polyakfig2.jpg
*** GHCN v2 means for Akureyri, Grimsey, Hofn Island, Teigarhorn, Reykjavik, Keflavik and Stykkisholmur, doesn’t matter which is which. (the black line is the 5-year average) we see the standard pattern of the AMO with the superimposed climb out of the LIA.
Thanks Gail..
Having three or four posts strung together with an explanation….
This may be just enough to overcome his very short concentration span…
Although its still probably waaaaay too much for his very limited comprehension skills.
An interesting read..
http://mclean.ch/climate/Arctic_1920_40.htm
And a similar one about Greenland.
http://www.sciencedaily.com/releases/2007/12/071210094332.htm
And another
http://met.no/Forskning/Publikasjoner/filestore/Ealat_Yamal_climaterep_dvs-1.pdf
“All series show warm periods in the 1940s and 1990s, and a cold period in the 1960s. Salekard (the only station with observations at that time) was cold also around 1900.”
Page 40 summary and conclusions:
1. Increasing temperatures from 1900 to the mid-1940s (often referred to as the “early 20th century warming”).
2. Decreasing temperatures from the mid-1940s until about the mid-1960s.
3. A “recent warming” from the 1960s to 2003.
And Hubert Lamb’s ‘Climate History and the Modern World’ (originally published 1982 using material collated during the previous decade) notes ‘ (my capital letters) …from around the beginning of the century up to 1940 a substantial climate change was in progress, average temperatures were rising, MOST OF ALL IN THE ARCTIC WHERE THE SEA ICE WAS RECEDING…the almost four and a half decades of near immunity to very cold winters ended abruptly with Europe’s notably severe war winters in 1940, 41 and 42 and another in 1947.’
Page 259 comments ‘…warming was rapid from about 1920 to 1940 …it was during the second and third decades of the (20th) century that the climatic warming became noticeable to everybody, places near the arctic fringe such as Iceland, Spitsbergen and even Toronto experienced warming that was from twice to five times as great… THE AVERAGE TOTAL AREAS OF THE ARCTIC SEA ICE SEEMS TO HAVE DECLINED BY ABOUT BETWEEN 10 AND 20% ….
———————————————–
None of this shows up in the alarmista Arctic sea ice propaganda farce of a graph that cfool is citing.
What do you expect from Tamino, Mikey Mann’s Bulldog?
Another interesting graph.. AMO !!!
http://www.drroyspencer.com/wp-content/uploads/AO-DJF-cumulative-since-1900.png
Oh and look. basically flat since about 2008… just as the AMO turns over the top.
http://arctic.atmos.uiuc.edu/cryosphere/IMAGES/seaice.anomaly.arctic.png
Over the next few years, it will be hilarious to watch the antics of the Arctic alarmista bletheren. 🙂
Run and hide, little worms. 🙂
These alarmists simply refuse to learn a thing. I guess that is what earns the title, “troll”.
“It is difficult to get a man to understand something, when his salary depends on his not understanding it.” —- Upton Sinclair
http://gelbspanfiles.com/wp-content/uploads/2015/05/La-la-la-300×274.jpg
Note that the Arctic sea ice graph cfgjd links to is from a Polish website having to do with computer modeling.