
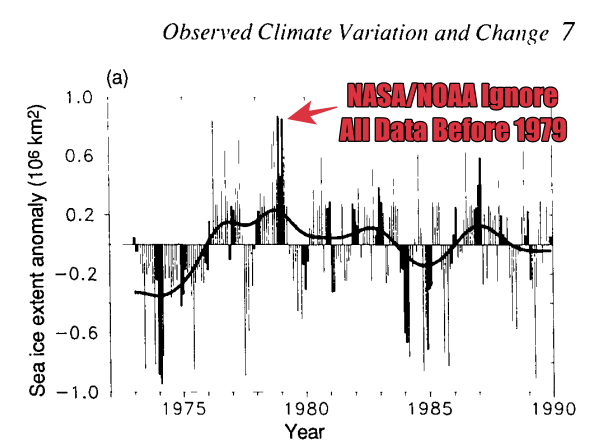
One thing a scientist should never ever do – is start calculating a sought after trend at a minimum or maximum. Like 1979.
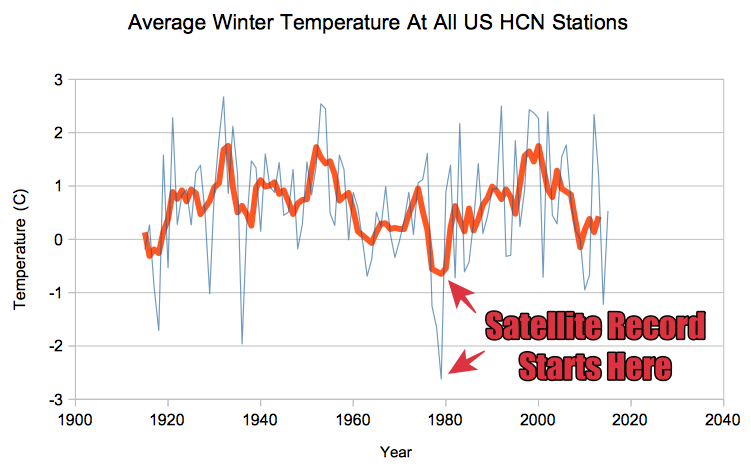
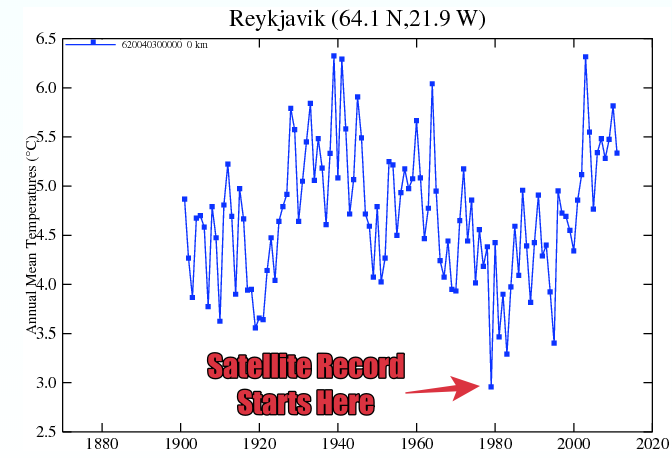
On the other hand, if you were a global warming propagandist instead of a scientist, you would start in 1979, and ignore all prior data.
If a scientist did this, they might just get accused of being a crook.
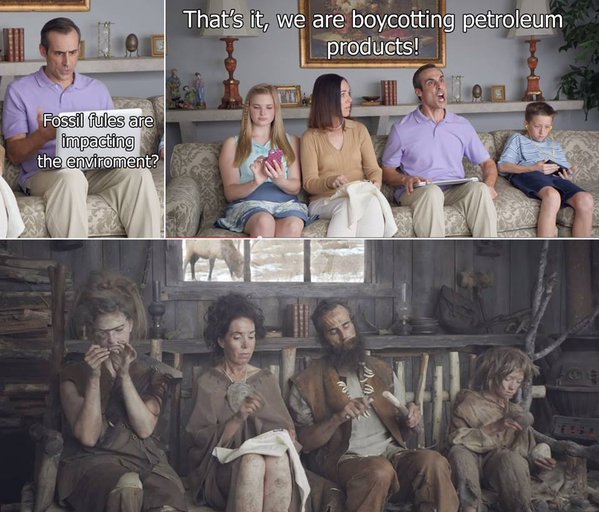

That picture composite is a classic! Says it all! 🙂
It is a great illustration of my comment from yesterday HERE.
I love the kid knapping flint.
Looks like Dad is whittling a handle for the implement the kid is making out of stone.
I can’t tell at this resolution but is that a huge abscess where the daughter’s right eye should be? I wonder if they didn’t make it to the shaman on time and if they did if it was covered under their Obamacare policy.
Colorado it is an eye patch. You can see the black string across where the eyebrows are and headed behind her ears.
She is trying to thread a needle.
Thanks, I can see it on my desktop now. So yes, the shaman couldn’t or wouldn’t help. I hope her eye socket has healed by now.
The normal Schwabe sun cycle is 10.66 years. That is the minimum and maximum amount of years you must use to establish a trend.
However, the Schwabe sun cycle is really one-half phase of the full Sun cycle, note that the full sun cycle has been named a Hale-Nicholson.
quote
In 1908 G. E. Hale established that spectrum lines of sunspots exhibited the Zeeman effect and thereby proved the existence of a strong magnetic effect. In 1925 Hale and Seth Nicholson reported the laws of sunspot polarities that the magnetic polarity in Southern solar hemisphere spot groups is the opposite of that in the North. In addition, in 1937,Nicholson pointed out that at the end of each 11-year period of rising and falling numbers, the polarity of spot groups reverses. Thus, at the end of 22 years, sunspot polarities on both hemispheres of the sun had alternated through one complete full wave of positive and negative polarity. He proved his point by equating sunspot group polarity with particular cycles of observation
end quote
so I figured out now, that the best way to look at the temperatures and rainfall & weather is in multiples of 22 years. like here,
https://i0.wp.com/oi62.tinypic.com/33kd6k2.jpg
we are looking at about 2 Hale Nicholson cycles, which is about one half of the 87 year Gleissberg.
If all goes well then – looking at the solar magnetic field data, in the next 43 years, the speed of cooling must reverse back to warming, and the apparent current parabola must become a hyperbole.
it is amazing how nature works.
isn’t it?
“it is amazing how nature works.
isn’t it?”
Even more amazing that man is arrogant enough to think he can ‘control’ nature.
true, very true.
He thinks he can change the weather…….
lol
the wind blows where it wants…..
isn’t that what Jesus said.
cannot remember now where and when.
Yet Henry, that is one influence, but certainly how ocens, as a GHL for S/W radiation process solar insulation sets up noticeable 60 year ENSO cycles, sometimes in phase with solar and other factors, sometimes countering each other.
My waves for the drop in maximum and minimum temperatures obviously does not reflect exactly at the same time what happens to temperatures on earth. Earth has an intricate way of storing energy in the oceans. There is also earth’s own volcanic action, lunar interaction (mixing of warm and cooler waters), the turning of Earth’s inner iron core, electromagnetic force changes, etc.
When I realized all the variables, including the incoming and outgoing E, I stopped looking at means for the day.
So, I remain true to the KISS principle
keep it straight and simple
I only look at the change in the rate of max. T and min T.
which I find I can correlate with the sun’s magnetic fields, ozone, planets’ movements, past investigations (Gleisberg, William Arnold, Jospeh, etc)
My reasoning is that at the end of the day, the Sun rules.
Unless there is some drastic volcanic action, eventually, earth cannot put out more energy then it gets in…..
So those cycles that you mention are also valid, but I say they are still subject to what happens on the sun.
Henri P and David A what you are saying is pure heresy
in the eyes of the Algorean Church.
You should be burned at the stake!!!!
( sh*t ,that’ll produce CO2)
Steven, your claims are false. NASA and NOAA do not ignore any data before 1979. You have simply published a bald lie. First, you used the average winter temperature for a small subset of US stations to represent the global average temperature. You are trying to deceive your readers. Second, you used the temperature in one location in Iceland to again represent global average temperature. You can’t do that. You are trying to deceive your readers. And third, you then claim NASA and NOAA have ignored all data before 1979. That is a lie, and you know it.
I usually do not comment, but this is just too much. It is not about global mean temperature. It is about (un)etic work done by the scientific community. You do not cherry pick in science, but regarding the Arctic, that is exactly what has been done as pointed out by Tony. As a former member of the Royal Institute of Technology (KTH) college board in Stockholm, this kind of behavour makes me feel sick…
No, Morgan, Steven did not point out any “(un)etic work” (sic). He deceived you. Successfully, it appears.
He did point it out, but too subtle for you to grasp obviously.
Morgan, the point you are imagining can’t be made with the data Steven used. When you use the correct data, which must be global data, your alleged point vanishes. If you still claim Steven made a point about NASA and NOAA, then prove it by showing what they did wrong. What claim made by NASA or NOAA has Steven proved wrong?
Steven Goddard has pointed out the 1979 cherry pick numrous times.
Understanding The 1979 Arctic Ice Cherry Pick
Starting Graphs In 1979 – World Class Fraud
NSIDC : Pretending That The Satellite Era Began in 1979
https://stevengoddard.files.wordpress.com/2012/04/screenhunter_707-apr-25-06-06.jpg
Marty’s only goal is to call Steven goddard a liar.
When pressed he regurgitated all the Climate Alarmist talking points all of which have been refuted by emphrical scientific studies. However he ignores ‘sciency stuff’ (peer-reviewed papers) posted to show where he is wrong and calls it ‘bloviating’ When pressed he only links to SkS or the Connellated Wiki
The point Morgan makes is the one that governs the warming-alarmist’s messages of fear. Even casual note of most propaganda that they feed to the willingly gullible media should make it obvious that they more often than not carefully select the time periods for the data that will support whatever it is they want you to think that they have “proved”. Disgusting!!!!
Certainly starting the data at a cherry picked date to guarantee the trend line you want is really, really bad statistics. Only a fool or the totally uneducated would argue with that. (cue a certain local troll)
But it is worse than even that. A temperature trend upwards does not prove CO2 driven global warming. Anyone who really understands statistics knows that just because two things rise together over time does not mean one caused the other. For example, Kindergarten teachers have seen their salaries go up and up over the last 30 years and we have seen the price of booze go up and up as well. There is a strong correlation between Kindergarten teacher salaries and the prize of beer, wine, and strong spirits. Did demand from the teachers cause the rise in prices? (perhaps both caused by inflation?)
The point is that even if we hit a warming trend again that would still not prove a darned thing. Correlation does not prove causation. However, the lack of correlation (lack of good predictions also) can disprove a theory and we have already seen that happen but the alarmists will not admit it.
~Mark
“…if we hit a warming trend again…”
We ARE in a warming trend, Mark. My God! You are commenting on a blog post that claims to be calling out cherry-picking (it doesn’t, because it used cherry-picking to try to prove its claim), but YOU are referring to the alleged “pause” in global warming which you can only show if you use cherry-picking to start the time period in 1997/98!
Did you really not understand what you were doing?
There has been no warming at all since 1997 and cooling since 2004. Since that totally smashes the idea that more CO2 causes warming, I do know what I am doing.
On any time scale warming always leads CO2 increase. That says your religion is bogus and the speculation that CO2 drives climate is falsified.
http://1.bp.blogspot.com/-DTHf3Uxvjy4/TnUVDdM4AaI/AAAAAAAACfI/2zCikxpiFLI/s1600/paleocarbon.gif
>There has been no warming at all since 1997 and cooling since 2004.
Both those claims are false, Mark, but the real point is that even to make those claims, you must ignore all the data before 1997 and all the data after 2013. You are cherry-picking, and that is what Steven is correctly saying is WRONG.
>On any time scale warming always leads CO2 increase.
No, Mark, that is false. It is true that warming begins because of changes in earth’s orbit and its orientation toward the sun, but then CO2 takes over as the forcing that is much greater than the forcing caused by orbital and orientation changes.
Again, the point Steven tried to make is that cherry-picking is wrong. He’s right about that but wrong that NOAA and NASA are guilty of it. However, Steven himself used cherry-picking in his failed blog post, and you just used it in spades to claim there has been no warming since 1997 and there has been cooling since 2004. FYI, 214 was the warmest year on record, and 2015 will break that record by a mile.
Ok then, we have a twit who can only say “no that is false” in spite of all evidence to the contrary. And he never gives a citation.
Hell, even “The Team” knows there is a pause. That is the reason they have come up with dozens of excuses for the pause.
I have seen the federal agencies change the past on a daily basis. What is up with that? They can’t come to a decision about the temperature 30 years ago and have to change it daily? And you claim they are not cooking the books?
You are an idiot or a liar. Which is it?
Marty the Troll refuses to acknowleds the earth is cooling…
on a 65 million year time scale.
http://jonova.s3.amazonaws.com/graphs/lappi/65_Myr_Climate_Change_Rev.jpg
on a 5 million year time scale
http://jonova.s3.amazonaws.com/graphs/lappi/Five_Myr_Climate_Change_Rev.jpg
on a 10,000 year time scale
http://jonova.s3.amazonaws.com/graphs/lappi/gisp-last-10000-new.png
The Holocene is even 2ºC cooler than the previous interglaial the Eemain
http://3.bp.blogspot.com/_cHhMa7ARDDg/SmDoZBIkB3I/AAAAAAAABAc/KkUzrz2abwI/s1600-h/Vostok-140Kc.jpg
(Holocene on left and Eemain is on right)
Quote by NOAA on page 23:
For the brain dead that means if there is no warming for 15 years or more the CAGW hypothesis is disproved. (Of course NOAA is never going to say that clearly.)
https://wattsupwiththat.files.wordpress.com/2015/04/offset-0-05.png
That is why NOAA had to talk trash about the RSS and UAH satellite data sets. At over 18 years of no warming and a cooling trend going forward staring them in the face, they HAD to used their newly ‘adjusted’ data set to get rid of that very embarrassing Pause.
But don’t worry little Warmist you will get your Socialist Utopian life of farm labor with no metal tools, no medicine and a life that is nasty brutal and short just in time for an ice age little or big.
The false hiatus is over, get over it:
http://ds.data.jma.go.jp/gmd/tcc/tcc/products/gwp/temp/fig/an_wld.png
http://ds.data.jma.go.jp/gmd/tcc/tcc/products/gwp/temp/ann_wld.html
Another non scientific approach…
Since there are 2 systems available, Surface and Satellites and they do not show the same trend, in a scientific point of view that is troublesome. Then there are no uncertainties. In 1890 how many measuring points were there in the SH?
With no warming in the atmosphere for more than 18 years the theory (AGW) is in trouble, where is the hot spot?
There are 3 systems available. The 3rd system is to measure temperatures at the bottom of the ocean, and since we can’t measure that accurately, we can just make it up.
Morgan, you have not kept up with the research on the “hot spot.” It is there, and you can easily find the papers that demonstrate it is there and explain why it appeared to be missing.
And again, you can’t claim there has been no warming for 18 years without cherry-picking your start year, and even when you do that, there is still warming, so please stop misrepresenting the facts.
The difference between the satellite data and the surface data has also been discussed and explained. The explanation does not support your doubt.
Cherry-picking the start year? By starting from now and go back as far as possible without finding any warming… Funny.
“you have not kept up with the research on the “hot spot.””
Are you referring to the paper by Allen, R. J. and S. C. Sherwood, 2008: Warming maximum in the tropical upper troposphere deduced from thermal winds, Nature Geosci., 1, 399-403? The paper that claimed that the hot spot could be inferred by wind sheer, even though the thermometers were unable to measure it?
Or maybe Sherwood, S. C., C. L. Meyer, R. J. Allen and H .A. Titchner, 2008: Robust tropospheric warming revealed by iteratively homogenized radiosonde data, J. Climate, 21, 5336-5352? The one that said that while the hot spot was not measured, that the uncertainty was big enough that is could still, conceivably, be there?
“And again, you can’t claim there has been no warming for 18 years without cherry-picking your start year,”
The mathematical ignorance of Martin the goreboy shines through again.
NO Martin, the 1997 starting point for the ZERO TREND is NOT cherry-picked.
it is mathematically determined..
A fact you seem TOTALLY INCAPABLE of grasping.
please do let me know how the data set was balanced
i.e.
equal stations NH and SH?
balanced to zero latitude?
balanced to zero longitude (unless you are looking at the rate of change in T in K/annum?
70/30 @sea / inland?
how do you account for different methods of measurement and observation over time?
please do provide me with proof of a re-calibration certificate of a thermometer before 1948?
etc
Here is an animation showing the changes in station count over the years. This alone is enough reason to go with the satillite data that has better coverage
http://jonova.s3.amazonaws.com/graphs/stations/great-dying-of-thermometers.gif
There are FOUR Radiosonde balloons sets and TWO satellite sets that show no warming for the past 20 years. YES FOUR Radiosonde sets. GISS, NOAA ect Surface data is just made up for the AGW crowd and money. If Trump or Cruz get elected be prepared for major suing by aggrieved parties.
There are FOUR Radiosonde balloons sets and TWO satellite sets that show no warming for the past 20 years. YES FOUR Radiosonde sets. GISS, NOAA ect Surface data is just made up for the AGW crowd and money. If Trump or Cruz get elected be prepared for major suing by aggrieved
parties.
This is the graph that ALL skeptics/Deniers should be using to completely shut the AGW idiotas LOL. Its totally devastating to their cause its actually SIX reliable datasets showing NO warming whatsoever
http://www.globalwarming.org/wp-content/uploads/2013/06/CMIP5-73-models-vs-obs-20N-20S-MT-5-yr-means1.png
So ALL the climate models started running hot over five years ago. The average of the models has been running hot for over 20 years. That was before ex-senator Wirth and Hansen’s dirty tricks scared the US senate into believing in CGW as a political move as part of their political strategy to get Dukakis elected president.
At this point I can not wait for the Ice Age to begin although the Climate Propagandists will just switch again or just drop ‘Gore Bull Warbling’ and go with CLIMATE CHANGE!
http://www.preparedsociety.com/images/1/7/6/4/0/sky-falling-123.jpg
Gail, at this point we can be fairly confident that when the next ice age begins, alarmists will blame it on ‘global warming’.
Yeah, they are already using the ‘Global warming causes more snow and freezing temperatures’ (Met office a few years ago.)
Hiatus is over.
Saying it is so, does not make it so.
YUPPERS!
The Hiatus is over and we are headed for COOLING.
The Pacific ocean just exhaled a huge amount of heat and the sun is not going to be recharging it at the same rate it was in the 1980s
What tiny amount of warming CO2 might contribute is nothing compared to what the reorganization of the climate system will do as the sun heads into hibernation.
https://bobtisdale.wordpress.com/2015/12/30/the-silliest-post-cop21-headline-ever/
Marty, cfgjd and their companions must have studied climate science under Richard ‘Racehorse’ Haynes.
Here’s the famous defense attorney explaining in a lecture to young lawyers how he would apply the doctrine of alternative pleading in a case.
As a Senior Electrical Engineer, experienced in multispectral and RF sensors (radars and infrared sensors), and trained in statistical signal analysis…. I find it sadly amusing to see supposed “scientists”, arguing over whether to start a statistical analysis, on incomplete, sparse data, from 1890, or 1979, (or whenever, in human’s short recorded history), and do any rational mathematical analysis, over reams of conflicting data… and then drawing grand “settled proof” conclusions…
1. Assuming the earth is 4 billion years old: 10 year, 100 year, or even 1,000 year data sample sets (and any interpreted trends) are totally, statistically insignificant. On a macro scale, a sample size of .000025% is just so completely meaningless! (And that weakness is not changed by when you start it.) And on a micro scale, any sample, that is a small fraction of an oscillation period (think sun-cycles), is even more meaningless.
2. You cannot rationally draw a linear trend, of ANY kind, about a non-linear, complex variable, oscillating systems. (Especially a system with little-understood energy-input forcing functions, which are non-linear, with complex multiple-periodicity overlapping oscillations; and with the system, itself, consisting of multitudes of complex-variable damping and storage functions……)
3. By definition, only the Energy Inputs to a system are Forcing Functions, everything else is a damping or storage function. So CO2, by definition, is NOT a forcing function.
4. Science is about repeatable experiments… period. Everything else is speculation. My opinion is as worthless as yours. The only real facts are those, which can be experimentally repeated, under controlled conditions. Sparsely measured data of an uncontrolled system, with lots of variables, and that data’s interpretation, are NOT science.
— Peer review is meaningless, if there is no experiment to repeat. Presenting an interpretation of reams of data, with a whole bunch of letters (ex. PhD) after your name, to prove you are smarter than the next guy; and then having another person, again, with lots of letters after their name, to prove their intelligence, agree with you; that is NOT peer review. It is NOT science. It is intellectual incest.
— A scientific, repeatable experiment can be suggested… (Try it, it has been done; any high school science fair group with a decent budget can do this.) For instance, set up a multispectral energy sensor at one end of a long table (maybe 20+ ft.), inside sealed large box, the same size as the table. Put a radiating energy source, that matches/simulates the sun’s spectral energy signature, across the whole spectrum; at the other end of the table (also inside the sealed box). Pump air from the box, to get a good a, outer-space-like vacuum. Measure the results. Pump in air samples that match various layers of the earth’s atmosphere, (troposphere, etc.) Measure the results. Now repeat the whole set of experiments, adding increasing levels of CO2. Measure the results.
— What you will find, (scientifically, repeatably), is that CO2 quickly saturates its energy absorption, nearing 98+% energy absorption, at very low ppm levels, in the narrow energy spectral bandwidths (the spectral wavelengths) that CO2 absorbs energy in. (Which, by the way, are only a small fraction of the sun’s energy over the whole spectrum). Once saturation is near complete, doubling or tripling the CO2 concentration has little, to no effect.
—- For the non-Engineer, or non-Scientist, whose eyes have glazed over at the fancy words in preceding paragraphs, here is a simple, easy to understand explanation. You are looking down a hallway, into a room with a light. It lights the hallway. You can see. (Your eye detects the energy of the light). Someone closes the door of the room. (The CO2 saturates its energy absorption.) Now it is hard to see, because it is dark. (Most of the light’s energy is blocked by the door (saturated CO2) from reaching your eye {the sensor}). Now, close a second door, between you and the light in the room. (Double the amount CO2, after saturation). It still is hard to see, maybe a little harder to see, because it is dark (maybe just a little darker). But the difference in you being able to see, between an open door and a closed door, is huge. The difference in you being able to see, with one door closed, and 2 doors closed is very little.
— This scientific, repeatable experiment, will confirm, to anyone willing to try it, That CO2 CANNOT cause significant temperature increase on earth.
— Any High School Biology teacher could tell you the following nugget. We are carbon based life forms. Almost all life on earth is carbon based. CO2 is the basis of photosynthesis, which is the basis of 99.9% of the all food chains on earth. (In scientific terms, CO2 is the limiting reactant in the photosynthesis chemical reaction.) Which means the more CO2 you have, the richer the food chain; the more food you have. Ask any horticulturist, what happens if you pump extra CO2 into a greenhouse. You get lusher tomatoes and roses. To know these facts, and then label CO2, (the Elixir of Life), a poison, to be regulated… Wow, how lacking in common sense, how willfully ignorant do you have to be????
Frank , your comment just shows you’re an infidel.
Repeatable experiments , logic , real science ..
what has that got to do with belief
The Algorean Church
A good friend of mine owns a whole heap of greenhouses.
I have seen the MASSIVE benefits of enhanced CO2 food production.
We just laugh about CO2 being “evil” ! 🙂
As a Senior Electrical Engineer, experienced in multispectral and RF sensors (radars and infrared sensors), and trained in statistical signal analysis…. I find it sadly amusing to see supposed “scientists”, arguing over whether to start a statistical analysis, on incomplete, sparse data, from 1890, or 1979, (or whenever, in human’s short recorded history), and do any rational mathematical analysis, over reams of conflicting data… and then drawing grand “settled proof” conclusions…
1. Assuming the earth is 4 billion years old: 10 year, 100 year, or even 1,000 year data sample sets (and any interpreted trends) are totally, statistically insignificant. On a macro scale, a sample size of .000025% is just so completely meaningless! (And that weakness is not changed by when you start it.) And on a micro scale, any sample, that is a small fraction of an oscillation period (think sun-cycles), is even more meaningless.
2. You cannot rationally draw a linear trend, of ANY kind, about a non-linear, complex variable, oscillating systems. (Especially a system with little-understood energy-input forcing functions, which are non-linear, with complex multiple-periodicity overlapping oscillations; and with the system, itself, consisting of multitudes of complex-variable damping and storage functions……)
3. By definition, only the Energy Inputs to a system are Forcing Functions, everything else is a damping or storage function. So CO2, by definition, is NOT a forcing function.
4. Science is about repeatable experiments… period. Everything else is speculation. My opinion is as worthless as yours. The only real facts are those, which can be experimentally repeated, under controlled conditions. Sparsely measured data of an uncontrolled system, with lots of variables, and that data’s interpretation, are NOT science.
— Peer review is meaningless, if there is no experiment to repeat. Presenting an interpretation of reams of data, with a whole bunch of letters (ex. PhD) after your name, to prove you are smarter than the next guy; and then having another person, again, with lots of letters after their name, to prove their intelligence, agree with you; that is NOT peer review. It is NOT science. It is intellectual incest.
— A scientific, repeatable experiment can be suggested… (Try it, it has been done; any high school science fair group with a decent budget can do this.) For instance, set up a multispectral energy sensor at one end of a long table (maybe 20+ft), inside sealed large box, the same size as the table. Put a radiating energy source, that matches/simulates the sun’s spectral energy signature, across the whole spectrum; at the other end of the table (also inside the sealed box). Pump air from the box, to get a good a, outer-space-like vacuum. Measure the results. Pump in air samples that match various layers of the earth’s atmosphere, (troposphere, etc.) Measure the results. Now repeat the whole set of experiments, adding increasing levels of CO2. Measure the results.
— What you will find, (scientifically, repeatably), is that CO2 quickly saturates its energy absorption, nearing 98+% energy absorption, at very low ppm levels, in the narrow energy spectral bandwidths (the spectral wavelengths) that CO2 absorbs energy in. (Which, by the way, are only a small fraction of the sun’s energy over the whole spectrum). Once saturation is near complete, doubling or tripling the CO2 concentration has little, to no effect.
—- For the non-Engineer, or non-Scientist, whose eyes have glazed over at the fancy words in preceding paragraphs, here is a simple, easy to understand explanation. You are looking down a hallway, into a room with a light. It lights the hallway. You can see. (Your eye detects the energy of the light). Someone closes the door of the room. (The CO2 saturates its energy absorption.) Now it is hard to see, because it is dark. (Most of the light’s energy is blocked by the door (saturated CO2) from reaching your eye {the sensor}). Now, close a second door, between you and the light in the room. (Double the amount CO2, after saturation). It still is hard to see, maybe a little harder to see, because it is dark (maybe just a little darker). But the difference in you being able to see, between an open door and a closed door, is huge. The difference in you being able to see, with one door closed, and 2 doors closed is very little.
— This scientific, repeatable experiment, will confirm, to anyone willing to try it, That CO2 CANNOT cause significant temperature increase on earth.
— Any High School Biology teacher could tell you the following nugget. We are carbon based life forms. Almost all life on earth is carbon based. CO2 is the basis of photosynthesis, which is the basis of 99.9% of the all food chains on earth. (In scientific terms, CO2 is the limiting reactant in the photosynthesis chemical reaction.) Which means the more CO2 you have, the richer the food chain; the more food you have. Ask any horticulturist, what happens if you pump extra CO2 into a greenhouse. You get lusher tomatoes and roses. To know these facts, and then label CO2, (the Elixir of Life), a poison, to be regulated… Wow, how lacking in common sense, how willfully ignorant do you have to be????
Very well said Frank, by someone who obviously has some credible idea about what they are saying – worth of posting twice!!
“that is NOT peer review. It is NOT science. It is intellectual incest.” CLASIC – I LOVE IT
Happy New year.
Frank, outstanding comment. Reblogged here: https://hifast.wordpress.com/2016/01/15/gold-star-commenter-nomination/