
NOAA thermometers show the US cooling over the past century, but they alter the data to make it look like the US is warming.
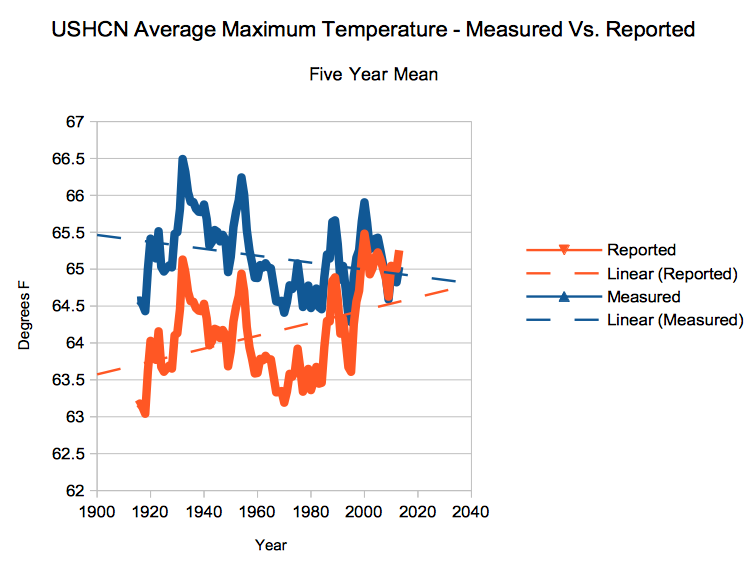
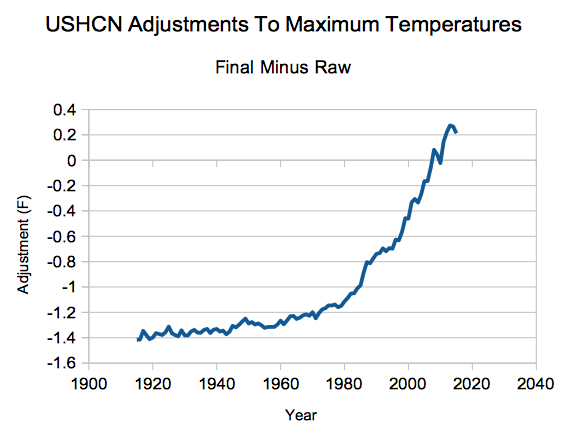
They accomplish this through a spectacular hockey stick data tampering, which changes the trend by 1.6 degrees.
Their data tampering destroys an entire field of science. If an accurate representation of temperature was presented, the global warming scam would collapse overnight.

Who ya gonna believe? NOAA? Or yer lyin’ thermometers?
I have yet to read any reasonable explanation for the increasingly bizarre “adjustments” being done to the data. Even more damning, I have yet to read any justification for the increasingly bizarre amounts of data that are simply rejected and disappeared from the data, with fabricated numbers being inserted in their place.
If I were a “climate scientist” I would be very tempted to resign my position, change my name and move to someplace obscure, hoping to be quietly forgotten by the time this farce finally collapses — and it will. Soon or late, it will.
With the current El Nino and the warm blob, the oceans are losing heat to the atmosphere.
As these subside, probably around mid 2016, things will start to get interesting.
(The El Nino and the warm blob have NOTHING to do with any mythical CO2 warming)
Early 2016 could be quite warm, but then the global temps will start to drop…
… let’s all hope, not too far !
meant to put Roy’s NCEP map with that.
http://www.drroyspencer.com/wp-content/uploads/2015-CFS-T2m-global-temperature-anomaly.jpg
Not only is there no reasonable explanation for the increasingly bizarre “adjustments” being done to the data, when one digs into the nitty gritty, if adjustments are to be made they are in the OPPOSITE direction!
They lower the old readings because of TOBS (Time of Observation)
“….Observation times have shifted from afternoon to morning at most stations since 1960…” – Zeke Hausfeather of BEST data set
However the ” Meteorology: A Text-book on the Weather, the Causes of Its Changes, and Weather Forecasting” 1918 by Willis Isbister Milham
states:
On page 68 he says a thermometer in a Stevenson screen is correct to within a half degree. Two thermometers are used an Alcohol for Minimum and a Mercury for Maximum supplied with a manual in 1882 to the coop stations by the US Weather Bureau. He also states there are 180 to 200 ‘regular weather stations’ ordinarily in the larger cities that take reading twice daily and a continuous reading too. There were also 3600 to 4000 coop stations and 300 to 500 special stations that recorded other aspects of the weather.
So that is one example where the correction applied by the Climastrologists is IN THE WRONG DIRECTION!
Here is another.
Hausfeather goes on to say:
Yet notrickszone reports
So with just those two wrong way adjustments they change the data by more than 1 °C and that does not get into dropping rural stations and smearing the data from airports for 1200 kilometers.
This shows the actual data for Africa and how it was decreased in temperature and smeared.
https://stevengoddard.wordpress.com/2015/01/21/visualizing-ncdcs-spectacular-malfeasance/
This gives you an idea of just how big Africa is:
https://i0.wp.com/infobeautiful2.s3.amazonaws.com/true_size_of_africa.png
And they are claiming they can calculate the temperature from that data to 0.02°C? RIIiiight.
Doesn’t any journalists (besides James Delingpole) ever bother to check these things?
Dr Edward R. Long, Ph.D. in physics and a retired NASA scientist has provided more validation of data altering.
I figure we should put this info out periodically for any new readers.
Urban stations should really only apply for that urban area, and NOT to any rural area around that urban area. Rural stations could possibly be applied to much larger areas.
Urban areas in the world actually account for a small fraction of the land area, and taking the mean, as Edward Long has done, puts a much higher weighting on urban stations than they should have.
For instance, if the rural stations above accounted for 20 times the area of the urban, the final weighted temps would be 0.14 raw and 0.59 fabricated.
Jason….there were three long threads on WUWT about the algorithm they use to adjust temperature. It done in very small increments….every time they enter a new/current data set…the past temps are adjusted.
But what this means is the climate models will never be able to predict future temps…
If I was working on computer climate models…I would be royally pissed….by the time you enter one set of numbers….do a run…..the numbers have changed again…you would never be right
Hey Latitude! Do you know whether the actual algorithm (the software coding or the mathmatical function) was given, or was the WUWT discussion more on the effects of the adjustments? To the best of my knowledge the actual “this-is-how-and-why-we-change-the-numbers” has not been released. Heck, even if they told the how and why it would be difficult to justify “adjustments” done on a perpetual basis for old records when no new information about how those records were made is forthcoming. Wish I could do that to my bank account. “Yeah, I am going to increase that deposit for $100 that I made three years ago. Add $50 to that, go back and calculate all fees, interest and balances incorporating similar changes to all other deposits older than three years. Hey! I am rich!”
The whole justification for measurIng something is the supposition that reality is something stable. How can you just change past data without more information about it?
They were extremely long threads…with a lot of people talking all at the same time!
I don’t remember if anyone had the code….but they were discussing the actual algorithm and what it did.
I looked for those threads a while back….but didn’t find them
I’m quite pessimistic that it’s going to be a lot later. A few years ago I shared your opinion but I’d have to say that the doom & gloomer brigade has gotten a second wind.
Such fraud has almost destroyed belief in every government scientific pronouncement.
There is an intriguing suggestion that information on the real dangers of WI-FI radiation are underestimated because information on the Internet is controlled:
http://www.dcclothesline.com/2016/01/02/school-science-fair-experiment-proves-wi-fi-radiation-prevents-seed-germination/
If true, that would justify the expense of old-fashion book publication.
Does anyone have information that would verify or disprove the results of this high school science experiment?
Intuetivly, in my gut, I know the whole thing is a lie. I have lived in south Florida since 1945. I see no changes in hot and cold cycles, no change in sea levels since I was a youngster. In the mid 50’s the ocean was so warm that I snorkeld or scubaed every day during the winter. You must understand that we south Floridians quit the ocean from November to April in normal times.
In 1958, when I was a student at Palm Beach Junior College, I was hired, along with other students to take tide readings at the spillway side of the Palm Beach Canal. I went back during the recent super tides and I saw no change 57 years later.
My observations are totally anecdotal. But, I am a betting man and I’ll bet the changes and trends being reported are the result of changing historicsl data.
Key to the problem, is the new breed of Sheeple that suck it up. The USA of old, was wise to any new snake oil salesman with all the tricks going ; something has changed & not for the better.!
Reblogged this on The Grey Enigma.
Newly released adjusted data now states that the Red Sox won the pennant!