
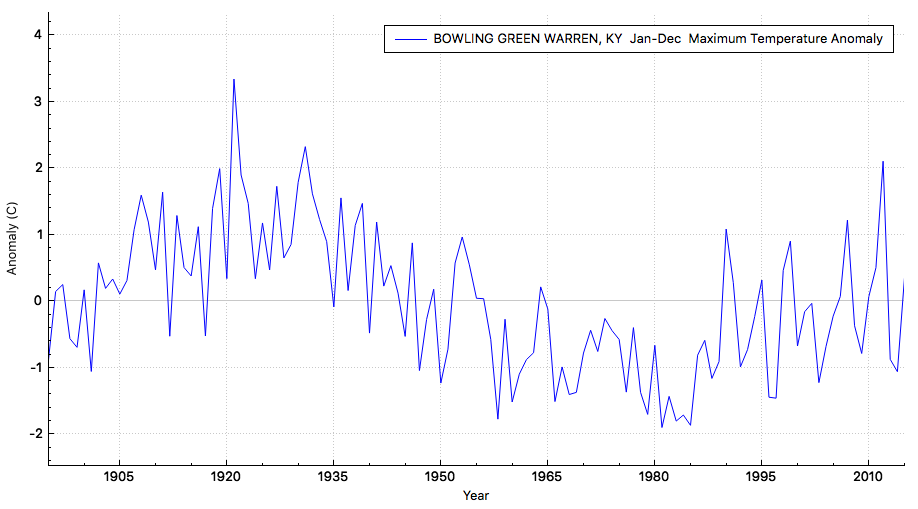
Afternoon temperatures have gotten much cooler at Bowling Green, Kentucky over the past 90 years.
And the frequency of hot days there has also plummeted.
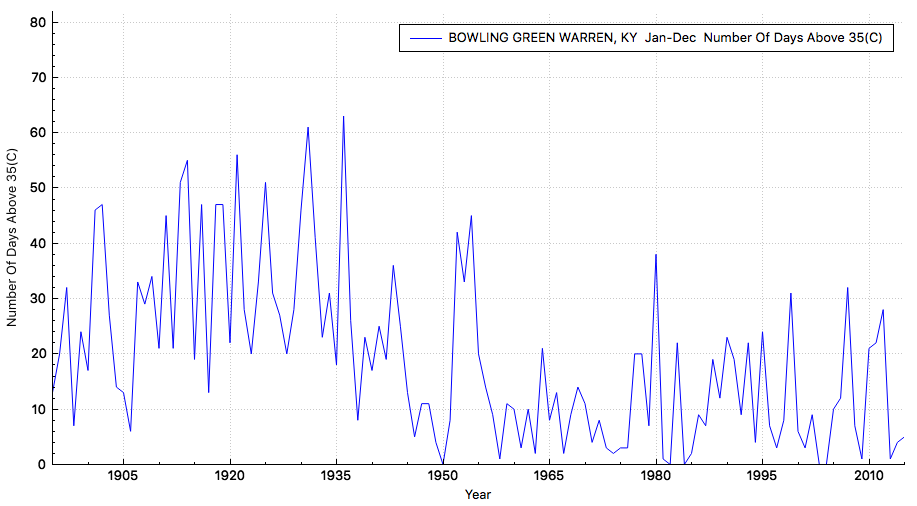
It took me less than 10 seconds to generate these graphs – for free. Why can’t our government agencies with billions in funding figure this out?

Ummmm … because then they couldn’t maintain their elite climate priesthood status? If it is easy enough for anyone to get information, then some people willing and capable of thinking for themselves, really will think for themselves. That will mean fewer people will uncritically accept any lies that we are being force-fed from the CAGW machine.
Because the billions in funding are there so that you don’t figure this out.
Kentucky Cold Chicken
My sisters in Owensboro, Kentucky, on the Ohio River, are always griping about the cold winters there.
because they don’t want you to…..
When has the government done ANYTHING for less than a $billion? When has the government done ANY $billion project that was worth a hoot?
Thanks for this website…a daily visit.
Your new programs looks spiffy. Does it only use USA databases or does it have global databases? i.e. will I be able to look up info for (say) Lethbridge, Alberta, Canada? Env Canada has “okay” data bases but graphs have to be made in Excel. It is cumbersome.
The official local airport wx station was changed in 2006 so its data sets are in separate files. The long-term data base for the region dates from 1910 at an Agr Canada research station. Unfortunately, it is on the edge of the city and compared to the official more-rural airport and a nearby station, the temps are always higher and unreliable because of UHIE.
Now I really digress. I ran a regression of mean annual temp differential (between the airport and the research station) against city population growth for almost 40 years. The r square value was 0.92. As the city pop grew, the readings at the research station increased … lock step.
Thanks again.
Right now it is just the US, but that is just logistics.
That is a very clever analysis. I would like to see that done on many sites.
But…AWG folks will look at that and proclaim you to be one of them. “See we were right”. But in reality it is only Anthropogenic City Warming.
They had it figured out a long time ago. Then, they said “UH OH!” and most of their energies and expenditures since then have been aimed at trying to credibly overwrite the record and erase all memory of it. That’s why they need all that money.
Obviously you’re cherry-picking your graphs by not starting at 1979, the commonly accepted beginning of climate history.
What?
The start date varies a lot. When talking about Arctic sea ice or satellite remote sensing TLT, then 1979 is a common start date. Global temp graphs often start at 1750, 1880 or 1900. And they, without an exception, never include estimated error margins. Whether facts change by changing start date – no, but it gives interesting information on the goals behind a presentation.
Steven’s graphs are something to enjoy, but they lack ‘some’ rigor in statistical handling. That is what NOAA is supposed to do. Supposed. It might be much too politized to be able avoid jumping on the warmist bandwagon.
If it doesn’t support the warming agenda, it is of no use to them. It is denier blasphemy.
Is Bowling Green, Kentucky a tree? No? If it’s not a tree it can’t be global.
Snow in Kentucky, especially eastern Kentucky has been phenomenal these last two winters. Up to 20 inches from this recent storm and two other similar storms last winter. Also, incredible cold. Last winter got down to -35 F.
Just having more fun than ever!
This question presupposes that government agencies strive for efficiency, while the institutional knowledge that is built in is that if you want to keep your large budget, you spend it all every year; if you don’t, your budget gets cut. The other truism is that money is power … the larger your budget, the greater your power.
And where does this leave us poor taxpayers? SOL
It took me less than 10 seconds to generate these graphs – for free. Why can’t our government agencies with billions in funding figure this out?
Jesus Christ Tony, they’re the ones telling the lies.
Our government is going to have to change. And that is not impossible.
Earlier week I drove over the Clinch River on I-75 a little south of the Norris Dam in Tennessee. The Clinch is a major tributary of the Tennessee River and already a good sized river where I crossed it. I was surprised to see skim ice covering a good bit of it’s surface. That was a run from Anderson, IN to a plant in Columbus, IN where I delivered. Then I drove a couple miles to a warehouse owned by the same company I had delivered to and was loaded and took that load down the terminal in Andersonville, TN (Just north of Knoxville). Dropped that loaded trailer there. Went and got a good catfish lunch from a local joint and took a 10 hour break. Then at 23:00 that night I hooked to a loaded trailer and took it to a place in Louisville, KY to be unloaded and then drove back the Anderson, IN.
My other trip this week that I just got back from was taking a load of Boost nutrition drink from the Nestles plant in Anderson to another Nestles facility in Breinigsville, PA (Just west of Allentown). Delivered there Thursday morning after a 10 hour break then drove 57 mi south, most of it on hilly winding PA 100 to Thorndale, PA and was loaded with 24 Gaylords full of plastic beads. I brought them back to Anderson for a local driver to deliver later today. Turned that trip in 34 1/2 hours from the time I left until I got back.
The three major Rivers I crossed over during thislast trip were the Susquehana,Monongahela, and the Ohio. No ice on the Ohio where I crossed over at Wheeling, WV (There was considerable ice on it this time last year). A little skim ice along the banks of the Monongahela where I crossed over near Belle Vernon, PA. Last year at this time I think the Monongahela was pretty much frozen over so a person could walk out on it except where the barge channel ran through. The Susquehana near Harrisburg, PA appeared well on the way to be freezing completely over but not solider enough to be safe to walk out on very far. White as far as I could see right down to the nuclear plant at Three Mile island.
Still serious snow in the ground in eastern PA. Had to drag one side of my trailer tandems through about 3′ of it to get around a tight turn. I hate doing that but there was not alternative. One never knows for sure just what’s under that pile of plowed snow.
It must be because they burn lots of coal in Kentucky? or maybe greenhouse gasses caused by ruminant animals like horses they like to breed there or Kentucky Derby, as we have been told by idiots like Obummer’s science adviser Holdren last winter, CO2 causes global warming which causes global cooling in winter due to polar vortex. According to Holdren, we should put sterilization chemicals in water supply in Kentucky to help save planet, mistake – that was his 70s gig on global cooling.
Tony, if you pick out an individual station out of thousands, chance you will/can find what looking for, so not much attention, or will be accused of cherry picking (95 years would be better than 90 aside for cherry pick on interval less place). Plus it is not just winter (Jan-Dec) average temps or hot day frequencies during winter to scientifically disprove thus charade of global warming. CO2 theory is more whole year and diurnal temperature variations, have to look at both daily highs and lows in both winter and summer, have to look at whole year, have to look at whole globe.
Next, I am assuming you are using surface temperature record (let alone contamination by UHI effect). CO2 theory would say troposphere not just surface should warm, better use RSS satellite or radiosonde.
Or maybe why “Kentucky Going Cold” is because war on coal by Obummer Administration reducing use, higher home heating costs by electricity, lower thermostats due to higher costs to heat home, less UHI effect, or it could just be a statistically insignificant change in temp at Bowling Green KT, I vote latter.
Did you know there are more whisky barrels in Kentucky than the state has citizens? We Hoosiers like to make fun of those folks down there but as far as this Hoosier is concerned, any place that has that much bourbon has a lot going for it!
RAH,
Are you saying bourbon whiskey consumption in Kentucky caused TOBs (time of observation) errors and KT temp to fall? Theoretically, if volunteers in old Kentucky homes taking temps and resetting thermometers drink more bourbon, oversleep and get up late, decide to read/reset thermometers in afternoon instead of morning, then TOBs would lead to a rise in temp; now if they drink and stay up all night and make moonshine and tend to take temp and reset in morning before go to bed makes sense for colder and falling temp bias. Still, it could be another variation, TOBs only matters after 1950s, but the end of prohibition saw a fall in temps according to Tony’s data, so maybe end of heat island effect around those old Kentucky homes due to less moonshining causing less heat? But while less distilling caused less heat after 1930s, less fermentation also causes less CO2. According to alarmists, end of prohibition causing less CO2 at old Kentucky homes could cause drop in temps. There is always an angle, give me a result and I can find you a theory to get you there.
No I think it is much less complex than that. It appears to cause a warming bias in many places and not just Kentucky because given the right conditions and amount of consumption for many male users it can make a woman like say Janet Reno
http://img.spokeo.com/public/900-600/janet_reno_2008_04_27.jpg
appear as hot as Miss Kentucky 2015. Especially around 3:00 AM or whenever last call happens to be in a given local.
In other places it has other effects. For example in some places in the back hills of Kentucky, specifically in areas where a less refined and aged version of the local specialty is sometimes made and consumed, it has at times been known to make women appear to have teeth were there aren’t any. I have also heard it has also been known to make a sister appear to be a suitable girlfriend to her brother at times.
I think I’d die of alcohol poisoning well before !!
Janet Reno should rot in the afterlife for her wanton incineration of innocent women and helpless children. To knowingly conduct the raid on such a windy day was a horrible death sentence for them, regardless of who started the fire. Two days later, almost no wind at all. Wouldn’t it have been far better to have waited a couple of days?
Reno got her marching orders from Bubba. He owned her lock, stock, and barrel.
Let us remember that as well as being a child murderer at Waco, Reno was part of a governmental cover up of vote fraud while she was in Miami.
There is one trend in Kentucky that is getting hotter, Miss Kentucky 1950…
http://www.misskentuckypageant.com/sitebuildercontent/sitebuilderpictures/pre0300.jpg
Miss Kentucky 2015…
http://content.missuniverse.com/media/photos/galleries/pu_2_2015_glamourshot_usa20151957_108.jpg
There is a glacier melting somewhere…
“There is a glacier melting somewhere…”
Not gunna tell y’all where, though 😉
It is hard to conceive of a person so beautiful!
Why does the conversation on this site so often disintegrate? That ’50s contestant looks decent and natural, gentle, kind, thoughtful, compassionate, pure. The 2015 version, besides being artificially enhanced in places, including, from the top, bleached and colored hair, eye liner that would make Cleopatra wince, plumped lips, ballooned breasts, and fake fingernails, would seem not to value the privacy and integrity of her body. Grow up.
Plumped up lips? 😆
Obviously you need to clean your monitor. And where is it you have documented ballooned breasts?
The 1950 Miss Kentucky needs to wash her hair.
The difference between 1950 and 2015 is the same as the climate data from NASA and NOAA. They have been altered.
Did they “ugly up” Miss Kentucky 1950? Was that oily hair photoshopped?
Not just Kentucky
This is a link to the unusual cold weather in Vietnam Hanoi to be exact http://www.thanhniennews.com/society/this-is-how-hanoi-gets-through-its-worst-winter-in-40-years-58692.html
in fact several years ago they had the first snow at Sa Pa in the north in the highlands for 70 years, now it is nearly an annual ritual
here is a photo from a few days ago . Hopethis works[image: Inline image 1]
On Fri, Jan 29, 2016 at 4:08 AM, Real Science wrote:
> stevengoddard posted: “Afternoon temperatures have gotten much cooler at > Bowling Green, Kentucky over the past 90 years. And the frequency of hot > days there has also plummeted. It took me less than 10 seconds to generate > these graphs – for free. Why can’t our gov” >