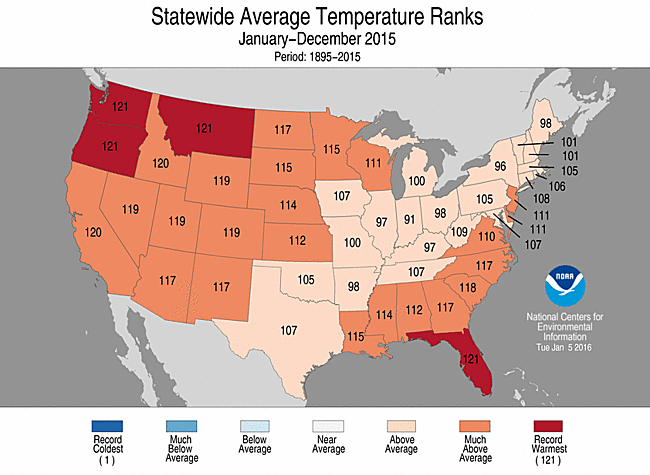
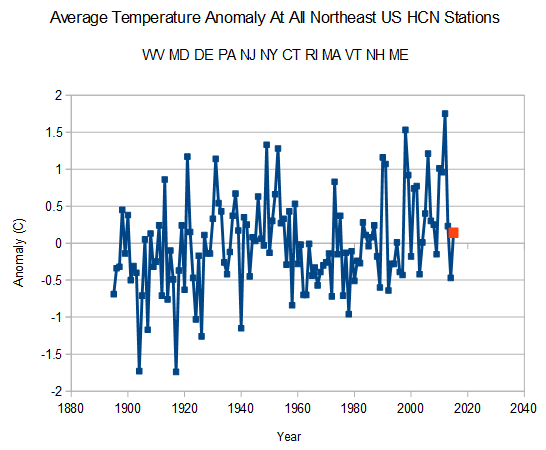
NOAA shows that last year the Northeastern states ranged from 25th warmest to 10th warmest since 1895. But before data tampering, their thermometers showed the average for the region to be just above the 1895-2015 average, and only 44th warmest. Due to massive data tampering, every single state in the Northeast was well above the group average.
Disrupting the Borg is expensive and time consuming!
Google Search
-
Recent Posts
- “Why Do You Resist?”
- Climate Attribution Model
- Fact Checking NASA
- Fact Checking Grok
- Fact Checking The New York Times
- New Visitech Features
- Ice-Free Arctic By 2014
- Debt-Free US Treasury Forecast
- Analyzing Big City Crime (Part 2)
- Analyzing Big City Crime
- UK Migration Caused By Global Warming
- Climate Attribution In Greece
- “Brown: ’50 days to save world'”
- The Catastrophic Influence of Bovine Methane Emissions on Extraterrestrial Climate Patterns
- Posting On X
- Seventeen Years Of Fun
- The Importance Of Good Tools
- Temperature Shifts At Blue Hill, MA
- CO2²
- Time Of Observation Bias
- Climate Scamming For Profit
- Climate Scamming For Profit
- Back To The Future
- “records going back to 1961”
- Analyzing Rainfall At Asheville
Recent Comments
- Bob G on Fact Checking NASA
- arn on Climate Attribution Model
- Bob G on Climate Attribution Model
- Bob G on Climate Attribution Model
- Bob G on “Why Do You Resist?”
- Gerald Machnee on Fact Checking The New York Times
- Gerald Machnee on Climate Attribution Model
- Gerald Machnee on “Why Do You Resist?”
- arn on Climate Attribution Model
- arn on Climate Attribution Model


Steven, why do you think they only tampered with the data for the northeastern states? Or did they tamper with the other states in the opposite direction? Why would they do that if, as you always claim, they want to create warming everywhere? I don’t think you’re supposed to capitalize words like northeast. They aren’t proper nouns, are they?
The data is the data, there is no reason to tamper with it at all. If there is a baseline shift for whatever reason it will be apparent on the raw data.
Given the peer-reviewed explanation for each and every adjustment, what is your opinion based on, other than your tautology “The data is the data” ? If that’s all you have, then in light of the science showing why the data are wrong and must be adjusted, why should I listen to you? Do you have anything besides “The data is the data” ?
Once you start adjusting actual thermometer data you have moved from recording observations to interpretation and the data set has become subjective rather than objective.
Not scientific at all.
wizz, you are claiming to know more than the scientists who do the science that shows why and by how much thermometer data must be adjusted to be more correct. What science is your opinion based on?
Every adjustment of temperature data from the actual reading is a subjective adjustment and as a result the data set becomes an “artists impression”.
You are claiming it so don’t run and hide by saying I have to do my own research. Please point me to where the algorithm for adjustments have been published per station and the peer review you claim is available.
“Every adjustment of temperature data from the actual reading is a subjective adjustment and as a result the data set becomes an “artists impression”.”
I’m asking you to justify that with some science from somewhere. It appears to be your opinion, but it is not based on facts. Or, show the facts on which your opinion is based.
BTW Marty, the actual measurement IS the correct figure, if a bias is present for whatever reason, this should be noted and on display.
For instance: if I go to Wundermap and zoom into a station then if a bias is present due to an AC heat exchange located 6 feet away then this should be noted on the station data.
If, as you claim, each station has its bias peer reviewed and published then this should be trivial to accomplish.
“Given the peer-reviewed explanation for each and every adjustment”
……………
http://fsymbols.co/pictures/thumbs/1/thumb-rotflmao-gif-1254.jpg
You are just too too funny!
Tell me WHY US (and UK) Psycientists have repeatedly refused to honor FOIA and even Congressional subpoenas of NOAA climate scientists then?
We KNOW from the Climategate emails that there was collusion and messing with data in order to support THE CAUSE™
Christiana Figueres, disciple of Al Gore, and Executive Secretary of the UN Framework Convention told us EXACTLY what THE CAUSE™ was:
And so did Pascal Lamy, French Socialist, former World Trade Organization Director-General and major European Union bigwig.
“approach to international relations that questioned the Westphalian, sacrosanct principle of sovereignty” means in plain language, nations are sovereign and NOT vassal states of would be United Nations Totalitarian Bureaucracy… YET.
The UK for example IS a vassal state of the EU. “Thanks to the primacy of EU law over national law. Thanks to the work of the European Court of Justice in ensuring enforcement and respect for the rule of law. And thanks to a clear articulation between the Commission, the Parliament, and the European Court of Justice.” — Pascal Lamy (He should know as he was very high up in the EU before moving to the WTO.)
THE CAUSE™ of course is a ‘socialist’ Totalitarian world government where the masses have zero say.
So you are saying that calibrated thermometers, accurate to tenths of a degree are wrong?
By definition any adjustment to said reading is subjective and needs to be noted as per scientific first principles.
Just so those who might be new here understand why we know these adjustments are bogus, here are two examples.
They lower the old readings because of a TOBS (Time of Observation) adjustment.
Zeke Hausfeather of BEST, a dyed in the wool Climate Alarmist says on Judith Curry’s website:
“….Observation times have shifted from afternoon to morning at most stations since 1960…”
However a meteorology textbook from 1918 states:
The author says a thermometer in a Stevenson screen is correct to within a half degree. Two thermometers are used an Alcohol for Minimum and a Mercury for Maximum supplied with a manual in 1882 to the coop stations by the US Weather Bureau. He also states there are 180 to 200 ‘regular weather stations’ ordinarily in the larger cities that take reading twice daily and a continuous reading too. There were 3600 to 4000 coop stations and 300 to 500 special stations that recorded other aspects of the weather.
So that is one example where the correction applied by the ClimAstrologists is IN THE WRONG DIRECTION! Steven Goddard attacks TOBS directly by looking at the data and also comes up with the conclusion that TOBS adjustments are unjustified.
………….
Here is another.
Hausfeather goes on to say:
Yet notrickszone reports the findings of a carefully conducted test by
So with just those two wrong way adjustments they change the data by more than 1 °C and that does not get into dropping rural stations and smearing the data from airports and cities for 1200 kilometers.
There is no problem data for every adjustment.
You misspelled pal-reviewed again.
The stupidity of this question buggers belief.
Then answer it and show everyone how stupid you think I am.
I have answered that question 500 times on this blog.
No you have not, Steven, and now you are avoiding it. I expected you would, so not to worry. You didn’t address this, however: The problem with your cherished RSS data is exactly the same as what you are complaining about with the RSS data. First,
“Twelve years ago, my curiosity led me to perform an analysis of the UAH TLT data, the results of which I published in a peer reviewed journal in 2003 (5). I found an apparent discrepancy at high latitudes of the Southern Hemisphere, which I suggested might be due to the effects of sea-ice. After my report, the group at Remote Sensing Systems (RSS) decided to exclude any coverage to the south of latitude 70S from their version of the TLT, their reasoning being that the high elevations over the Antarctic was distorting the measurements. RSS also excludes data from other regions with high elevations, such as the Andes and the Himalayas. ”
And, again, the RSS data in addition to the problem exposed in the quote above, is also “massively tampered.” You always ignore these facts when you claim the thermometers are wrong and the satellites (which don’t even measure temperature) are right.
Sorry, that should have been:
The problem with your cherished RSS data is exactly the same as what you are complaining about with the thermometer data.
Martin Smith says“No you have not, Steven, and now you are avoiding it.”
…………….
All that shows is that you never ever bother to READ because you are too busy shoving UN Agenda 21 propaganda down everyone’s throat.
Gail-
He doesn’t read ANYTHING. Have you ever checked out his links? Half the time they say the exact opposite of what he claims. That fraction is even worse if you count the links that are entirely unrelated to the subject he’s claiming they support. He just searches for a title he likes, and posts the link.
Why do the adjustments always favor the predetermined conclusion? Can you show me significant adjustments that oppose the predetermined conclusion? I doubt that you can.
Steve Goddard plotted CO2 vs adjustments and came out with an R = 0.987
R = 1.0 is a perfect correlation. So we now know the true reason for adjustments.
https://stevengoddard.files.wordpress.com/2014/10/screenhunter_3233-oct-01-22-59.gif
https://stevengoddard.files.wordpress.com/2014/10/screenhunter_3232-oct-01-22-58.gif
And there is Mikey Mann’s real hokey stick
Gail, that is exactly what you would expect..when they tell the models an increase in CO2 will increase temps X much
What’s the strangest…..is that they seem to not be the slightest embarrassed about it
Yo Marty,
Saw a guy on WUWT claiming that UAH has 2015 as the warmest year in the USA.
Might be worth checking out to put these fools in their place.