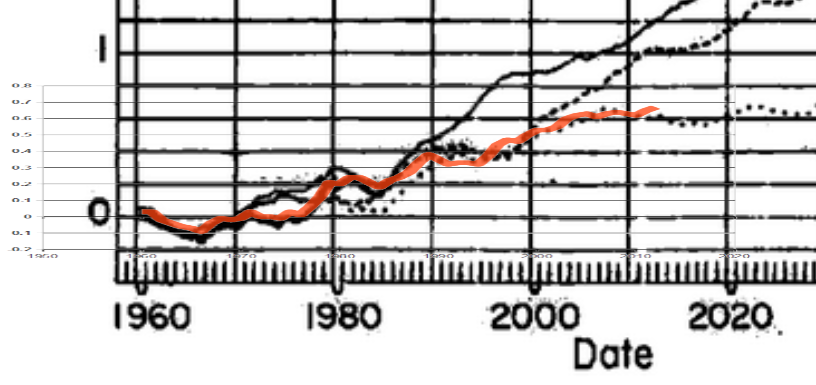
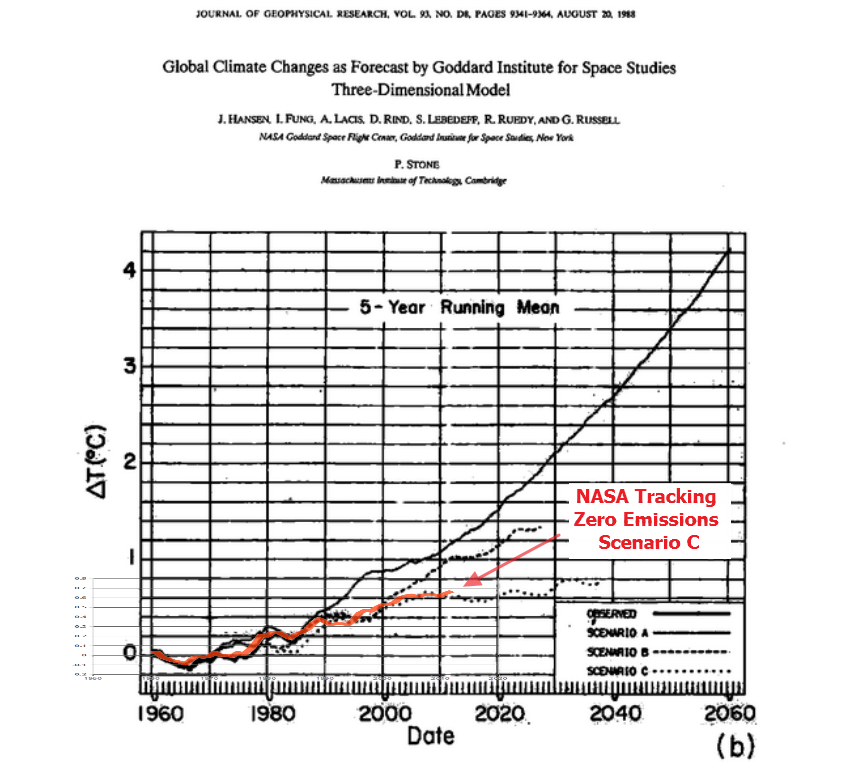
In 1988, NASA’s James Hansen predicted 1.3C warming above 1960 by the year 2015, under his “Business as Usual” Scenario A, with exponential growth after the year 2000.


climatechange.procon.org/sourcefiles/1988_Hansen_Senate_Testimony.pdf
data.giss.nasa.gov/gistemp/graphs_v3/Fig.A2.txt
pubs.giss.nasa.gov/docs/1988/1988_Hansen_etal_1.pdf
Closeup of the hiatus since 2002.

Instead of what Hansen predicted, NASA temperatures nearly flatlined after 2002, and are tracking Hansen’s zero emissions after the year 2000 Scenario C.
Even after all their data tampering, NASA still shows the hiatus. And more importantly they show that increasing CO2 has had no detectable effect on the global temperature. Temperatures are where Hansen expected them to be without any increase in atmospheric CO2.


I don’t understand why they don’t just tamper the data more, so it matches scenario A. It would make the warmtards cheer in the streets. It’s only data—so easy to tamper, the possibilities are limitless.
Because such a thing would be easily proven as fraudulent. Instead they are using the death of a thousand cuts approach, with history being subjected to so many adjustments as to cease to exist.
*busts out laughing*
Now they are taking direct aim at satellites to cast doubt on UAH and RSS.
January 17, 2016 Global Warming Alarmists Claim Weather Satellites Can’t Be Trusted — Delivered by The Daily Sheeple
I take no pleasure in the fact that the scientific predictions I’ve relayed to popular audiences turn out to be true.
-Saint Al Gore
In for a penny, in for a pound.
He has come to embrace the fascist view that big giant lies are easier to sell than little ones.
” Scenario C drastically reduces trace gas growth between 1990 and 2000 such that the greenhouse climate forcing ceases to increase after 2000″
Given that CO2 emmisions have continued unabated for the last 15 years and that the observed temperature is much in line with Scenario C, then logically it would be fair to conclude that Hansen has succesfully demonstrated that CO2 emissions have no sigificant effect on temperature.
Exactly!
Seems to me it would be very difficult for NASA GISS to alter temps to track the plot of even scenario B without a whole lot of collusion with the met offices of other countries and taking out some satellites to get rid of UAH and RSS.
BTW it looks like the probability for me to get called to take a load to MA sometime in the next 48 hours just jumped 50% or more.
http://www.accuweather.com/en/weather-news/arctic-plunge-to-produce-lake-effect-snow-great-lakes/54845212
RAH it is snowing here in mid NC. It just started. It is too warm to stick but the temp just dropped from 30F to 34F in the last half hour.
Weatherbell shows a blocking high that will push the cold coming up on you out over the Atlantic before it gets too bad. But you’ve got another round coming and will see more of the white stuff later in the week.
We’re getting some snow with a breeze now and are forecast to get another 2-4″ by Tuesday. Temp when I got up was 27 deg. F at 03:30. Now it’s 18 and will get down to 0 tonight.
Currently -7F in Dubuque IA, -1 Rockford IL, 0F Waukegan, 4F Chicago, 13F Indianapolis
I measured 5.5 inches of rain at my place since Friday morning, after two inches last weekend.
And this is our dry season.
It is all good though…saves me having to irrigate, and this is the time of year that it almost all goes into aquifer recharge. In summer it just evaporates and falls again the next afternoon.
Amazing too how fast that low developed in the Gulf and moved out.
And the models actually nailed it ahead of time.
That is two Gulf lows with active frontogenesis in one week.
There have been multiyear stretches with zero of these, so I see it as a positive.
Also good they are moving quickly and staying out to sea…when they hang around and bomb out just off the coast, it drives hard freezes into Florida, and no one likes that.
But we will now have our coldest nights in over ten months…it may get down to 42 here for a few nights in a row, but with so much moisture in the ground, I expect low fog to help limit any frost chances.
Gail, if I remember correctly u posted a graph of DMI temps north of 80 about a week ago and it showed 2016 data and yet DMI seems to be not updating. Was it u? If so how did u do it?
Thanks.
I take this URL —
h t t p : // ocean.dmi.dk/arctic/plots/meanTarchive/meanT_ [insert date wanted here] DOT png
http://ocean.dmi.dk/arctic/plots/meanTarchive/meanT_2016.png
You can hover over the graph, right click and then copy image.
That “dropped from 30F to 34F in the last half hour.”
was supposed to be dropped from 39F to 34F — Dang Arthur T. Rightus strikes a gain.
… and I thought you were getting ready to join NCEI. 🙂
Menicholas
I guess those tornadoes down there didn’t get close to you. Killed a couple in or near Sarasota.
This is what we got in the Piedmont area of NC (hope this works):
https://www.dropbox.com/s/tnp1bbhn83fwild/20160117_093408.jpg?dl=0
It looks like you are a bit north/west of me. We intentionally picked just south of the ‘snowline’
It looked exactly the same here today in MD as it does down in NC. The big snow action might come around Friday.
There is a way to get around that stuff. If it’s not too bad in Erie just jump off I-90 onto I-86 and go across the southern tier. If it is bad then take I-80 and jump on I-287 to I-87 to run back up and there by miss the worst of it.
RAH, I used to live within shouting distance of exit 45 (NY) off I-90 back in the late 60s.
Rochester.
Yes….
Reblogged this on Climate Collections and commented:
Heller’s methodology is sound and validated. Graph replicated using NASA’s own published data.
Experience: Chinese Business Man enters revolving door behind you, but exits door just in front of you.
The Chinese are not interested in CAGW except in so far as it allows them to sell more Solar or Wind Junk to the rest of the World which cannot get enough of that sort of Junk.