
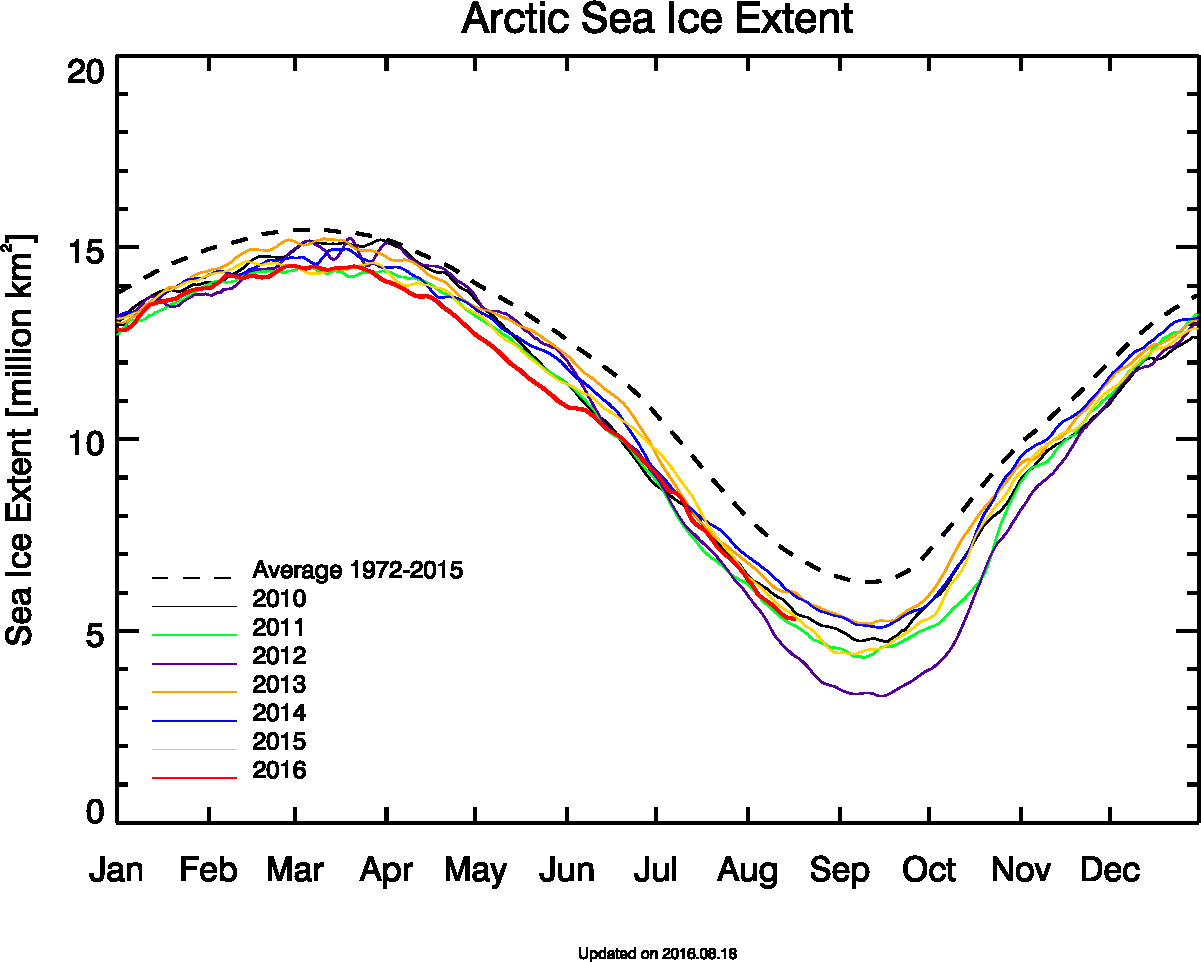
All of the highly paid government ice experts were predicting a record Arctic low or an ice-free Arctic. Meanwhile, I was predicting this :
2016 should end up with more ice than last year
If my prediction is correct, alarmists are in trouble – because next year will become the first year in a decade where there is a significant amount of multi-year ice on the Russian side.
Looks like my analysis was spot on.
I don’t get paid to do this, but these morons are part of a multi-billion dollar scam.
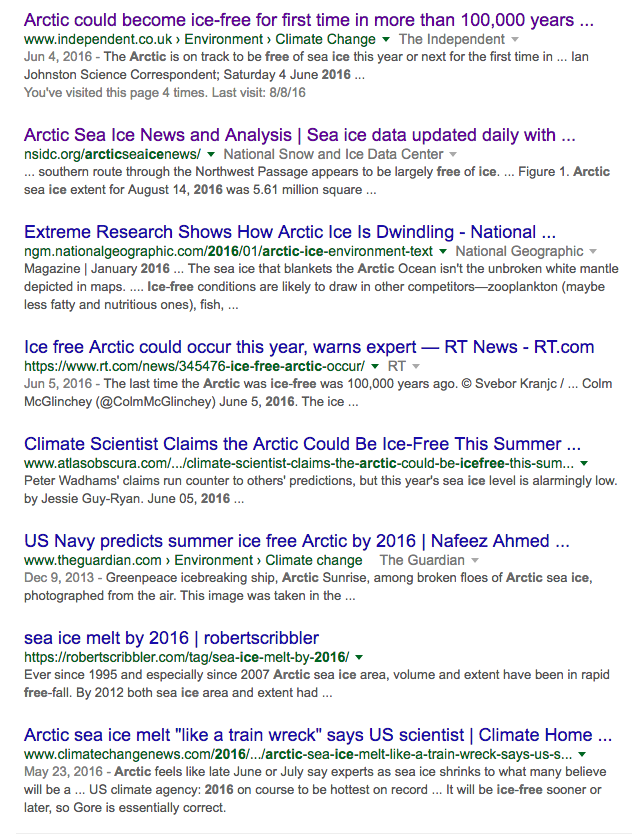
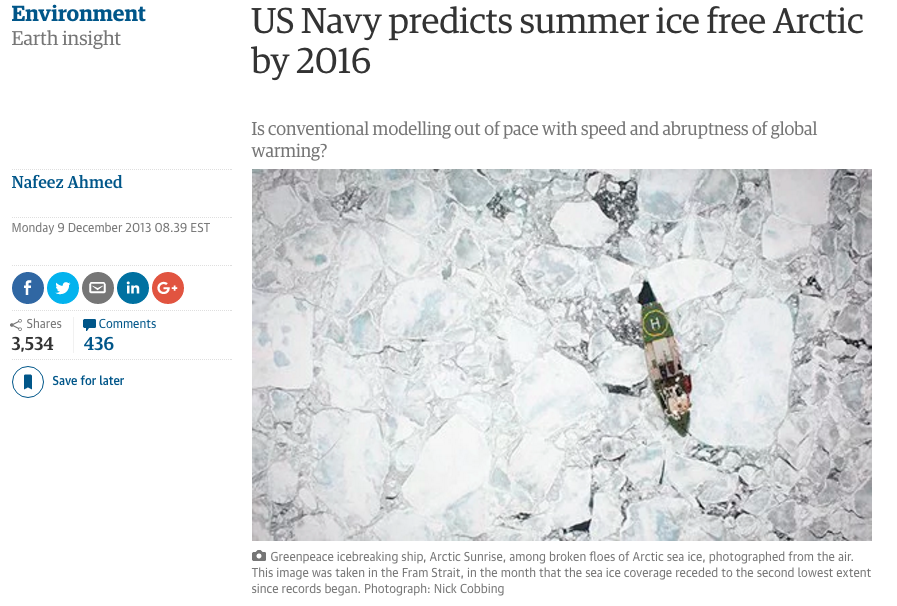
US Navy predicts summer ice free Arctic by 2016 | Nafeez Ahmed | Environment | The Guardian
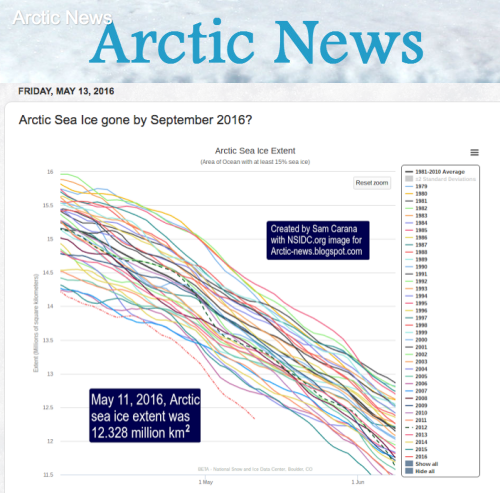
Arctic News: Arctic Sea Ice gone by September 2016?
Arctic could become ice-free for first time in more than 100,000 years, claims leading scientist
The Argus-Press – Google News Archive Search

Gore: Polar ice cap may disappear by summer 2014

Ages-Old Icecap at North Pole Is Now Liquid, Scientists Find – New York Times
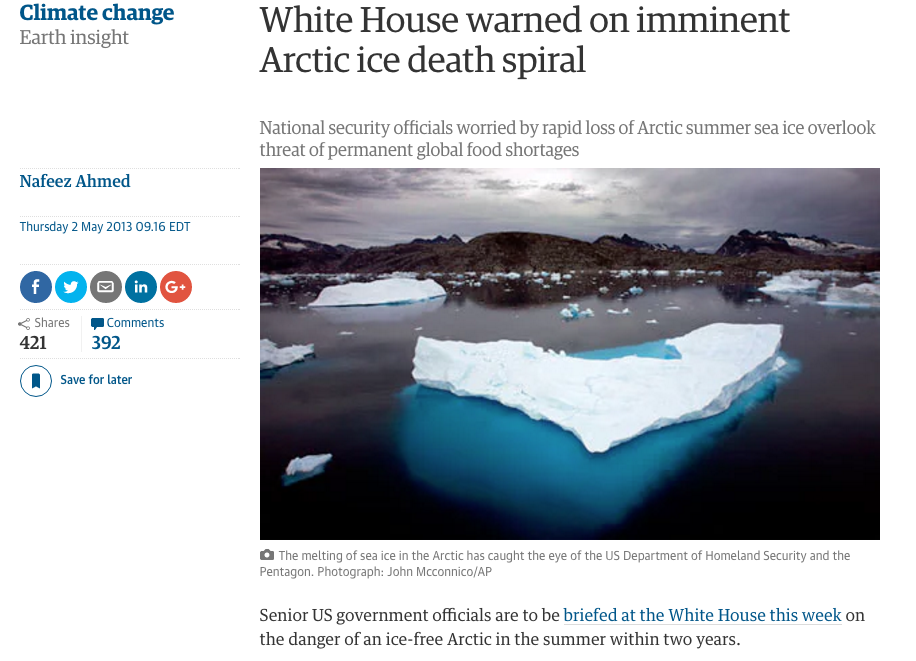
White House warned on imminent Arctic ice death spiral | Nafeez Ahmed | Environment | The Guardian
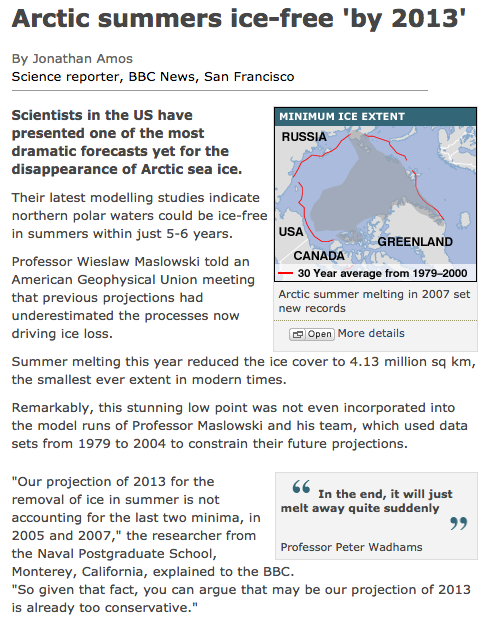
BBC NEWS | Science/Nature | Arctic summers ice-free ‘by 2013’
