Satellites don’t show much warming, but what they do show is fake news.
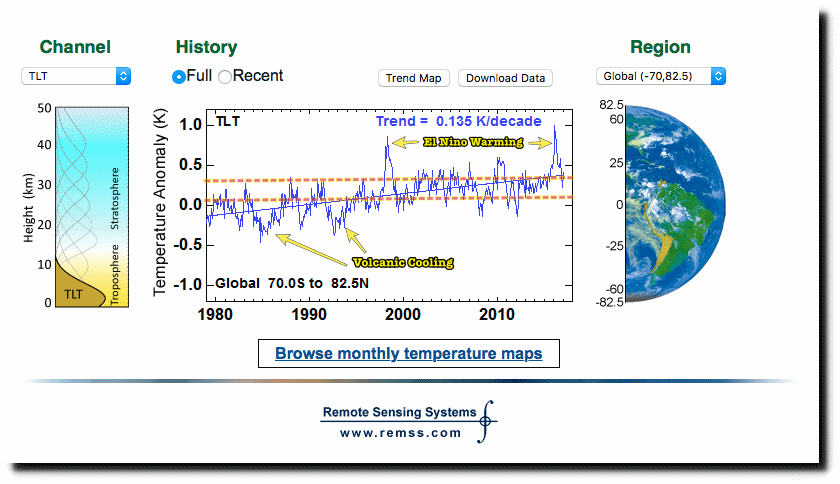
The problem with this graph is that there are two major non-climatic cooling events on the left side of the graph, and two major short lived warming events on the right side of the graph. This causes a linear fit to be meaningless.
The dashed orange lines below show the actual amount of warming since the cold 1970’s – Perhaps 0.2C.
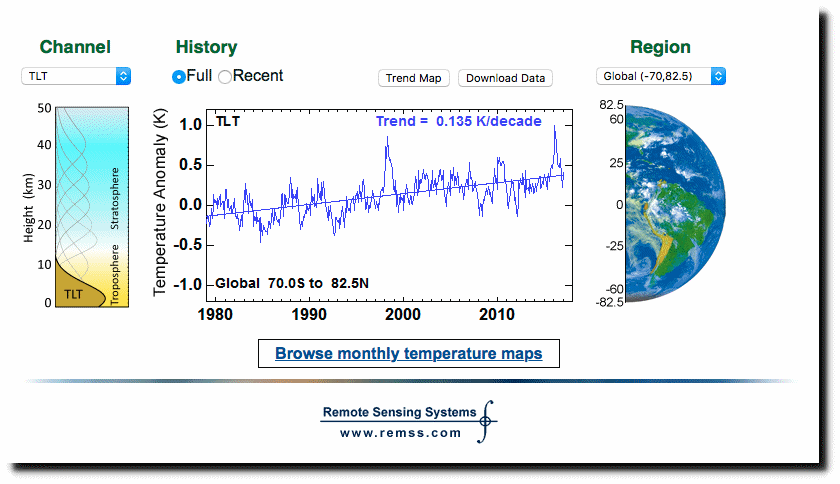
RSS / MSU and AMSU Data / Time Series Trend Browser
Global warming is the biggest fraud in science history.
so that means it’ll only be -9.8 degrees this winter instead of -10. I’m sure that’ll be noticeable in the Twin Cities. Yep. Sure thing.
nope
When you say that global warming is the greatest scientific fraud in history, you are 100% correct. It is completely and absolutely fraudulent. Point after point is an outright distortion or lie.
Climate “Science” on Trial; The Smoking Gun Files
https://co2islife.wordpress.com/2017/01/17/climate-science-on-trial-the-smoking-gun-files/
It essentially shows 2 flat periods, both of which are approximately of 17 years in duration.. I have never understood how any mathematician would plot a linear straight line through this data set.
The first period from inception (1979) through to the run up of the 1997/98 Super El Nino is broadly flat; there is some very slight warming but not statistically significant. The second period, as from the 1997/98 Super El Nino through to the run up to the 2015/16 strong El Nino is again essentially flat. The present 2015/16 El Nino/ENSO cycle has yet to complete, and should La Nina conditions develop in 2017 then things will look a little difference.
The significant event in the data plot is that there is a step change in temperature of about 0.3degC coincident with the Super El Nino of 1997/98. CO2 did not cause that Super El Nino. Perhaps the point of interest is why temperatures have not dissipated following that natural oceanic event.
But the main take home from the satellite data is that it is sensitive to volcano short term cooling and El Nino (generally) short lived warming. There is no first order correlation with rising levels of CO2.
The satellite data appears less sensitive to La Nina events than it is to El Nino events. This may be because of convection of warm air released in El Nino events.
Mother Nature cooling the past and warming the present and all precisely nothing to do with CO2.
They are talking about the noise in the signal.
Climate change is going from Ice Age cold to Holocene warm in THREE YEARS! (Dr. Alley)
And it was not just the Holocene transition.
“The transition into glacial conditions was a relatively sudden event. This is supported by marine and ice core records.”
Royal Meteorological Society
Abrupt and sudden climatic transitions and fluctuations: a review: …A number of persistent oscillations exist, particularly one about 1500 years, but their amplitudes vary considerably between time periods. The Holocene appears to be no more climatically benign than the similar period in the Eemian. The importance of the North Atlantic thermohaline circulation for generating abrupt climatic changes in Europe, particularly in association with sudden pulses of fresh water, is illustrated. The concept of antiphase temperature changes between the North and South Atlantic is discussed. Externally generated abrupt climatic deteriorations owing to explosive volcanic eruptions and variations in solar irradiance are also discussed…
Dansgaard-Oeschger oscillations, Bond events and Heinrich events that cause global temps to change up to 8C, 10C and16C even in dramatically short times, sometimes within a decate and no one really knows WHY.
Dansgaard-Oeschger oscillations during the Wisconsin Ice Age
Gail – FTR, what’s the date on the present end of the X – axis? . . I realize that CO2 will jump to 400 ppm +/- and temp would jump (according to them) from 0.5 to perhaps 1 C. , but even with that super-imposed on the graphs, it looks meaningless when looking at past leaps, as you suggest.
AFAIK, all geologically measured CO2 flux demonstrates CO2 change lagging warming and cooling.
Gary the CO2 data from the ice cores are completely bogus.
http://www.thenakedscientists.com/forum/index.php?topic=39542.45;wap2
http://www.greenworldtrust.org.uk/Science/Scientific/CO2-ice-HS.htm
http://www.co2web.info/ESEF3VO2.htm
http://www.warwickhughes.com/icecore/
I’m aware of that – even heard Willie Soon discuss it the other evening – but was just looking for the date. If I remember correctly, “0” on the scale is approx 1900 AD, is it not?
As is – it’s potentially a fun graphic to pull out with certain idiot alarmists sorts. . . ‘look as CO2 is rising from around 260 to 280 ppm, 8,000 years ago, there is a long trend of global cooling.
Sorry – from 260 ppm (8,000 yrs ago) to 280 ppm (in 1900 AD) . . .
I would argue that bloodletting, practiced from antiquity well up into the 19th century, would give CAGW a run at being more ridiculous.
Bloodletting was done out of ignorance and not as a scam to enslave the entire world’s population. (Agenda 21)
OH, and my uncle had ‘bloodletting’ done on him. His doctor recommended giving blood at the Red Cross once a month to bring his blood pressure down….
there’s huge evidence on reduction of disease by regular blood donation (bloodletting.) Review articles by Weinberg https://www.ncbi.nlm.nih.gov/pubmed/?term=Weinberg%20ED%5BAuthor%5D&cauthor=true&cauthor_uid=3642212
http://www.healthyandnaturalworld.com/reduce-your-risk-of-heart-attack-and-stroke-by-donating-blood/
Humor me. The theory behind bloodletting that spanned at least two thousand years was not based on science. It supposed that health was based on the balance of blood, phlegm, black and yellow vile, aka the four humors.
“aka the four humors.”
ha, ha, ha, ha. !! :-)
Fake News and Nobel/Crafoord Prizes for false scientific evidence of:
_ a.) AGW: Anthropogenic Global Warming
_ b.) BBC: Big Bang Cosmology Model
_ c.) SNM: Standard Nuclear Model
_ d.) SSM: Standaed Solar Model
were all developed to hide the logical error in Dr. Carl von Weizsacker’s definition of “nuclear binding energy” because Stalin acquired the world’s remaining inventory of atomic bombs from Japan in AUG 1945 and united nations and national academies of sciences under the UN on 24 OCT 1945:
Weizsacker’s mistake is obvious (Compare left and right sides of Fig 1) in this tribute to the nuclear, geo- cosmo- chemist, who secretly retained a personal copy of Japan’s atomic bomb design in his home for the next 57 years so the world would eventually know that NEUTRON REPULSION powers atomi bombs, the Sun and the cosmos:
https://dl.dropboxusercontent.com/u/10640850/TRIBUTE_TO_KURODA.pdf
The recent Presidential election in the United States and the jury trial that will begin in Vancouver BC, Canada on 20 Feb in the case of Dr. Michael Mann vs Dr. Tim Ball et al (BCSC Action No. VLC-S-S0111913; Vancouver Registry) are both public trials of one-world government propaganda vs empirical reality.
Just finished an article you may enjoy. It draws on much of the research from this blog.
Climate Science Behaving Badly; 50 Shades of Green & The Torture Timeline
https://co2islife.wordpress.com/2017/02/12/climate-science-behaving-badly-50-shades-of-green-the-torture-timeline/