“It is difficult to get a man to understand something, when his salary depends upon his not understanding it.”
– Upton Sinclair
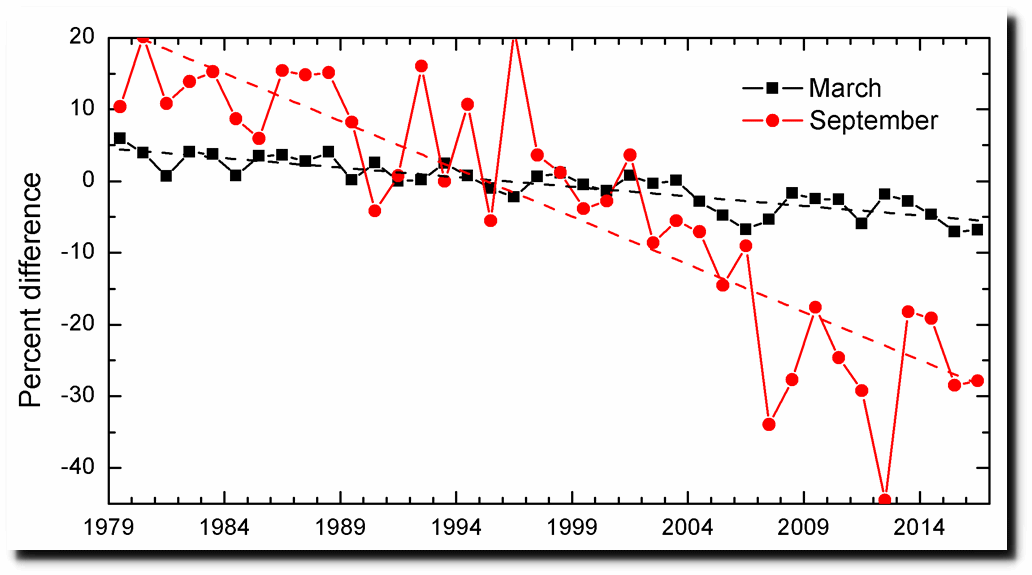
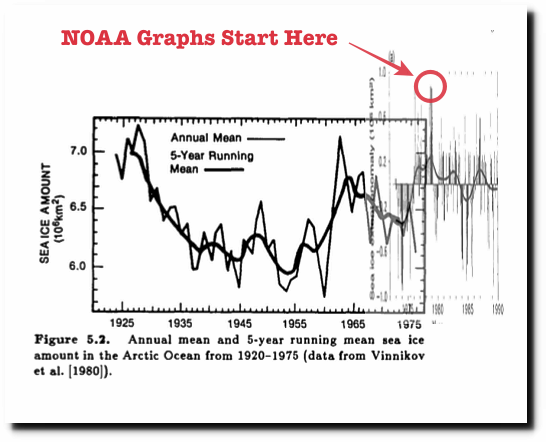
Government agencies like NOAA, NASA and NSIDC start their sea ice graphs in 1979, in order to make it look like there is a linear decline in sea ice.
ftp://ftp.oar.noaa.gov/arctic/documents/ArcticReportCard_full_report2016.pdf
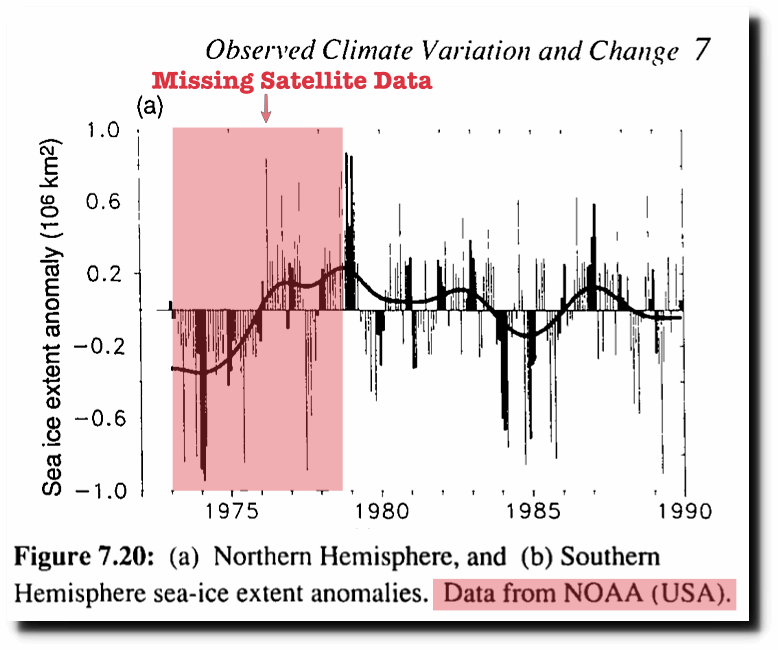
NOAA claims they don’t have satellite data before 1979, but they are lying. The 1990 IPCC report showed NOAA satellite data back to 1973, which was much lower than 1979.
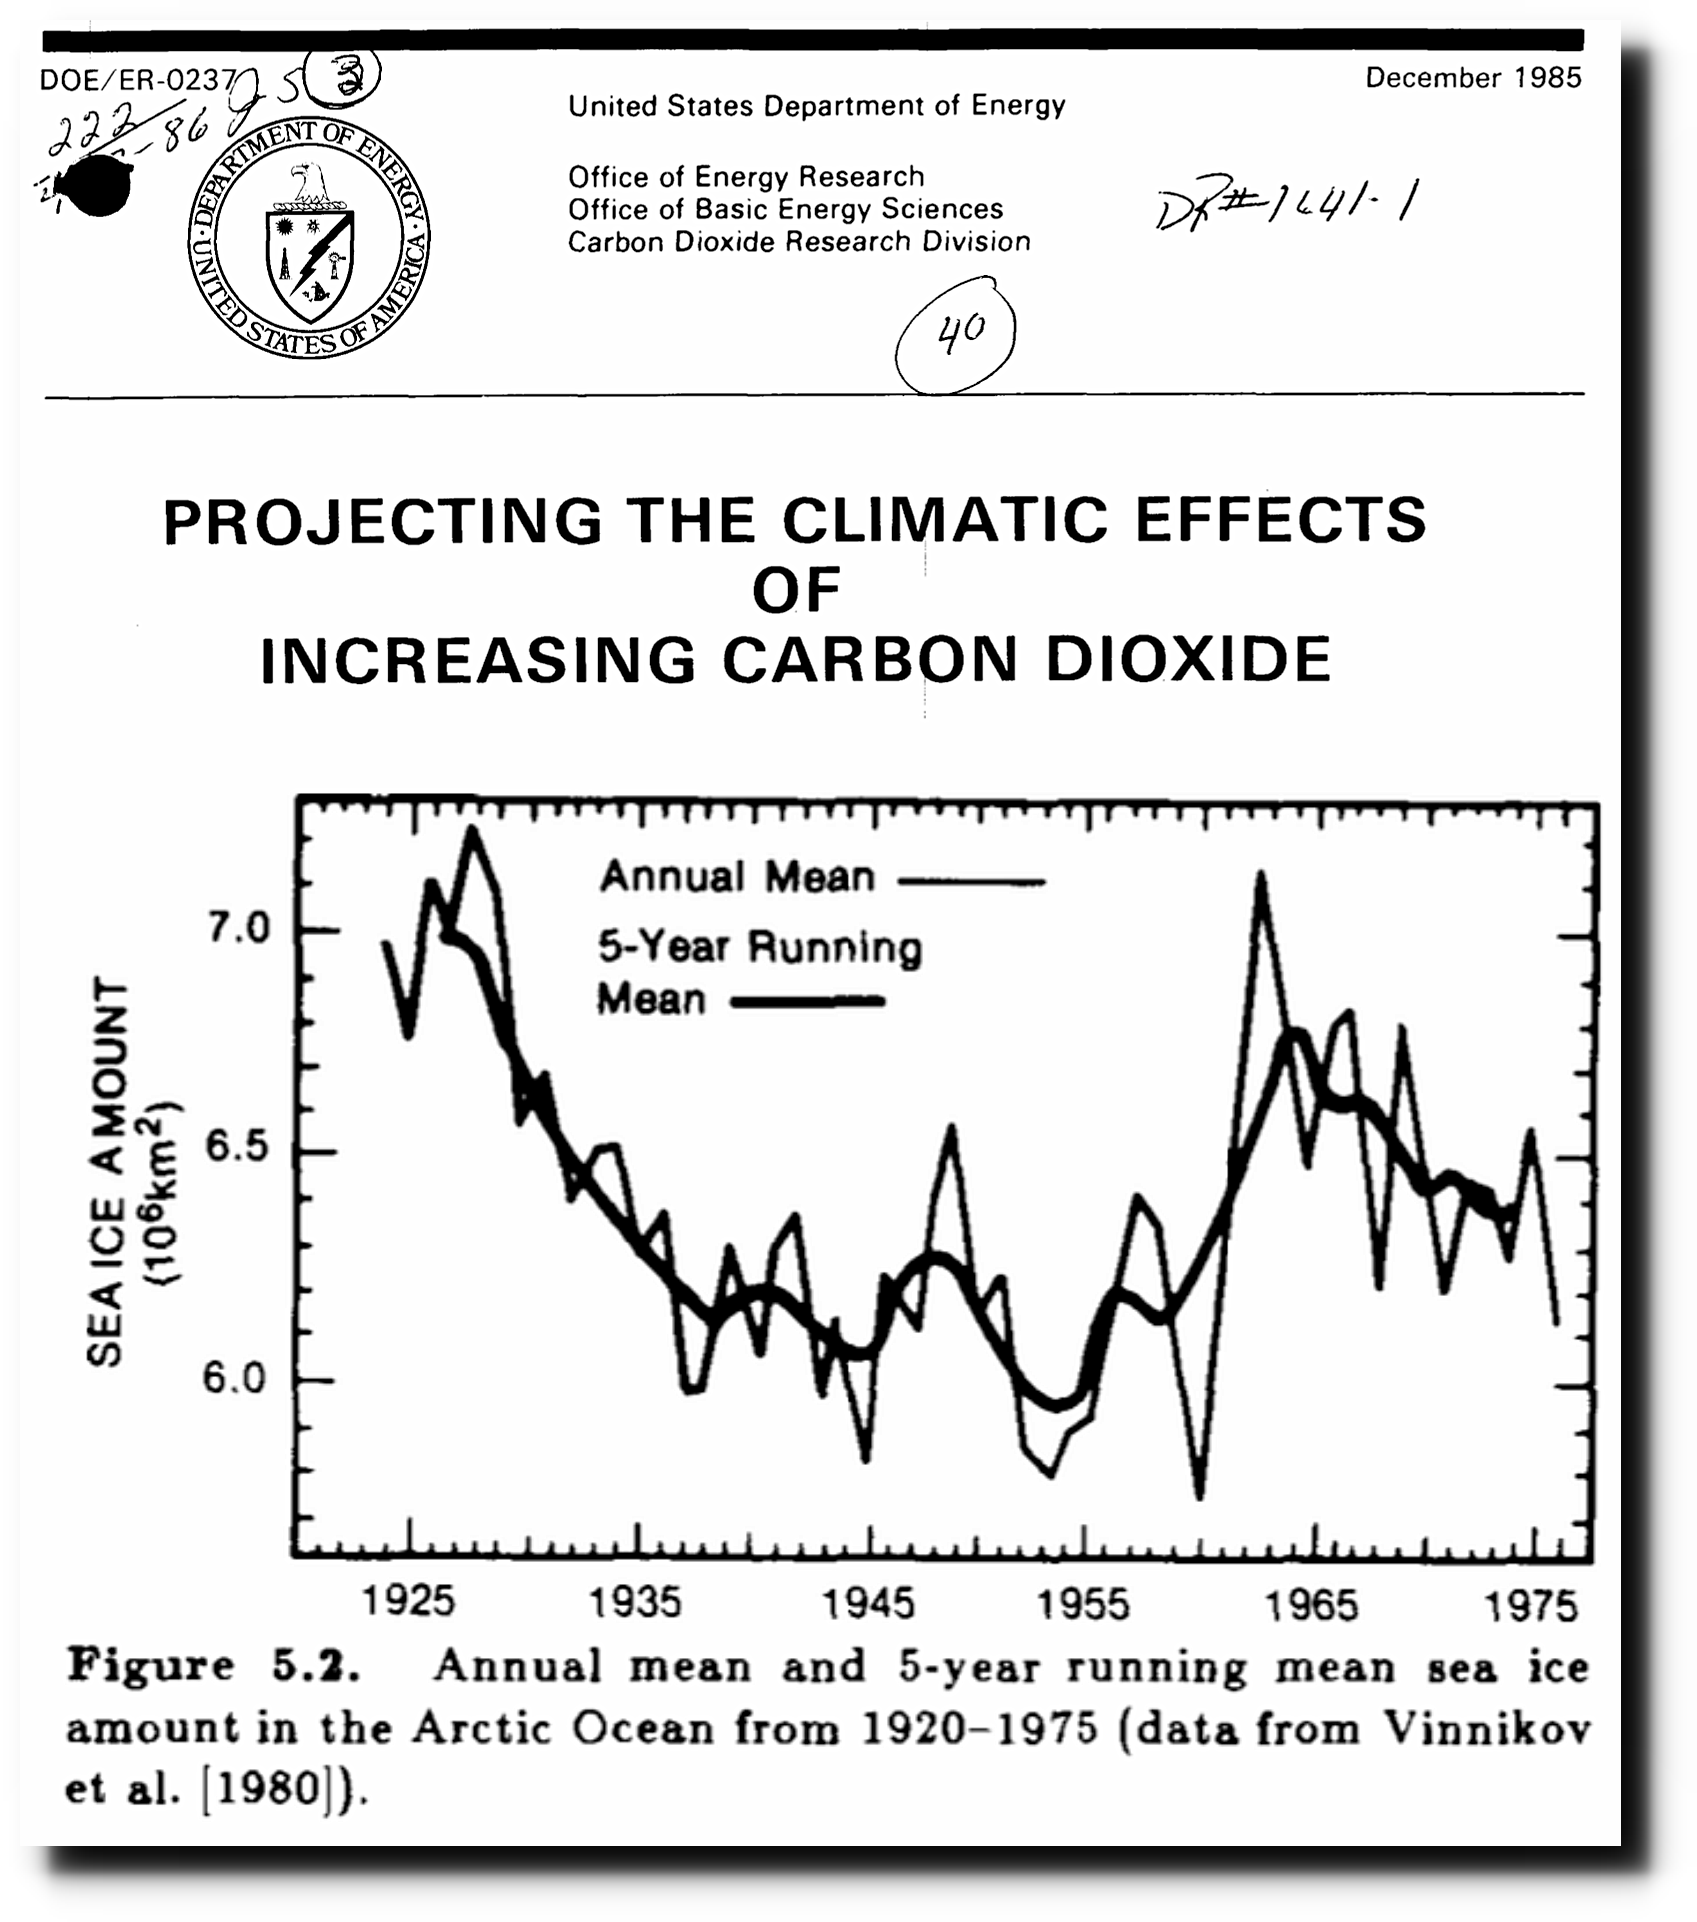
In fact, there is reasonably good ice data going back to the 1920’s, which shows that ice extent was very low in the 1940’s and 1950’s.
Projecting the climatic effects of increasing carbon dioxide (Technical Report) | SciTech Connect
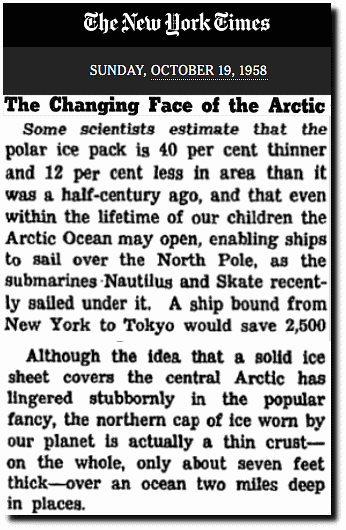
This agrees with historical accounts at the time.
The Changing Face of the Arctic; The Changing Face of the Arctic – The New York Times
I combined the DOE and IPCC graphs, to show what government agencies are up to. They start their linear graphs at the century maximum sea ice extent.
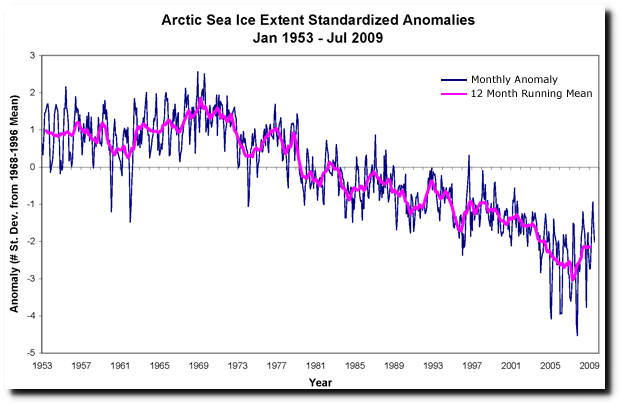
Then fraudsters like John Cook release fake graphs like this, so that they can blame it on “human activity”
Human activity is driving retreat of Arctic sea ice
I do agree that human activity is driving Arctic sea ice fraud by government agencies. There is zero evidence that CO2 emissions have any influence on Arctic ice however.
Tony – Where do NOAA claim, and I quote:
“They don’t have satellite data before 1979”
Do NSIDC claim the same thing?
“the melt area is the largest since the beginning of the satellite era in 1979”
https://www.ncdc.noaa.gov/sotc/summary-info/global/201207
At the risk of repeating myself:
“Do NSIDC claim the same thing?”
They have used the same terminology many times.
NSIDC data is nothing like the original data used by the IPCC.
The only spot NSIDC data matches IPCC 1990 in 2 years 72 73, the rest is complete different because NSIDC have altered the crap out of their data
They also go on to admit that the observed melting is not unusual.
“ice core records indicate that this type of melting occurs about once every 150 years.”
Tony – Why do you claim the graph that you attribute to John Cook is “fake”?
Jim,
Did you even bother to see the chart in the link?
“Mean sea ice anomalies, 1953-2012: Sea ice extent departures from monthly means for the Northern Hemisphere. For January 1953 through December 1979, data have been obtained from the UK Hadley Centre and are based on operational ice charts and other sources. For January 1979 through December 2012, data are derived from passive microwave (SMMR / SSM/I). Image by Walt Meier and Julienne Stroeve, National Snow and Ice Data Center, University of Colorado, Boulder.”
Vague….. 1953-1979
“For January 1953 through December 1979, data have been obtained from the UK Hadley Centre and are based on operational ice charts and other sources. “
“ice charts and other sources”. “other sources” wtf is other sources? lmao!
Fake as heck
“Why do you claim the graph that you attribute to John Cook is “fake”?”
Its John Cook.. so its the obvious starting theory.
Actually , from Cook, lying and fakery and climate change denail would nearly be at the “law” stage, almost up with there Jimbo and griff……. probability = 1
darn typing
“climate change DENIAL”
It seems that, unlike Tony, Tommy managed to follow the link that said “from National Snow and Ice Data Center”
http://nsidc.org/cryosphere/sotc/sea_ice.html
Hence, contrary to Tony’s assertion in his OP, the graph isn’t “fake” and it wasn’t “released by John Cook”.
The graph IS FAKE, Jimbo…. just like your putrid little web site.
EVERYTHING about it DENIES climate history
Jimbo is at the very peak of CLIMATE CHANGE DENIAL, aren’t you Jimbo.
Want to know how we KNOW it is absolutely fake, Jimbo..
Because you have arrived and are trying to say it isn’t.
That is more than enough proof for any rational person to KNOW it is FAKE.
I somehow doubt your evidence would hold up in a court of law Andy.
However you could plausibly describe Tony’s Figure 5.2 as “fake”, but a graph on the official NSIDC web site?
I think not!
Read it again, Jim. It is vague for the period from 1953-1979.
” For January 1953 through December 1979, data have been obtained from the UK Hadley Centre and are based on operational ice charts and other sources.”
Jim probably denies D-O oscillations too that show temps warming 8-10c in a few decades.
Compare that to alleged 1.2c in 130 years.
ugh UGH! Thinking is hard for alarmists.
Tony – I take it that in your extensive search for sea ice “satellite data before 1979” you never stumbled across this page on the NSIDC web site?
https://nsidc.org/data/docs/daac/nsidc0009_esmr_seaice.gd.html
Daily and monthly averaged sea ice concentrations from the Nimbus-5 Electrically Scanning Microwave Radiometer (ESMR) are available for the Arctic and Antarctic from 12 December 1972 through 31 December 1976 at 25 km gridded resolution. Raw data were reprocessed to include ocean masks that reduce weather effects and coastal contamination, and to include a 15 percent ice threshold.
STILL denying Arctic sea ice history, hey Jimbo.
Your little anti-human, anti-climate-change, deceitful, lying agenda is soon coming to a screeching halt, Jimbo
Does that mean you will no longer accept Dr. Manns Northern Hemisphere temperature reconstructions?
Think carefully,Jimmy…….
Very interesting. Would it be possible to make a continuous graph from 1920-2017? Then it would be easier to compare the 1940-60 low with today’s low.
Goodness – the John Cook produced graph imagines that none of us ever saw this, as well:
Crikey!
That’s shows 1968 lower than 1974 which we know was lower than 1979.
I wonder what NOOA’s excuse is?
The dog ate my historical data?
When exposing duplicity and fraud, it may be best to avoid using quotes from the yellow journalist Upton Sinclair.
Just read a depressingly untruthful article
http://gizmodo.com/the-arctic-is-in-such-bad-shape-that-scientists-propose-1792384678
I am sending ryan an email directing him here. I don’t expect anything good to come of it … but you never know.
Griff must have his panties in such a knot that he had a coronary …. no comment so far.
Although I see that Jim crawled out from under his rock.
I don’t hang around here all day like some people!
I might mention that it isn’t just ‘US government agencies’ measuring sea ice -the Germans, Japanese, Russians and Danes all produce figures -and they all support the US/NASA figures…
Like these:
https://seaice.uni-bremen.de/data/amsr2/today/extent_n_running_mean_amsr2_regular.png
https://seaice.uni-bremen.de/data/amsr2/today/extent_n_running_mean_amsr2_previous.png
I see around 14 Wadhams on the chart.
You are pathetic as usual.
Third chart says average yearly was about 6 Wadhams.
so lets do some basic maths (can you handle that, griff.)
Max this year, about 14 Wadhams, Min, about 4 Wadhams
Average.. let me see.. 14 + 4 =18.. divided by 2.. = 9 Wadhams
OOPS, that is WAY more than even 1925. !!
On the Icelandic sea ice charts you can see what happened in the late 1970s.
‘Wadhams’. Like it! :-)
I coined it several months ago. On the record somewhere. :-)
Please use it freely. spread it wide and far
1 Wadham = 1 million km²
I’m glad it was mentioned there are good records going back to the 1920s, because that allows me to mention that all records have been collated back to the 1850s and that at no point in the 20s, 30s or 40s was the sea ice as low as it is now…
No Griff, your “records” ,back to the 1850’s are very LOW RESOLUTION proxy data!
Detailed ice extent records plotted by Canadian, Soviet, Danish and Norwegian weather bureau and shipping, cold war sub plots from beneath the ice… all the available data has been collected. There is masses of it and its of good quality.
And without it, you can’t make any claims on the ice extent being higher/lower in the past, can you?
Griff, you SHOWN why your claim lacked credibility over at the WUWT blog. The 1850 to 1900 part is indeed low resolution.
The “data” is indeed low resolution, because large ares of the ocean were never sampled,that ships intermittently samples the water,using non standard measurement methods.
You have no statistical math skills at all kid.
Ms Griff hates poor brown people, and thinks the Earth is only 167 years old.
Really?
You stoop that low?
Really^n Griff!
Two POS in a pod, killing millions for the love of ice. I would love to know how scumbags like Ms Griff and Jim reconcile this genocide, and sleep at night.
I’m not the denier or perpetrator of leftist genocide, so in other words, I am not the lowlife.
Ms Griff, you could spend your time spreading the truth that Lomborg cited at TED, or can continue advocating for the misallocation of resources that is starving 21,000 people to death every day.
You can deny the truth all you like, while millions starve.
You can deny facts about ice all you like, while millions starve.
But you cannot accuse others of stooping low when you are assisting in genocide.
It should be noted that Ms. Griff doesn’t seem to be a traditional racist.
She doesn’t mind rich brown people in her Capitol city and their fashionable excesses. It’s the suffering poor brown people in faraway Districts she hates and starves to death. There’s just damn too many of them.
She’s an archetypal Capitol citizen of the Hunger Games.
What is an “Standardized Anomaly?” Is that a derivative of homogenized data? And whether the answer to that be yes or no, what is the process of and rationalization for homogenizing data and/or standardizing anomalies? What argument does John Cook provide for doing so and why is his argument argument (in your assessment) a poor reason?
Thanks Tony.
Tony
I must address you directly on this…
The actual sea ice extent in 1979 and in any year since is absolutely established as a fact and cannot have been faked…
The data can be checked against satellite photos and the individual weather/ice warning services of US, Canada, Russia and Norway. The Russian Northern Seaway records… multiple sources.
Not to mention that more than one satellite and country has tracked the extent data.
There can be no doubt that sea ice extent has declined dramatically since 1979 and now is at a record low level in the years of the satellite record.
that’s absolutely a fact and no one has faked any of that extent information, have they?
Griff
How can sea ice extent be at a record low in February? That would have to occur in September.
A lot of MYI blew out of the Arctic during winters from 1988 to 2007. What does that have to do with CO2?
A record low for the month of February.
Is it not of concern that even winter ice is lower than ever before??
And you didn’t answer me: is the extent record a matter of verifiable fact, yes or no?
“is the extent record a matter of verifiable fact, yes or no?’
Most definitely an absolute LIE.
Bio-data clearly indicates that the current level of Arctic sea is really quite high in comparison to Holocene average.
Any more LIES you would like to try to spread?
griff = level 1 CLIMATE CHANGE DENIER.
“Is it not of concern that even winter ice is lower than ever before??”
1. It is NOT lower than ever before… . yet another monumental LIE from griff.
2. Lower Arctic sea ice, if was ever to actually occur, would be nothing than BENEFICIAL for all people living up ther.
Wildlife survived, and THRIVED during much lower sea ice levels in the first 3/4 of the Holocene.
Or are you going to continue to DENY this well established FACT !!
“There can be no doubt that sea ice extent has declined dramatically since 1979”
There is no doubt the late 1970’s was an extreme high for Arctic sea ice.
The Icelandic sea ice clearly shows that., just as it shows a huge drop in sea ice in the 1930-1965 era, as shown by TH above.before
Griff ALWAYS the denier of history.
Relatively high, yes…
But now it is much lower and keeping on down.
It is lower than the 20s through 40s period.
BULLSHIT ,
A simple calculation was shown earlier.
Arctic history shows that 1920-1940 was LOWER
You can see clearly that the 1920-1960 period was a period of lower sea ice.
You are mentally disturbed, CLIMATE CHANGE DENYING LIAR, griff.
Griff,
Do you deny the satellite records prior to 1979 as show in the FAR IPCC report?
what has that got to do with it?
do you deny the decline in ice extent since 1979?
Do you DENY that the Arctic sea ice was FAR lower during the first 3/4 of the Holocene..
I DARE you to put the truth in writing on this site.
Jimbo the arse-wiper never had the guts to…
Come on, griff .. tell the TRUTH for once in your insignificant , meaningless life. !!!
Don’t be willfully obtuse, Griff. The satellite data from 1973 to 1979 clearly shows that picking the 1979 as the starting date for the “official” Arctic ice extent record was an egregious cherry pick. Can’t allow the record to even hint at the possible cyclical nature of arctic ice extent. Wouldn’t want to dilute the message that the Arctic ice is “screaming”.
Don’t be wilfully obtuse Robert. Please explain why Tony starts this satellite temperature graph of his in 1979:
https://realclimatescience.com/2017/02/catastrophic-global-warming-is-fake-news/
An “egregious cherry pick” I suppose?
Don’t be wilfully murderous Jim. Please explain why you are willing to sacrifice tens of thousands daily for your warped agenda.
An “egregious genocide” I suppose?
Jimmy,
Satellite data STARTS in late 1979.
Try explaining why there are no data for 1978:
http://images.remss.com/msu/msu_data_monthly.html
By the way Jimmy,
RSS Satellite data shows a .135C per decade warming trend.
This is well below the IPCC minimum per decade projections to support the AGW conjecture.
Tommy – So was Robert telling porky pies about “satellite data from 1973 to 1979”?
Honestly, I have never seen such a gleeful ghoul as Jim. Shamelessly putting millions to death.
Griff,
The NOAA and the IPCC thought the 1972-1979 sea ice were credible,how come you don’t?
It was clearly lower in the early part of the 1970’s.
Your warmist bigotry is in full force here.
Jim,
You are here to sow confusion with your dishonest statement:
“Tommy – So was Robert telling porky pies about “satellite data from 1973 to 1979”?”
You know perfectly well that SEA ICE Satellite data, existed from 1973-1979.
RSS Satellite TEMPERATURE data, started in January 1979.
You make clear here,that you want to create fog.
I’m simply trying to clear away the fog Tommy!
Which sensors on which satellites do RSS et al. use for the raw data that they feed into their TEMPERATURE algos?
So NOAA specifically show ice records cherry picked from 1979 because ice extent was unusually high, but despite having previously published 70’s data they ignore the 1970’s when ice extent was lower, and then also ignore the 50’s and 40’s when they were even lower than the already low 1970’s. You just have to laugh otherwise you’d cry. Meanwhile the Guardian, UK MO, IPCC, NASA, NOAA and Uncle Tom Cobley and all claim this is legitimate ‘settled science’. Lol.
It’s so wilful it can only be a deliberate intention to mislead, there can be no other explanation for such blatant ignoring of earlier data simply because it f*cks their theory. On the back of this misdirection hangs Green Blob jobs paying suitably vast salaries, research grants worth millions and government policies worth $billions. RICO indeed. You can’t say there’s not dark humour in this level of world class criminality, it’s brilliant. Al Capone will be spinning in his grave with envy.
If there’s any justice in this world president Donald J Trump will rinse these cheats and liars out of their positions of influence and straight to the state pen’. For a very long stretch.
But the ice extent has been steadily declining since 1979, hasn’t it?
and is now at a record low since 1979, isn’t it?
and that record low is lower than in the 20s thru 40s period, for which we have good records, is it not?
so the ice is declining, yes?
LOL, Griff is losing her faith.
?
I’m consistently putting the actual evidence – you? You can’t argue against it can you, so we get this guff…
You are a piece of work. NO ONE denies that the sea ice extent has been declining since 1979 but you deny that choosing 1979 as a starting point for a discussion is cherry picking. Poor Griff, confirmation bias is bitch and all you can do is sing la la la when you are confronted with facts concerning longer time scales. End of feeding you troll girl
But, but, but….
Tommy insists that “Satellite data STARTS in late 1979”!
No Jim,
I make clear that RSS Satellite based TEMPERATURE data starts in 1979.
You are trolling now,deliberately trying to create confusion.
At the risk of repeating myself, please see:
https://realclimatescience.com/2017/02/visualizing-government-arctic-sea-ice-fraud/#comment-41147
You have been shown MULTIPLE TIMES that 1979 was a very extreme year for Arctic sea ice.. up there with the latter part of the Little Ice Age.
DENY, DENY that is the only ting you have left to fall back on, isn’t it, worm.
You say you don’t want warming, yet you live in a heated inner-city ghetto.
Such HYPOCRISY …. such anti-human deceit.
“and that record low is lower than in the 20s thru 40s period”
BULLSHIT. !!
Prove it. Cite your best evidence for the extent level in the 1940s.
(1943 would be a good bet for lowest – hint!).
Do cite the research on Dr Judith Curry’s blog into historical ice levels, where it is acknowledged the lows in the 40s were not lower than 2007 and after.
Just IGNORE the DOE data above..
Ignoring data is what you do.
Ignore the Icelandic sea ice charts.
Ignoring data is what you do.
I suspect there may be an effect from diesel particulates too. There’s been a massive rise in diesel engine use in the last thirty years. All that albedo changing pm2.5 soot, which Tony has pointed out in several posts before.
That is anthropogenic but isn’t CO2 related.
And with the increased use of wind turbines, the use of diesel generators will skyrocket.
The AGW scammers ate so dumb.. basically everything they do has no effect or the opposite effect to what the wanted…
…. except the decimation of economies…
… and senior population reduction..
this keyboard is weird…. ate -> are.
No it won’t -and the use of particulate producing coal power plants will fall. It has in the UK.
You are again displaying your ABJECT IGNORANCE.
the UK has huge ranks of DEISEL generators for the many times that wind is useless
A modern coal fired power station produces basically zero particulates.
But when have FACTS ever been something you have been remotely interested in.!!!
“It has in the UK.”
and look at the energy poverty now ensuing…
…as if you CARE. !!
You really are at the very bottom of the human decency scale, aren’t you griff
The climateers have in an endless stream predicted the ice would disappear.
So why have not even a single scientist ever said that it is better than we thaught?
They thaught it would have disappeared and is still there, so obviously it must be better than thaught.
The word “scientists” makes me laugh. More like paid propagandists.
It is going… and quite quickly on a geological time scale.
do you have any evidence it is NOT declining?
Plenty of evidence that it is NOWHERE NEAR the levels of the first 3/4 of the Holocene..
…you know, the period before the LIA.
You continue to be an avid DENIER of climate change history.
You are right at the top of the list of CLIMATE CHANGE DENIERS…..
… up there with Jimbo the clown.
We aren’t back then.
What concerns us is its current rate of decline towards a likely ice free summer arctic ocean…. with current extent lower than the previous ‘cycle’ in the 20s thru 40s.
The reasons for the previous low ice in the Eemian were entirely related to the Earth’s orbit, which has since moved on to a different part of its (Milankovitch) cycle. The early Holocene is utterly irrelevant to current conditions.
Who is “us”?
Ha ha ha,
there it is folks, Griff doesn’t care that it was much lower for most of the Holocene. That Polar Bears and Eskimos lived through it.That the ecosystem didn’t crash. That super molecule has nothing to do with it since it stayed around the 260-280 level for most of the inter glacial period.
He want to cry over a tiny time frame of a much higher than average ice pack of today,because he is a confirmed warmist bigot.
DENIAL of climate history.. the only way you can support you brain-washed belief in you fake AGW religion
Cherry pick the extreme of 1979 as the starting point.. and DENY any other part of the AMO cycle.
You do know what the AMO is, don’t you griff… or are you remaining forever WILFULLY IGNORANT???
“The early Holocene is utterly irrelevant to current conditions.”
run and hide from the facts you don’t like, hey griff.
They are highly relevant because they show the conditions before the plunge into the Little Ice Age.. the COLDEST period in the last 10,000 years, which the world has just managed to crawl out of.
Arctic sea ice levels are STILL anomalously high compared to all but that COLDEST of periods, that’s because the world is only a small, but highly beneficial, bump in temperature above that bleak period.
You need to get out of your heated inner city latte ghetto, go to Siberia, and see how you like the climate there.
Get some rationality and perspective into your cotton-wool wrapped meaningless existence.
I very much enjoyed reading this string ….Why does there seem to be very little mention of solar activity as it relates to climate change? And why is there very little mention of the effects of volcanic activity on climate change? I have read it has been estimated that the Mt. St Helens eruption emitted more C02 into the atmosphere than all man made activity to date up to that point. There were 66 major volcanic eruptions in the 1900’s with 6 the size of Mt. St Helens or larger
Because solar activity is ‘low’ and has been for a decade and is not a prime driver of the current climate…
Because human produced CO2 vastly exceeds volcanic emissions (and no, there are not a lot of undersea volcanoes producing CO2 we don’t know about)
simply the sun and volcanoes, while climate drivers, are not major influences at this time.
“Because solar activity is ‘low’ and has been for a decade and is not a prime driver of the current climate…”
LIAR…. and a moron.
Do your really think with the world being 70% surface area H2O it responses immediately…. a lag of some 11-15 years has been identified by REAL SCIENCE….
… ie , the sort you know absolutely NOTHING about
and yet for the past decade we have been seeing rising global temps…
They rise because the warmist bigots fiddles with the surface temperature data over and over.
Meanwhile Satellite data shows a very different picture,but that would impinge on your warmist religion beliefs.
You are willing to lie to yourself every day.
And yet there are hardly any all-time high temp records being broken. Whenever there are claims of high temp records being broken, it is only over a much shorter timespan. I wonder why that is? Probably because it is an inconvenient truth that it is NOT actually hotter than it ever was.
What you are seeing is claims of rising global temps based on ‘adjusted’ data. You are so gullible for believing the lies, especially when there is so much here pointing at the truth.
I think it time for another Swift-like satire about ‘gullibles travels’ … the journey of a confirmed CAGW believer who refuses to believe he has been lied to over and over and over again.
LIES again.. LIES is all you seem to have. !!!
DENIAL of facts is the only way you support your waste of a climate religion.
Apart from the El Nino, there has been NO WARMING since the end of the previous El Nino in 2001.
“Because human produced CO2 vastly exceeds volcanic emissions (and no, there are not a lot of undersea volcanoes producing CO2 we don’t know about)”
MORE BULLSHIT.
Yet a couple of years ago a whole island chain just appeared.
Your base-level IGNORANCE is way past the stage of being even slightly humorous
“According to the U.S. Geological Survey (USGS), the world’s volcanoes, both on land and undersea, generate about 200 million tons of carbon dioxide (CO2) annually, while our automotive and industrial activities cause some 24 billion tons of CO2 emissions every year worldwide. ”
https://www.scientificamerican.com/article/earthtalks-volcanoes-or-humans/
Nature emits about 96% of the total yearly CO2.which leaves the rest with Mankind.
You are as usual wrong.
A February 2013 estimate by a team led by Mike Burton, of the Italian National Institute of Geophysics and Volcanology was just shy of 600 million tons of CO2 emitted by volcanic degassing.
And there is now evidence that volcanoes thought to be inactive still make substantial CO2 contributions. As much as half of what active volcanoes contribute. This would skyrocket the number of degassing peaks to more than 500.
Termites alone produce more greenhouse gases than mankind…
Now researchers report that termites, digesting vegetable matter on a global basis, produce more than twice as much carbon dioxide as all the world’s smokestacks.
Between their methane and carbon dioxide production, some estimates put the number at ten times what humans produce. For every human, there is estimated to be over 1000 pounds of termites.
Interesting trivia, but still not worth sacrificing 21,000 people daily.
Poor Griff, you should start looking for help since it looks like you are about experience a true wake-up call:
http://www.climatedepot.com/2017/02/14/supreme-court-justice-samuel-alito-carbon-dioxide-is-not-a-pollutant/
I think the subject – which you are trying to avoid -is the ice.
The ice extent records are watertight aren’t they? you can’t dispute the record from 1979 on and you can’t dispute the decline it shows.
This is like saying you have the flu and your high temp is normal….
Ms Griff continues to cherry pick dates, while another 21,000 innocent humans starve to death, again today.
The one fact we cannot dispute is that resources would be better spent saving human lives. But then Ms Griff apparently hates poor brown people.
LOL, the one who brought CO2 to the table was you Griff. You are truly dim troll.
Yet you totally ignore climate history and Arctic sea ice history before the LIA. and around 1920-1950
Griff.. CLIMATE CHANGE DENIER, #2
Griffy is talking about WEATHER 2017 minus 1979 is ONLY 38 years. Hardly a full climate cycle which would be a minimum of 14-1500 years. (one D-O/Bond cycle)
So as Andy keeps saying Griffy is a Climate Denier because she doesn’t even understand the difference between weather aka signal noise and climate.
Griffy, these are your REAL climate changes — Dansgaard-Oeschger events — and they are 8 to 16C changes within a decade or two. So quit hyperventilating over a couple hundreths of a degree change.
Wow. Tony – you should sell tickets to this thread! Fabulously interesting.
February 1, 2017 Arctic sea ice VOLUME was ~ 2500 cubic kilometers less than to date February 1, 2016. As a TREND, February 1, 2017 Arctic sea ice VOLUME is 10,600 cubic kilometers LESS than the average February 1, year sea ice VOLUME of the 1980’s. The energy to melt such a cube of ice (almost 22 kilometers by 22 kilometers by 65000 feet high) is about 33 times the annual energy used by the United States of America. Lesser ice losses are occurring in the Antarctic (but increasing).
For 385 STRAIGHT months, global Earth temperatures have been above the 20th century average. This has occurred DESPITE the solar TSI energy output being languid for decades, & below normal for 10 years (including a 3+ year period of low solar TSI energy setting a 100 year low). When the sun returns to normal (& it will because it has INCREASED very slowly for 5 billion years), AGW effects will increase strongly. In late 2016, the Present High Arctic Berserker, or PHAB, or FAB ( over- temperatures on nearly 4 million square kilometers of the High Arctic), jumped to 20degC over-temperature. MIND YOU!! This is NOT a local city temperature over say a 20 kilometer by 20 kilometer square. It is over a square almost 2000 kilometers by 2000 kilometers. Within the last 2 years in the MIDDLE OF WINTER, our Earth’s North Pole heated above the freezing point of water for short times, on three occasions.
You are talking about WEATHER not climate.
The Arctic was ICE FREE during the summers during the earlier part of the Holocene.
GLACIAL ADVANCE
STUDY #1
Ice free Arctic Ocean, an Early Holocene analogue
STUDY #2
Temperature and precipitation history of the Arctic
STUDY #3
A new approach for reconstructing glacier variability based on lake sediments recording input from more than one glacier January 2012
The highest glacier growth started 600 years ago prior to that most glaciers had melted away.
STUDY #4
A 10,000-Year Record of Arctic Ocean Sea-Ice Variability
10,000 years of Greenland Temperature from Ice Core
SEA LEVEL IS NOT RISING
In tectonically inert places (neither land rising nor subsiding) such as the Gulf of Maine the level recorded by the Portland Maine Tide Gauge in 2014 is IDENTICAL (to the millimeter!) to that measured in 1947.
Notice the area where Roman sea ports are inland is tectonically stable according to NASA.
List of Roman Sea Ports found inland
(Has great pictures and maps.)
For the areas occupied by the Romans it was pretty close to zero or actually sinking! “..the pivot point is rather abrupt; Scotland is still rising due to the rebound effect which is correspondingly sinking England 2 millimetres into the North Sea each year.”
https://i0.wp.com/basementgeographer.com/wp-content/uploads/2013/05/PGR_Paulson07_big.jpg
PEER-REVIEWED PAPERS PROVING SEA LEVEL IS NOT RISING
STUDY #1
Mid to late Holocene sea-level reconstruction of Southeast Vietnam using beachrock and beach-ridge deposits
Translation the sea level was up to 1.5 meters higher than today in a tectonically stable area ~5000 years ago to 2000 years ago. Tectonically stable area refers to areas devoid of deformation such as all processes which modify the external form of the crust. For example unidirectional vertical movements, plate tectonics and also the rise and fall of the solid earth surface, especially in coastal areas, caused by external factors such as climate change (gio-isotasy, hydro-isotasy)
STUDY #2
Sea-level highstand recorded in Holocene shoreline deposits on Oahu, Hawaii
This study shows a sea level highstand ~1.6 meter above the present level from ~5500 years ago to 2000 years ago.
STUDY #3
Late Quaternary highstand deposits of the southern Arabian Gulf: a record of sea-level and climate change
This study shows a sea level highstand ~1 to 2 meters above the present level about ~5500 years ago.
STUDY #4
The Quaternary Geological History of the Santa Catarina Southeastern Region (Brazil)
In the body of the text is this:
This study shows a sea level highstand ~ 4 meters above the present level about ~5000 years ago. With sea level oscillating since then. Not only has the sea levels have dropped since the Holocene Optimum the evidence shows that “warmer paleotemperatures were favourable for great proliferation of mollusks in the area”
Santa Catarina Brazil is at latitude 27.2500°S and is tectonically stable.
STUDY #5
Holocene sea-level change and ice-sheet history in the Vestfold Hills, East Antarctica
The above is a RELATIVE sea level. The area is not tectonically stable because the area has isostatic uplift in response to deglaciation from the Wisconsin Ice Age. The same applies to the following study.
STUDY #6
A new Holocene relative sea level curve for the South Shetland Islands, Antarctica
Dear lite-headed.
It good that you have illustrated you have zero idea about the WEATHER event that have caused a very minor slowness in sea ice formation
Now haw about you also look at the flip side of this WEATHER event, the massive cold anomalies over Northern Russia all year, and the freezing cold front that have rattled through Canada , Alaska and northern USA.
Or do you care more about a trivial reduction in Arctic sea ice more than the people who have actually DIED because of those cold anomalies?
Furthermore, it seems that you are totally ignoring the FACT that 1950 sea ice was about on par with now, and for the first 3/4 of the Holocene, sea ice was often ZERO in summer.
Or are you also a CLIMATE CHANGE DENIER, like Jimbo and griff.
The REAL climate debate is about when to expect the next glacial inception.
—-You really didn’t expect the Elite to clue in the Great Unwashed now did you? Instead you see them, including the US Universities, buying up farmland in non-glaciated areas like Africa, South America and Australia all the while yammering about a Population Bomb and de-industrializing the USA….
The switch from full bore industrial manufacturing to killing off Western Civilization came in the early 1970s right around the time Shackleton provided evidence that Milancovitch was correct. Coincidence?? —-
The Berger and Loutre’s 2002 modeling is what NASA/NOAA uses to say the current Ice Age has ended and the earth will not go back into glaciation.
Lisiecki and Raymo, (2005) essentially quashed the Berger and Loutre’s 2002 model using REAL data and no one has come forward with anything supporting an extended Holocene since then.
A Pliocene-Pleistocene stack of 57 globally distributed benthic D18O records
Lisiecki & Raymo
Or there is this paper a couple years later.
“Because the intensities of the 397kaBP and present insolation minima are very similar, we conclude that under natural boundary conditions the present insolation minimum holds the potential to terminate the Holocene interglacial.” http://folk.uib.no/abo007/share/papers/eemian_and_lgi/mueller_pross07.qsr.pdf
What we do know is that the past 6 interglacials, dating back to the Mid Pleistocene Transition, have lasted roughly half of a precessional cycle, or 11,500 years. The present age of the Holocene is 11,720 years or about two hundred years past the due date. Therefore the Little Ice Age should have been glacial inception.
So what happened?
The Grand Solar Maximum, highest in 3,000 years that has just ended. See: A History of Solar Activity over Millennia Usoskin et al. This is a very good paper using multiple methods to validate their results.
Ice cores from the Freemont Glacier show it went from Little Ice Age cold to Modern Warming warm in the ten years between 1845 and 1855. Naturally.
If you look at the Sunspot graphs and apply Dr Evan’s ~11 year Notch-Delay Solar Theory the match is spot on.
PLEASE NOTE: there is a DELAY between sunspot changes and Earth climate of more than a decade!
Next question is how long is the Transition?
“This record also reveals that the transitions at the beginning and end of the interglacial spanned only ~100 and 150 years, respectively.” (wwwDOT)pnas.org/content/104/2/450.full
Actually Alley showed the flip from Wisconsin Ice Age to Holocene happened in THREE YEARS!
AND if you want to get into ‘solar TSI energy’….
A newer paper from the fall of 2012 Can we predict the duration of an interglacial? agrees with the Lisiecki & Raymo paper and gives the calculated solar insolation values @ 65N on June 22 for several glacial inceptions:
Current value – insolation = 479W m−2 (from that paper)
MIS 7e – insolation = 463 W m−2,
MIS 11c – insolation = 466 W m−2,
MIS 13a – insolation = 500 W m−2,
MIS 15a – insolation = 480 W m−2,
MIS 17 – insolation = 477 W m−2
(Changes near the north polar area, about 65 degrees North, are considered important due to the great amount of land. Land masses respond to temperature change more quickly than oceans.)
Looking at it the other way round using NOAA’s numbers (Berger) @ 60N not 65N
(www1DOT)ncdc.noaa.gov/pub/data/paleo/climate_forcing/orbital_variations/berger_insolation/insol91.jun
Holocene peak insolation: 523 Wm-2
……………………………………………..decreased = 47 Wm-2
NOW (modern Warm Period) 476 Wm-2
…………………………………………….. decreased = 12 Wm-2
Depth of the last ice age – around 464 Wm−2
11,000 years ago…………… 523.16 Wm-2 peak insolation
Wisconsin Ice age- Holocene transition
12,000 years ago…………… 522.50 Wm-2
So once the Earth flips into the Ice Box mode there is no going back. The earth barely made it out of the Wisconsin Ice Age with the peak insolation ~ 523 Wm-2 and we are now at 476 Wm-2, only 12 Wm-2 above the depths of the Wisconsin Ice Age. So if circumstances (sleepy sun, massive volcanic activity, Dansgaard-Oeschger event….) flip the earth into glacial termination nothing will switch it back. The solar energy is just not there.
The ClimAstrologists are saying that this solar insolation change over the Holocene is going to be trumped by CO2 forcing yet the entire CO2 forcing is 32 to 44 W m–2 [cf., Reid, 1997] and all but 5 to 6 W m–2 of that forcing occurs in the first 200 ppm CO2 (modtran) A CO2 concentration where plants barely survive.
So why ever would anyone in their right mind want to DECREASE CO2, the only possible prevention of glacial inception, during the tail end of the Holocene especially when research shows Carbon starvation in glacial trees recovered from the La Brea tar pits, southern California??? Remember, thanks to Henry’s law colder ocean water will suck down a lot of the CO2 now in the atmosphere.
>>>>>>>>>>>>>>>>>>>
Oh, and the current polar vortex sucking warm air into the Arctic and cold air over Siberia and Canada that worries you so? That is signs of COOLING not warming. ?
Shocking Polar Vortex From 20,000 Years Ago