By Richard Muller on December 17, 2003
Let me be clear. My own reading of the literature and study of paleoclimate suggests strongly that carbon dioxide from burning of fossil fuels will prove to be the greatest pollutant of human history. It is likely to have severe and detrimental effects on global climate. I would love to believe that the results of Mann et al. are correct, and that the last few years have been the warmest in a millennium.
Medieval Global Warming – MIT Technology Review
“It is ironic if some people treat me as a traitor, since I was never a skeptic”
- Richard Muller November 3, 2011
Richard Muller, Climate Researcher, Navigates The Volatile Line Between Science And Skepticism
Six years ago fake climate skeptic Richard Muller announced that he did his own temperature data set funded by the Koch Brothers, and global warming was so bad he was no longer a skeptic. All skeptics were now conspiracy theorists. Earth warmed 0.6C in a hockey stick from 1958 to 1995.
Climate change: A record-making effort | The Economist
This negated the work of the IPCC conspiracy theorists, who showed no troposphere warming from 1958 to 1995.
https://www.ipcc.ch/ipccreports/sar/wg_I/ipcc_sar_wg_I_full_report.pdf
Satellites continue to be conspiracy theorists, showing little or no net warming over the past 25 years.
Wood for Trees: Interactive Graphs
The global surface temperature record is garbage. Mosher@berkeleyearth kindly explained that you can get whatever shaped graph you want by cherry-picking stations and methodologies.
The US space agency has known for 25 years that the surface temperature record is garbage, yet they ignore their own satellites because they can’t manipulate them to produce funding friendly fake temperature graphs.
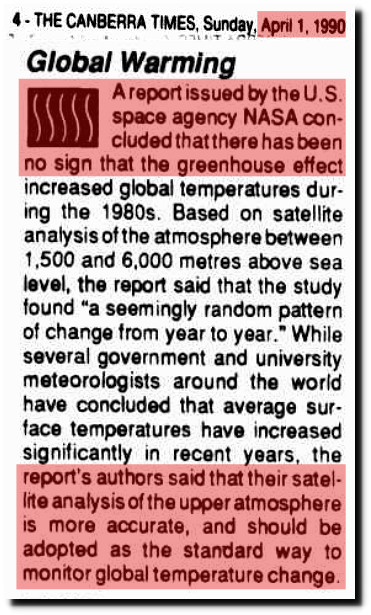
01 Apr 1990 – EARTHWEEK: A DIARY OF THE PLANET Global Warming
The surface temperature record is so bad, NASA can change the data at will to produce the desired results. And they do.
Climate alarmists love to make hockey sticks by data tampering.
Surface temperatures allow NASA and NOAA to take no data, and turn it into record heat.
Fake red maps produce funding, Blue and gray maps are politically useless. This is the biggest science scam in history.
This is the biggest scam in history, not just science.
Need I say more?
Yep. Answer the question.
If alarmists were starving your family to death, would you do anything differently?
And why the 1979 cherry pick?
Alarmist much? Genocide much, Jim?
These were the bad projects. As you might see the bottom of the list was climate change. This offends a lot of people, and that’s probably one of the things where people will say I shouldn’t come back, either. And I’d like to talk about that, because that’s really curious. Why is it it came up? And I’ll actually also try to get back to this because it’s probably one of the things that we’ll disagree with on the list that you wrote down.
The reason why they came up with saying that Kyoto — or doing something more than Kyoto — is a bad deal is simply because it’s very inefficient. It’s not saying that global warming is not happening. It’s not saying that it’s not a big problem. But it’s saying that what we can do about it is very little, at a very high cost. What they basically show us, the average of all macroeconomic models, is that Kyoto, if everyone agreed, would cost about 150 billion dollars a year. That’s a substantial amount of money. That’s two to three times the global development aid that we give the Third World every year. Yet it would do very little good. All models show it will postpone warming for about six years in 2100. So the guy in Bangladesh who gets a flood in 2100 can wait until 2106. Which is a little good, but not very much good. So the idea here really is to say, well, we’ve spent a lot of money doing a little good.
And just to give you a sense of reference, the U.N. actually estimate that for half that amount, for about 75 billion dollars a year, we could solve all major basic problems in the world. We could give clean drinking water, sanitation, basic healthcare and education to every single human being on the planet. So we have to ask ourselves, do we want to spend twice the amount on doing very little good? Or half the amount on doing an amazing amount of good? And that is really why it becomes a bad project. It’s not to say that if we had all the money in the world, we wouldn’t want to do it. But it’s to say, when we don’t, it’s just simply not our first priority.
http://www.ted.com/talks/bjorn_lomborg_sets_global_priorities/transcript?language=en
And that is why Bjorn Lomborg, After the Snowflakes tossed a temper tantrum, was dis-invited to Australia.
Funny how the Communist Snowflakes always stage an ASTROTURF temper tantrum, whenever anyone gets close to telling a lot of people the truth. Like Milo has now been successfully driven off stage just like Bjorn Lomborg, Dr Gray, Dr Happer and many many more.
So far they have not quite succeeded in muzzling President Trump but they are sure trying.
Jim likes 1979, because …. junk science
Isn’t the AMO on something like a 50-70 year cycle?
YES!
That is why it is NOT climate it is weather. But the Lying ClimAstrologists are not going to tell people that.
See how Jimmy Boy defines the 40 year RISING section of a ~70 year cycle?
definesdefendsJimmy Boy also defines 40 years as climate when it is anything but.
Its WILFUL IGNORANCE.
Jimbo cannot afford to learn the truth or ever tell the truth, his Exeter Uni buddies will withhold their “favours”.
Its all just a pitiful and desperate plea for some sort of attention from a lonely, slimy, coward.
Isn’t it Jimbo.!
It’s a graph, Jim, but not as we know it.
Tony – At the risk of repeating myself, the NSIDC’s Sea Ice Index starts in 1979 because SMMR first flew in 1978:
https://nsidc.org/data/docs/daac/smmr_instrument.gd.html
…and 1975 was the dark ages
Jim, that is well known, but YOU and other warmist cherrypickers ignore the previous good quality sea ice data,because it shows lower levels back to the early 1970’s.
It was considered good back in 1990 by the NOAA when they published this report:
Climate assessment, a Decade review 1981-1990
Starting on page 59,covering the Snow and Ice section. There they used the 1973-1990 satellite data for the report.
https://www1.ncdc.noaa.gov/pub/data/cmb/bams-sotc/climate-assessment-1981-1990.pdf
At the risk of repeating myself, what’s this Tommy? Scotch mist?
It sure ain’t food!
At the risk of repeating myself.
Genocide Jim, if it was your family being starved to death by alarmists, would you do anything differently?
Then you have no objection, that we use satellite data from 1973 onward,since you didn’t dispute my post at all.
Your reply post, is a good example of deflection. It is desperate and stinks.
You still haven’t addressed Tony’s sea ice chart from 1920-1975.
Snicker.
GEE, Arctic Sea Ice EXTENT STANDARDIZED anomaLIES aka dog vomit from the ClimAstrologists.
If it is NOT RAW untouched DATA then it is LIES.
Sorry Jimmy Boy we have figured out that Governments and their paid shills LIE when ever they get the scent of a new way to extract more money from the working stiffs.
Genocide Jim, you love repeating yourself, and repeating the slaughter of 21,000 innocent humans daily.
Your excuse for cherry picking 1979 would be pathetic, if it wasn’t so deadly for millions.
Please keep ignoring the slaughter, and advocating against saving human life. It makes dismissing you assholes snd your disgusting agenda simple, and it turns fence sitters away from your cult of death.
The 1990 IPCC report had satellite Arctic sea ice data back to 1973
Jim, please explain what real impact has this had on anybody living on this planet? And your ‘feelings’ don’t count, they aren’t real. Also, please refrain from using the words could/might/possibly etc. Hypothetical aren’t real either.
The natural drop in Arctic sea ice is a MASSIVE BENEFIT to all those people living in the area.
Fishing, commerce, transport become possible for a small part of the year.
Still a long way to drop before the Arctic becomes usable like it was for all but the last 500 or so years of the current interglacial.
“Need I say more?”
Yes Jimbo, you could put the minor cyclic based decline into proper perspective by saying that the current level is still a lot higher than about 95% of the last 10,000 years.
But the TRUTH is not, and can never be, part of anything you say.
You NOTHING but a LIAR and a low-level CON/SCAM slimebag.
Is the data set of the GISS version 2000 available through the Internet? I woud like to have the original source of the data:
I think it is at the same NASA link