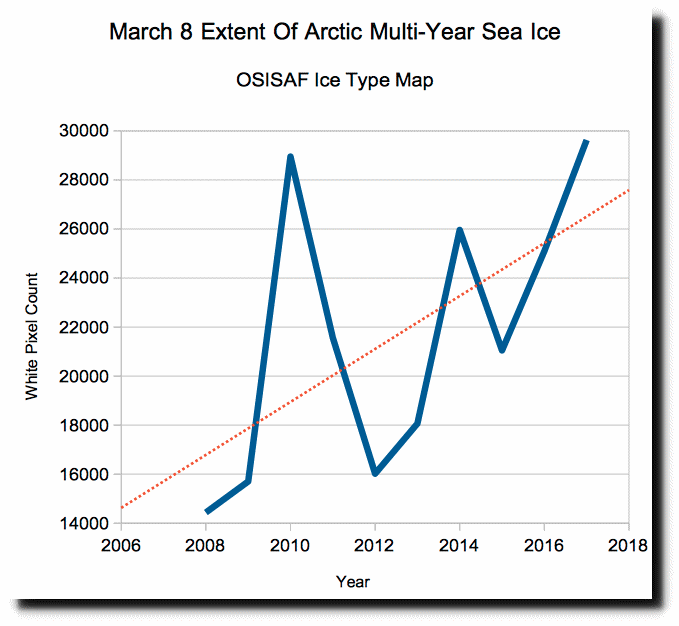
Exact opposite of claims by climate fraudsters, the extent of multi-year sea ice is growing and at a ten year high. I generated the graph by pixel counting the white pixels, which represent multi-year ice. The map below is 3/8/2017.
Email Subscribe
Disrupting the Borg is expensive and time consuming!
-
Recent Posts
Recent Comments
- Robertv on New Video : Doing The Right Thing
- G W Smith on ABC News – Testosterone Causes Bush Fires
- czechlist on Arctic Fraud Approaches A Tipping Point
Archives
- December 2019
- November 2019
- October 2019
- September 2019
- August 2019
- July 2019
- June 2019
- May 2019
- April 2019
- March 2019
- February 2019
- January 2019
- December 2018
- November 2018
- October 2018
- September 2018
- August 2018
- July 2018
- June 2018
- May 2018
- April 2018
- March 2018
- February 2018
- January 2018
- December 2017
- November 2017
- October 2017
- September 2017
- August 2017
- July 2017
- June 2017
- May 2017
- April 2017
- March 2017
- February 2017
- January 2017
- December 2016
- November 2016
- October 2016
- September 2016
- August 2016
- July 2016
- June 2016
- May 2016
- April 2016
- March 2016
- February 2016
- January 2016
- December 2015
- November 2015
- October 2015
- September 2015
- August 2015
- July 2015
- June 2015
- May 2015
- March 2015
- January 2015
Once again Tony will cause Griff to get his panties in a terrible knot. Cue Griff to show up ranting about thin ice in the Beaufort or some other such nonsense any moment!
Iditarod is running with low night time temps of -49F or -45C two days ago …. hardly global warming stuff but there were GLO-BULL warming headlines prior to the start of the race.
http://iditarod.com/
Check out their website for some good coverage and pictures. I signed up for the insiders package this year and get real time GPS of the teams and a lot of other stuff.
but is wasn’t running so good last year, was it?
and you know that Alaska has seen 3 years of record temps…
There is a difference between multi year ice which is mostly 1 year old and under 2m thick (now) and multi year ice 2, 3, 5 and more years old and 5m thick (the good old days)
The Good Old Days….
Last year was fine Griff …. please point out WTF u are on about?
Video of Dallas crossing the finish line last year … does it look warm to you Griff? Griff, I would love to see this from your perspective but I am unable to get my head that far up my ass.
http://iditarod.com/video/page/36/
What part of -45 don’t you understand?
Dallas is the 4th vid down the left side of the post I linked to. Note the dogs and the frost on their faces. I would guess temps were around -30C.
You have never been anywhere near the arctic have u Griff?
I doubt that Griffy was ever out in weather in temperatures of -30 °F (34 °C) much less out for a long time doing physical exercise like cross country skiing or skijoring. That is why he is so in love with ice.
The dogs would not be wearing coats if it wasn’t DAMN COLD.
Team from 2016 race.
http://bloximages.chicago2.vip.townnews.com/frontiersman.com/content/tncms/assets/v3/editorial/4/e2/4e23ddf6-ee02-11e5-ad8d-2bcd2143755f/56ed9da90d6e6.image.jpg
and you know that Alaska has seen 3 years of record temps…
Translation: I have millions of innocent humans to extinguish, and facts are getting in my way, so I will cherry pick 3 meaningless years out of 4.5 billion
65 million years of cooling….
Griffy is a Climate Cycle Denier!
Your probably remember that the year before the so-called Alaskan heatwave began, the ice break up at Fairbanks was the latest on record. So you have cold years, then you have warm years, then they have cold years. That is weather for you, the way it has been since time began.
What was that you said, griff?
https://weather.com/forecast/regional/news/alaska-frigid-below-zero-temperatures-january-2017
I am just in from shoveling the driveway, sidewalk and rear patio and brushing about 8 cm of snow off the cars at -17C good link to a weather station a neighbour has http://wx.ca/
While working away my fingers were slowly freezing which is a problem with holding tools or a shovel at these temps and I was thinking that Griff has likely never had frozen fingers or frozen toes or had frostbite and yet the little shit thinks he is an expert on the cold.
Likely the only ice the little shit Griff ever sees is in his freezer!
Nah, in his drinks. He is too lazy to actually look in a freezer.
Granny must be getting a bit ‘over’ having to constantly feed it and change it diapers!
The Iditarod is FREEZING cold this year…
Bone crushing cold..
Unless you have been out in that type of cold you have no idea of what it is like.
It isn’t that cold today. Sunday and Monday nights were the -45C cold nights but now they are more in the -20C range. Here are the checkpoint weather forecasts if the link works. Since I subscribed to the insiders package I don’t know what will work for folks that haven’t paid $$$.
http://iditarod.com/race/weather/
The lead team is on the way to Huslia where it is currently -19C or -2F.
That is not too bad. At least you can breath OK.
Tony,
Thanks for all of your continued hard work over the years. I’ve been a regular readers of your blog for many years and am grateful for the education I’ve received here. I was wondering if you could give a brief explanation as to how one can download the data that you used to create the graph on this page and what program you use to create these graphs?
This should work on most Linux distributions. Plot with Excel.
#!/bin/tcsh
set DATE=0307
rm -f MYI_${DATE}.csv
foreach year (2008 2009 2010 2011 2012 2013 2014 2015 2016 2017)
rm -f ice_type_nh_${year}${DATE}1200.jpg
echo ice_type_nh_${year}${DATE}1200.jpg
curl -O http://osisaf.met.no/quicklooks/prod/ice/${year}/03/ice_type_nh_${year}${DATE}1200.jpg
convert ice_type_nh_${year}${DATE}1200.jpg ice_type_nh_${year}${DATE}1200.txt
echo $year”,”`grep ‘#F’ ice_type_nh_${year}${DATE}1200.txt | wc | awk -F” ” ‘{print $1}’` >> MYI_${DATE}.csv
end
Tony – Have you by any chance tried “pixel counting” any other agencies maps of “multi-year sea ice”?
Do you see that big white area in the Beaufort Sea in your chosen map? Where is it on this map from the Canadian Ice Service?
http://GreatWhiteCon.info/2017/03/facts-about-the-arctic-in-march-2017/#Mar-7
I am shocked that the ice is still there………..
I am shocked that Jimmy Boy is still pedaling his Great White Con.
People like him really really make me want to see the start of the new Ice Age.
Is that YOUUUuu Jimmy Boy or is it Viner.
So childish the way Jimbo the clown picks one little area where Canadian group disagree with the satellite data.
So sad.. SO PATHETIC.
I hope your trough swilling boyfriends at Exeter and Met are not paying you, little yellow-back troll….
Because they are wasting the trougher money, or other favours, if they are.
AndyG,
That is how you know Jimmy Boy is a troll for the ClimAstrologists. He doesn’t have the brains to dig that out on his own. They had to feed it to him.
I’m guessing that basically everything on his DECEITFIUL, LYING, CON web site is fed to him by the Exeter troughers. He is their poppet. !!
“He is their poppet.”
Sounds like a good description of Jimmy Boy.
Well done Gail. :-)
I was thinking that the Exeter boys would look on him as the other meaning…..
… A naïve little child to be used as they want to.
Tony said
” I generated the graph by pixel counting the white pixels, which represent multi-year ice. The map below is 3/8/2017.”
But do they ?
http://www.zen141854.zen.co.uk/iceyears.jpg
How can those white pixels being multiyear ice be in places where no ice was there last summer? Drift? I don’t think so, though I would be happy to be proved wrong.
Andy
“I would be happy to be proved wrong.”
You are so used to it… your natural state of being.
Empty vessels make most noise
Yes, we can hear you yapping !!
You seem skeptical that there could be multiyear ice in places where there was no ice last summer. Yet when it suits your purposes, ice can move around, and when it doesn’t suit you, ice cannot. If a big chunk of multiyear ice moves around, why couldn’t it be later found in a place where it hadn’t been before?
Ok, explain how multiyear ice turned up in the places I put my arrow against?
Here’s a question, down the right hand side of Greenland there is an outflow of ice. Some of that on this map is multiyear ice, but not all. Why? Why is there multiyear ice to the west of Baffin Island when no flows occur to push that there? It’s got single year ice between it and the mass of PROPER multiyear ice to the north. How can multiyear ice appear there?
And explain the multiyear ice to near Svalbard, this chunk of multiyear ice seems to have stretched itself out to exist along the very edge of the entire sheet. hmmmm
Alternatively this map has some deficiencies on counting white pixels year on year to show older ice.
No?
Andy
I suggest you do a bit of you own research, child-mind.
Start in September here http://ocean.dmi.dk/arctic/icethickness/images/FullSize_CICE_combine_thick_SM_EN_20160928.png
And progress in 2 week steps.
Maybe. just maybe you will figure it out for yourself, with it being spoon-fed to you.
Why start in September when we are talking about March. Also it is thickness not ice age.
Apart from that
Good post !
Andy
Again you show your ignorance.
Start at September , so you can track the sea ice, bozo. !!
AndyG55,
Don’t want to be seen to be rude, but have you considered asking an adult to help out with some of your posts? This is a real science blog so that sort of help might help you integrate more fully.
Andy
Have you ever considered doing some basic research before you post..
You are constantly coming across as a dull-witted, brain-washed AGW apologist.
You might want to actually think about that before you continue to post arrant nonsense. You want to discuss science.. then bring some, and not baseless propaganda pap.
And please .. your puny leftist victim-crying, isn’t going to affect anyone here.
We are so, so used to it.
We’re going to have to agree to disagree on that point Andy.
This is an (un)real science blog.
And you, Jimbo, are a pathetic little AGW con-man and climate change denier who’s only knowledge of any science is that fed to you by the Exeter boys.
You lap up their propaganda pap, just to ingratiate yourself with them.
You don’t actually believe one single bit of it , do you Jimbo… its all just play acting for favours from the boys.
Genocide Jim is an (anti)human agenda hog.