A large group of government scientists are attempting to influence policy by leaking this report to the New York Times. The report is chock full of fraud, lies and data tampering.
Read the Draft of the Climate Change Report – The New York Times
Let’s look at a few of the innumerable attempts to deceive the public in this report.
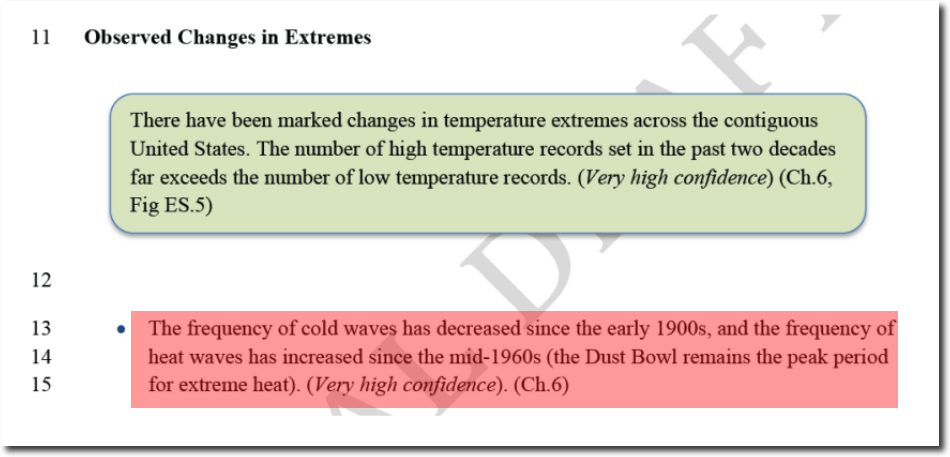
The first one I am discussing is an attempt to hide the extreme heat in the US prior to 1960 “the frequency of heatwaves has increased since the mid-1960s”
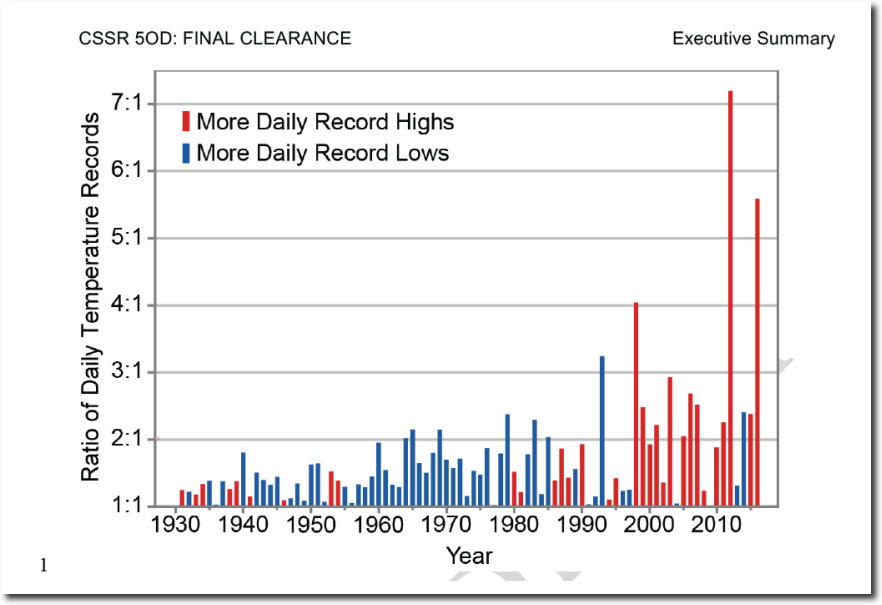
The report has one sentence saying “the Dust Bowl remains the peak period for extreme heat.” But immediately below that they have a graph which fails to show the extreme heat of the 1930’s.
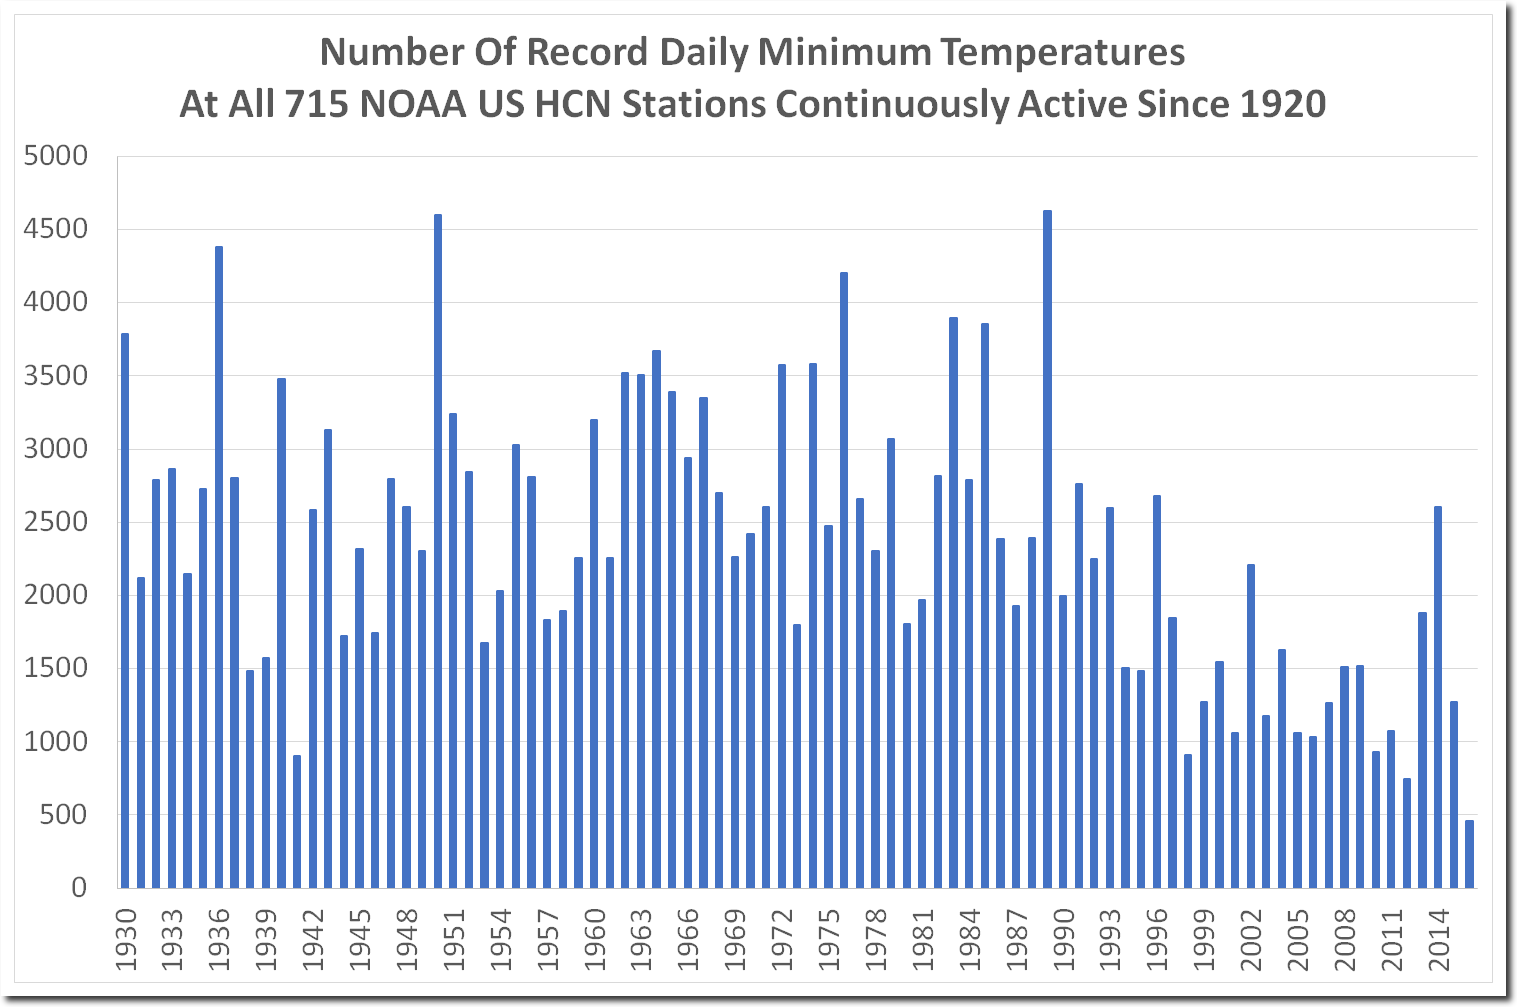
This graph above is a classic divide by zero error. The frequency of both record lows and record highs has decreased. When you divide by a small number, you get a large number approaching infinity – as seen on the right side of the graph above. No serious scientist or mathematician would make that mistake.
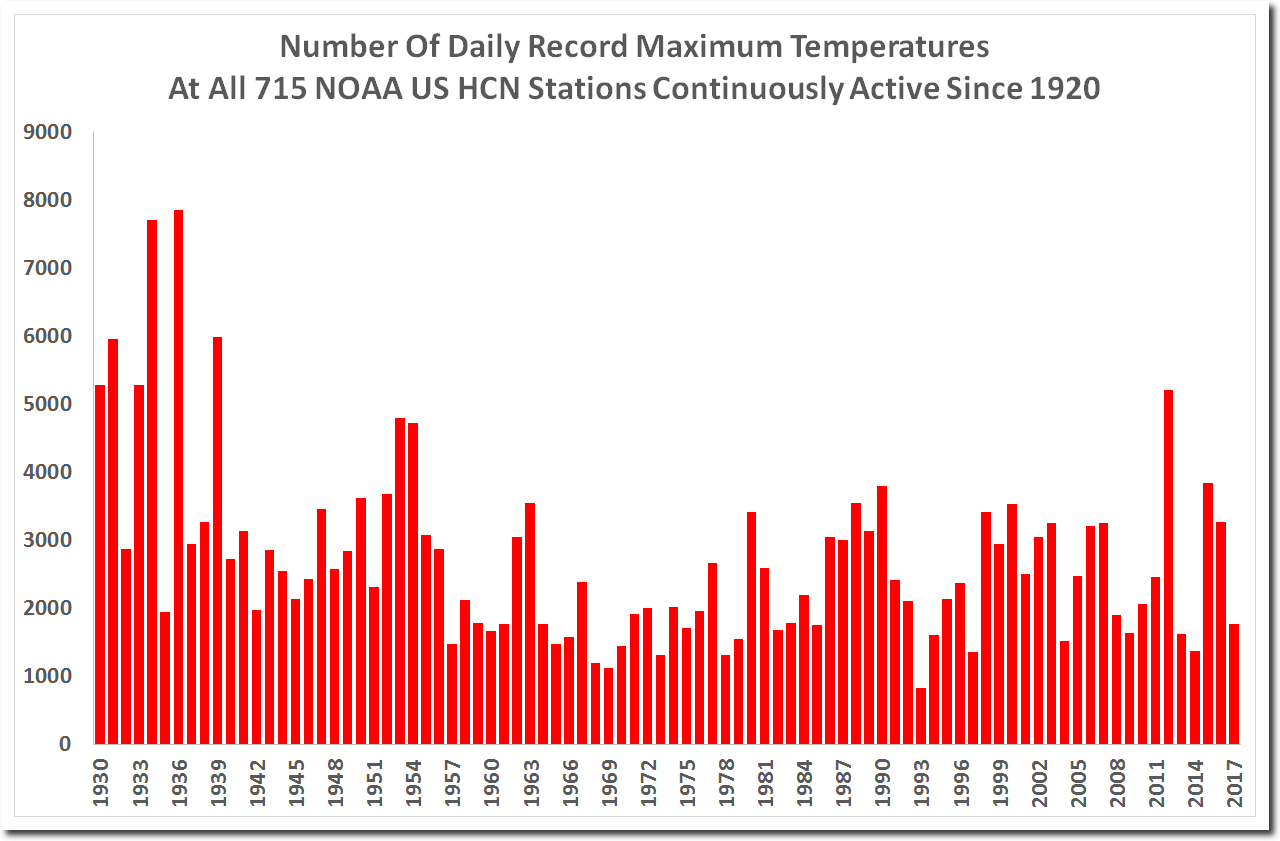
Actual data using the most stable set of stations, shows a sharp decline in the number of both record maximums and record minimums in the US. Note that my graph below shows the Dust Bowl, while their fake graph doesn’t.
Extreme heat and cold peaked in the US in the 1930s, and has been declining ever since.
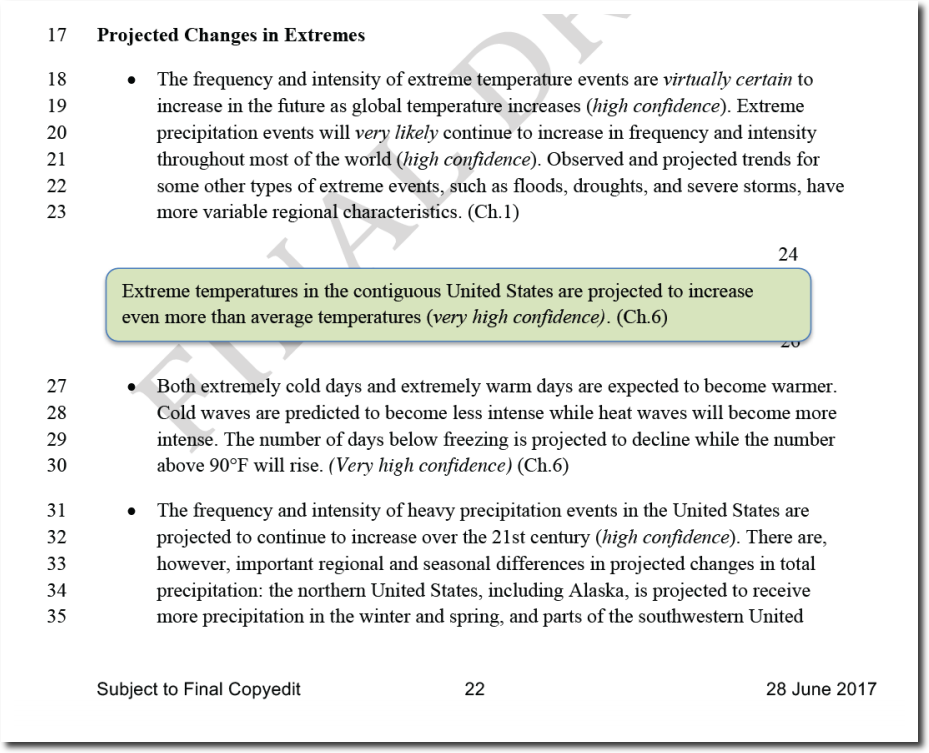
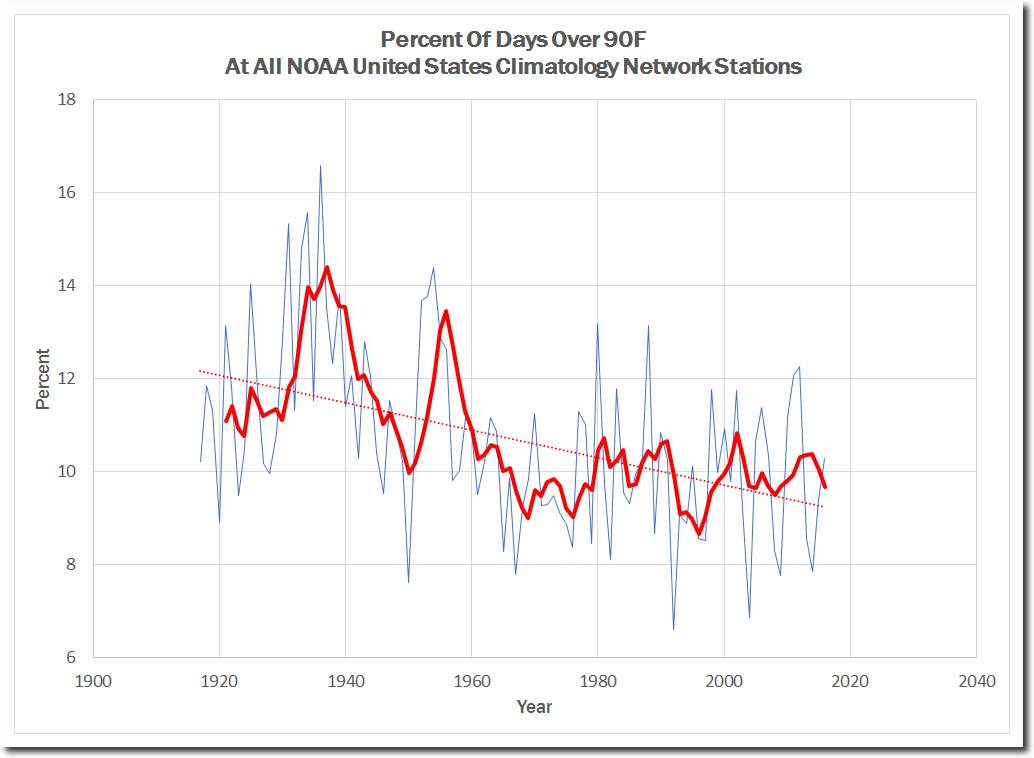
Next let’s look at their claim “the number (of days) above 90°F will rise (very high confidence)”
The NOAA actual data shows the exact opposite. The frequency of 90 degree days has plummeted in the US over the past century. You can also see why they are trying to hide the heat prior to the 1960’s – the US was much hotter prior to the 1960s. Also note that this data is not subject to any adjustments, as NOAA does not adjust daily temperatures. I have very high confidence that these people are not scientists. No scientist would commit fraud like these people are doing.
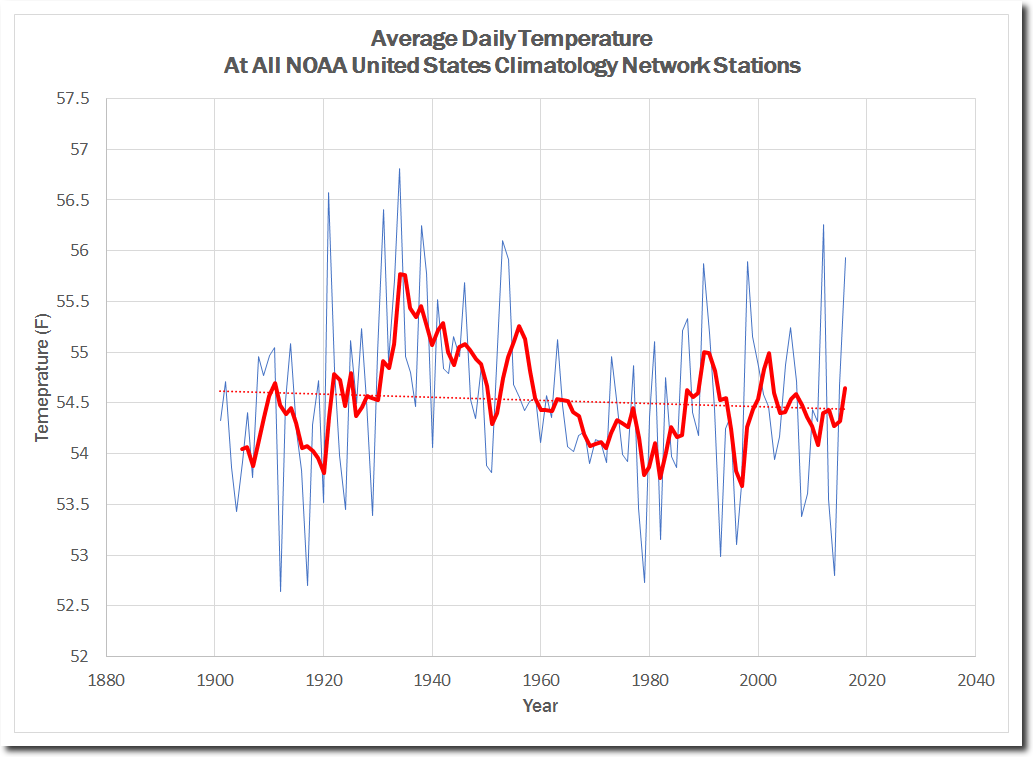
Final claim I am going to look at right now is this one saying that US temperatures have risen 1.8 degrees since 1901.
Actual NOAA data shows there is no trend in US temperatures, and that the hottest weather occurred eighty years ago.
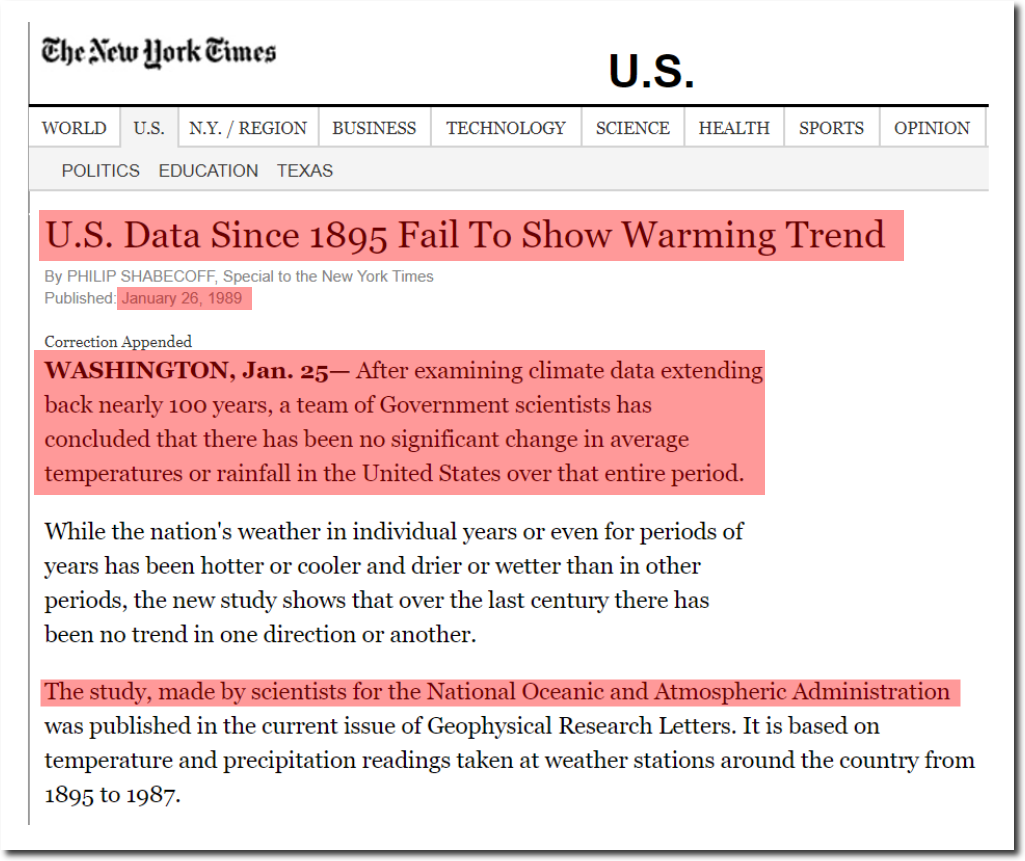
Note that my graph agrees with this 1989 report from NOAA, reported in the New York Times.
U.S. Data Since 1895 Fail To Show Warming Trend
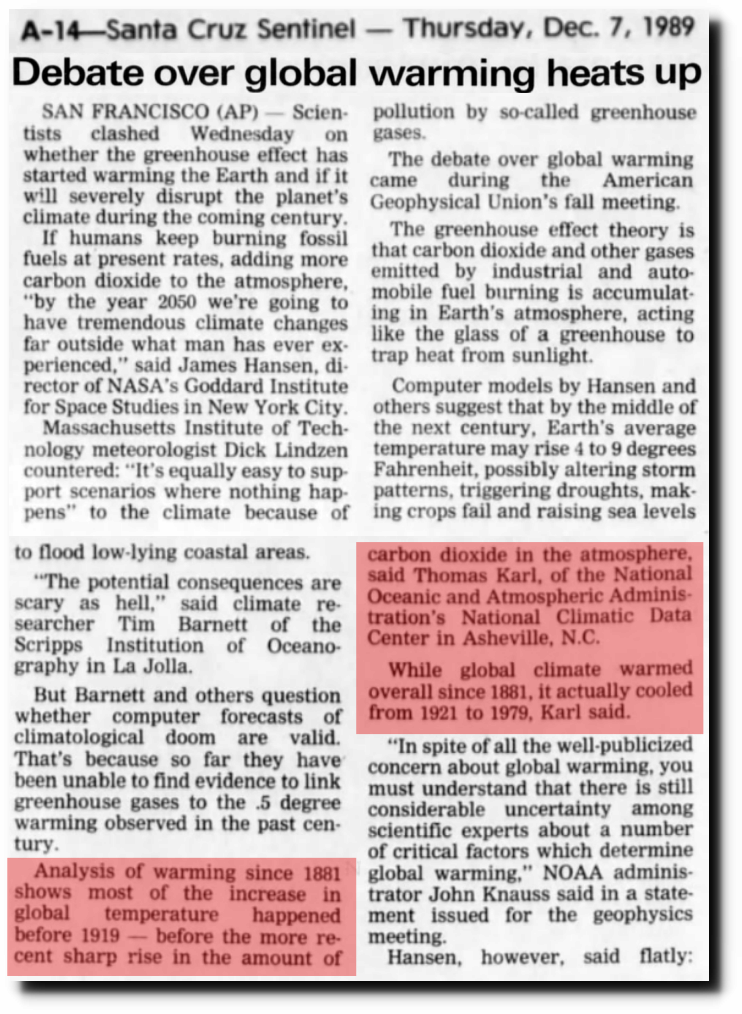
NOAA also reported in 1989 that Earth cooled from 1921 to 1979, and that most global warming occurred before 1919.
07 Dec 1989, Page 14 – Santa Cruz Sentinel
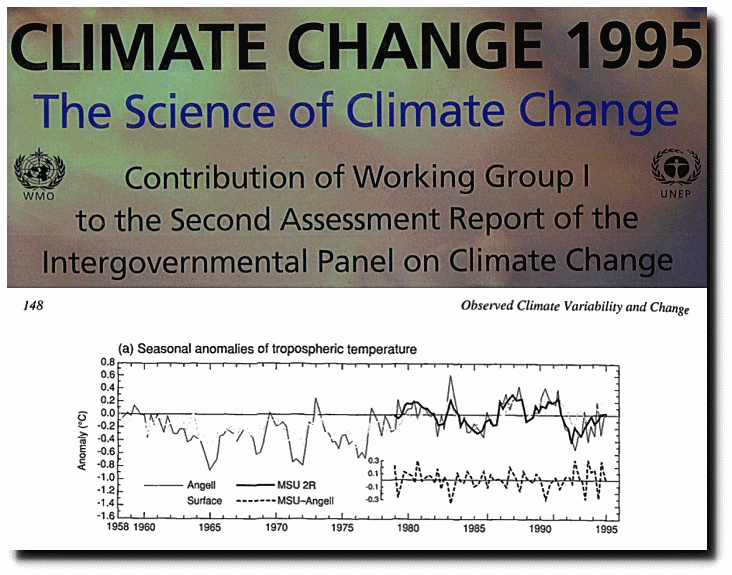
The 1995 IPCC report showed no evidence of troposphere warming since 1958.
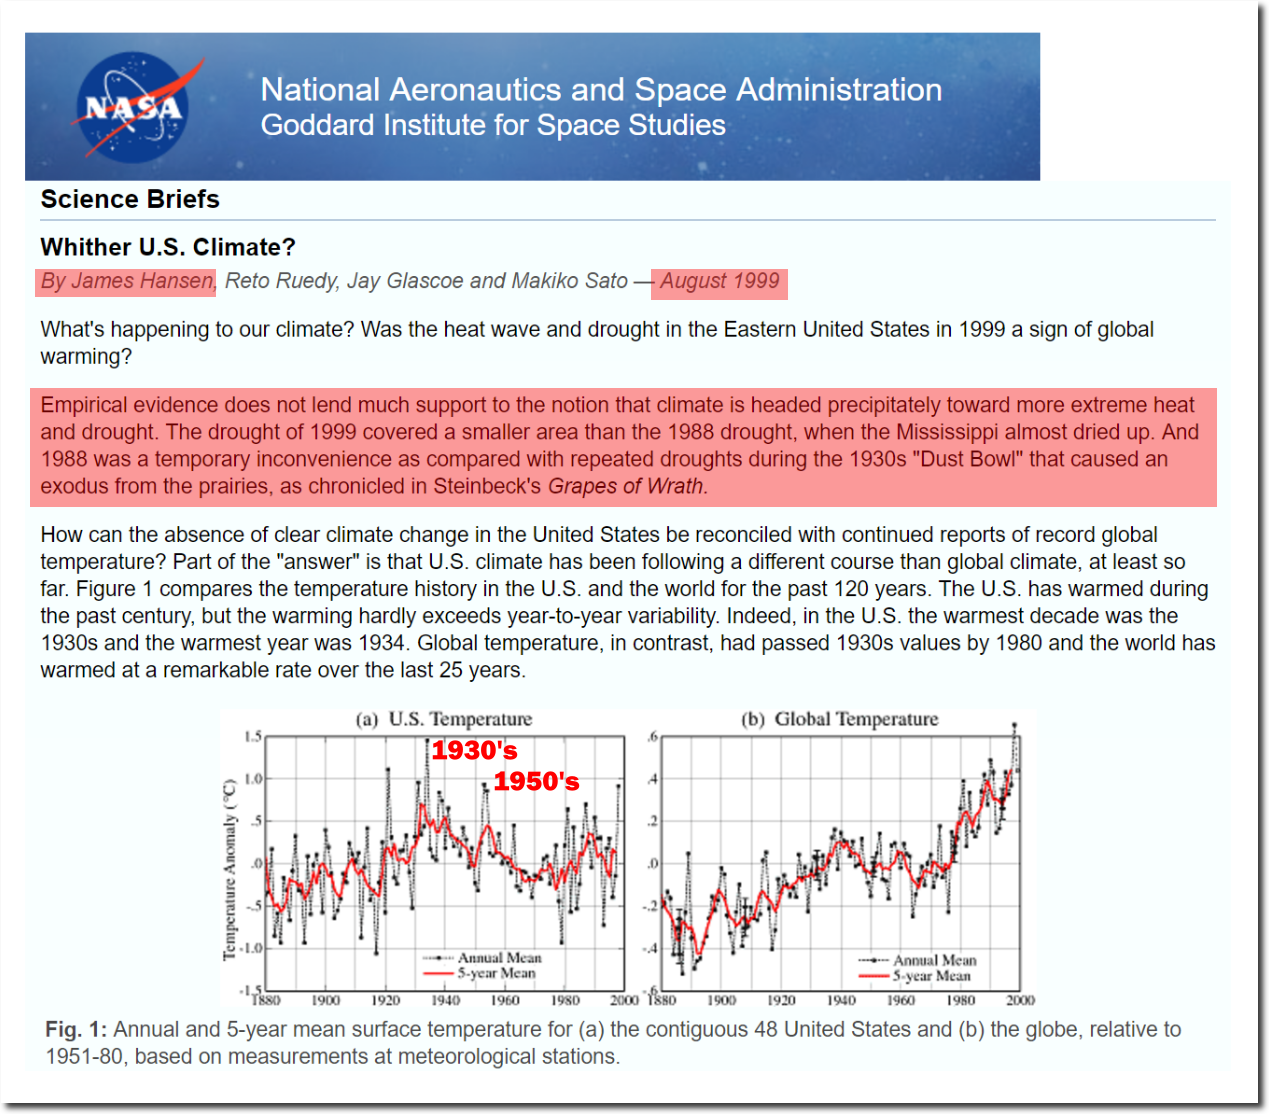
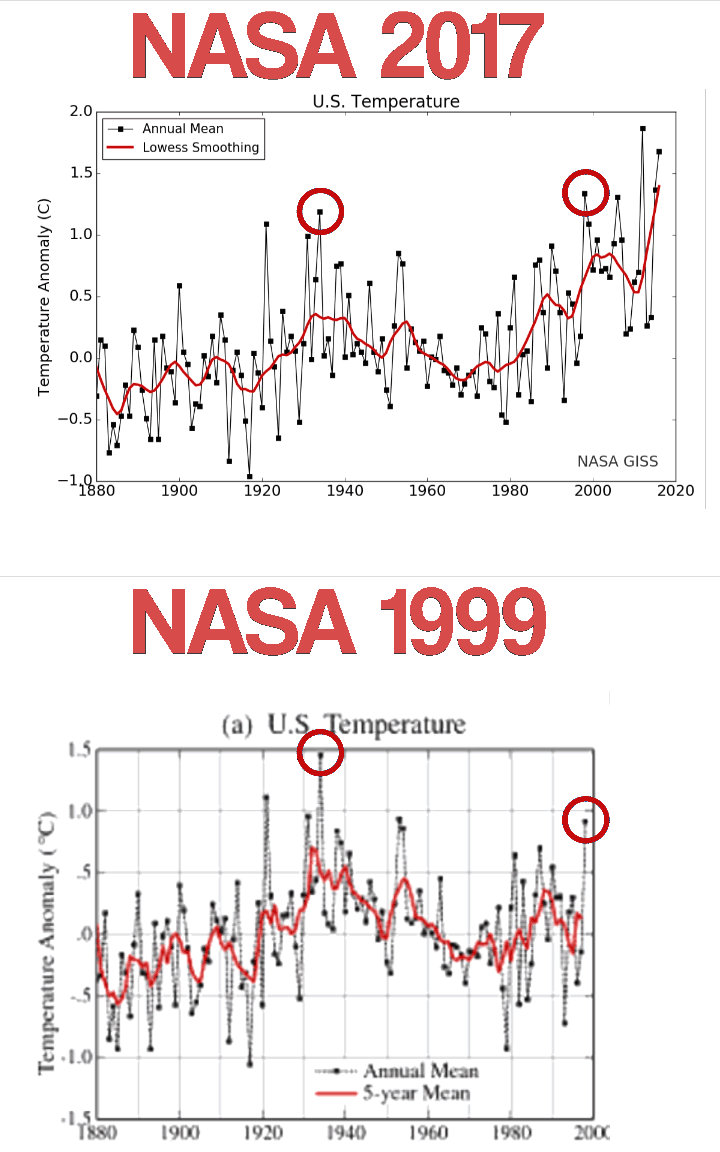
My graph also agrees with this 1999 report from NASA.
Empirical evidence does not lend much support to the notion that climate is headed precipitately toward more extreme heat and drought…. in the U.S. there has been little temperature change in the past 50 years, the time of rapidly increasing greenhouse gases — in fact, there was a slight cooling throughout much of the country
NASA GISS: Science Briefs: Whither U.S. Climate?
All of the claimed warming is due to data tampering by these same government agencies since 1999.
The fact that so many signatories from so many government agencies signed off on this fake report, shows the depths of corruption at government agencies. This is racketeering and fraud – not science.

