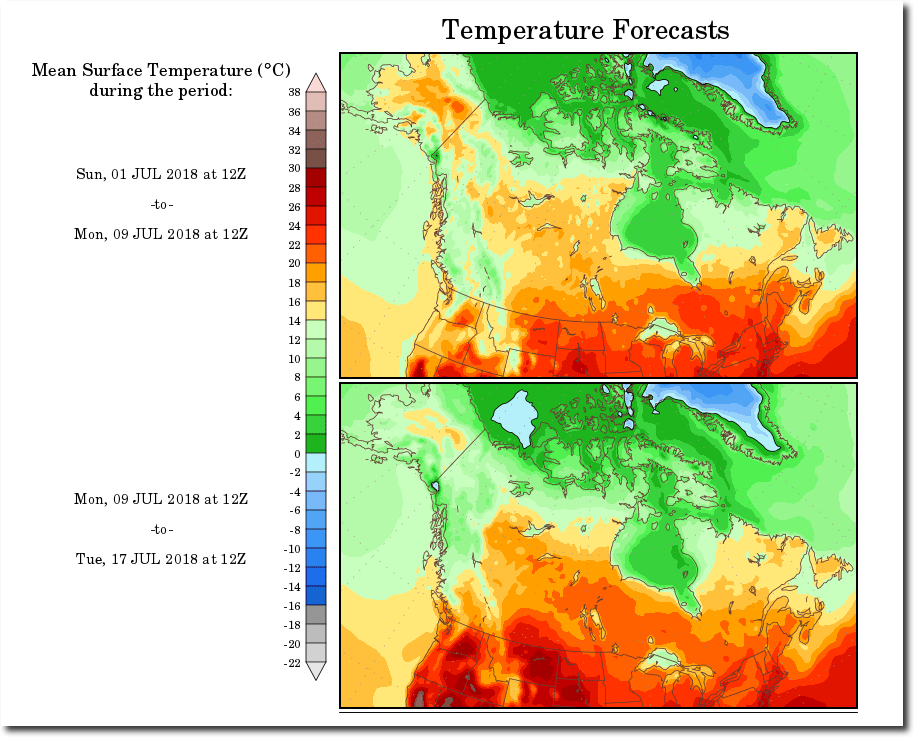
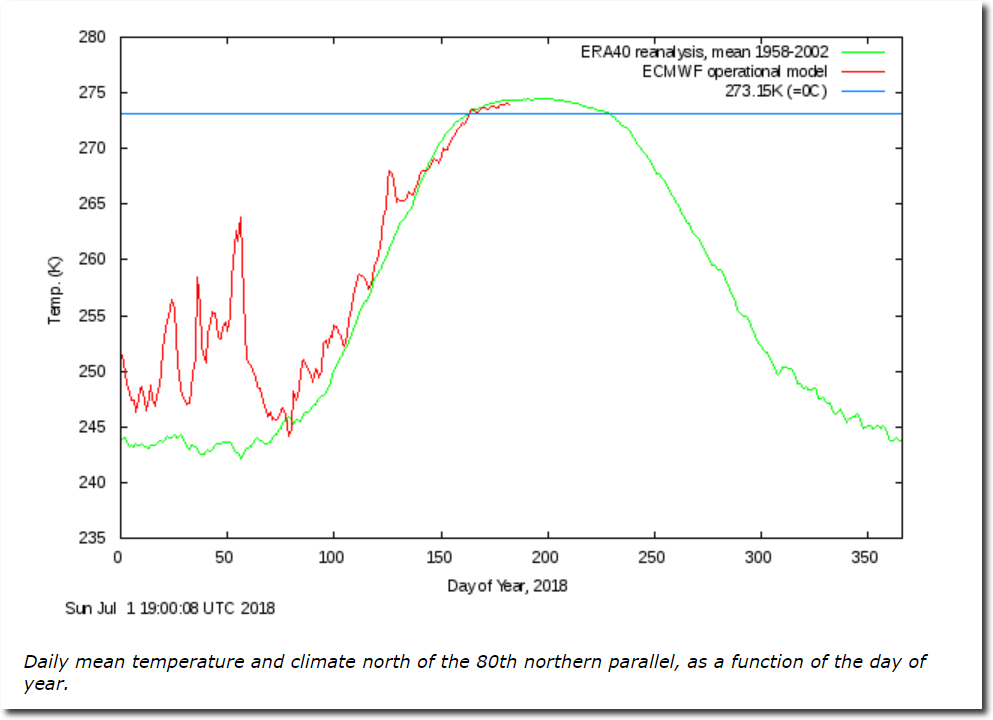
The Arctic has been cold all summer and is forecast to be cold for the next two weeks. After that, the volume melt rate will tail off sharply.
Email Subscribe
Disrupting the Borg is expensive and time consuming!
-
Recent Posts
Recent Comments
- mwhite on Democracy Dies In Fake News
- WCK on Democracy Dies In Fake News
- WCK on Record Heat Of January 26, 1950
- Ron on Record Heat Of January 26, 1950
Archives
- January 2021
- December 2020
- November 2020
- October 2020
- September 2020
- August 2020
- July 2020
- June 2020
- May 2020
- April 2020
- March 2020
- February 2020
- January 2020
- December 2019
- November 2019
- October 2019
- September 2019
- August 2019
- July 2019
- June 2019
- May 2019
- April 2019
- March 2019
- February 2019
- January 2019
- December 2018
- November 2018
- October 2018
- September 2018
- August 2018
- July 2018
- June 2018
- May 2018
- April 2018
- March 2018
- February 2018
- January 2018
- December 2017
- November 2017
- October 2017
- September 2017
- August 2017
- July 2017
- June 2017
- May 2017
- April 2017
- March 2017
- February 2017
- January 2017
- December 2016
- November 2016
- October 2016
- September 2016
- August 2016
- July 2016
- June 2016
- May 2016
- April 2016
- March 2016
- February 2016
- January 2016
- December 2015
- November 2015
- October 2015
- September 2015
- August 2015
- July 2015
- June 2015
- May 2015
- March 2015
- January 2015
The reason for the colder weather forecast for the following week has to do with this potential pattern developing for a few days.
July 1st
DMI ice volume is now above +1sd in the whole of the DMI ice volume record since 2003.
Indeed it is, and even further above the +1sd for the DMI graphed years.
Other numbers for the July 1 values:
2018 now at 111.45% of both the 16-yr average, and the 2004-2013 (charted) average.
The gap between 2018 and #3 2014 has widened to 73 cu km, but the gap between 2018 and 2003 (#2) has narrowed by 124 to 904. In the last week, this gap has narrowed by 797 cu km, 46.8% of what it was on June 24.
For comparison, below is the DMI graph for 2004, which also shows 2003. Those years, while both having high levels in April, had quite different lows, both in timing and in value. Notice that 2003’s values went below the graph average, and then had an abrupt, sharp reversal.
Very interesting!
Stay tuned.
Wasn’t the 2003 drop due to a warm tropical cyclone that hit the arctic near peak melt and churned up the ice?
http://nsidc.org/arcticseaicenews/2018/06/
Who to believe? I vote “scientists.”
You have no clue what a scientist is, much less who they are.
You need to catch up with the data.
NSIDC currently has Arctic sea extent above: 2006, 2007, 2010, 2011, 2012, 2013, 2014, 2016, and 2017
MASIE has Arctic sea ice extent above: 2006, 2007, 2010, 2011, 2012, 2014, 2016, and 2017
DMI has Arctic ice volume above EVERY year back to and including 2005
Melt is VERY slow this year because the ice is thicker than it has been for many years.
Try not to look like a fool.
So it”s belief your after then. I vote “church”. And my vote counts the same.
http://psc.apl.washington.edu/research/projects/arctic-sea-ice-volume-anomaly/
Ice mass low. Ice extent low. Arctic had some exceptional warm days this past winter.
Your Arctic melting BS will be over soon.
Scott you must be a total moron … your warm days were still 10 to 20 degrees C below zero and therefore not warm at all … merely above average & yes there is a difference!
Temperature data is here showing the actual temperature for Scott’s “warm days” … he will be too thick to look at actual data even when spoon fed to him. http://ocean.dmi.dk/arctic/meant80n.uk.php
When will your many warmist scientist prophets prediction of no summer ice going to happen?
It was supposed to be zero 10 years ago, but who’s counting……
Snicker…….
Well-30 years of Hansens failed predictions were not enough.
The increase of polar bear population instead going extinct
was not enough.
The massive decrease of hurricanes instead of a massive increase was not enough.
The non existent increase in sea level rise
(no islands drowning,massive increase in prizes for houses at the beach,no massive change of countries/continents topographie and coastal shape as logical result of rising sea levels ) was not enough.
His behaviour reminds me of the religion
that was founded by a massmurdering pedophile&rapist&massenslaver who genozided several tribed
-and still his followers claim that the founder is the most perfect human being ever and that one has to become like me.
But maybe one day the results of cognitive disonance will hit him like a hammer,
and than he will start to ask himself:
How the hell could it happen that climate science went from one absolut extreme(ice age) to another extreme(AGW)
within very few years.
And when climate gases are supposed to add(let’s say)30 degrees to our climate
how the hell could science go from “ice age is gonna cool down planet earth by 5-10 degrees”
to “earth is gonna heating up 5-10 degrees”
by adding a few co2 molecules to our atmosphere
on a planet that is covered 3/4 by climate gas h2o.
That’s a difference of up to 20 degrees from ice age theory to AGW theory and a completely irrellevant number of superweak climate gas co2 is supposed to do this
though one needs huge amounts of energy to get such a gigantic difference and it is impossible to misscalculate and be wrong on such a scale .
edit
“become like him”(not me)
The IPCC AR5 report (2013) that first discussed it said ‘Likely’ by mid-century, if RPC8.5 was maintained, with ‘Medium’ Confidence.
For lower RPC scenarios, they had no projection.
Oh, and there is a formal definition for ‘Nearly Ice Free’… less than 1 million sq km in September, 5 years in a row. Image from the report attached.
Sorry for my typos: Where RPC appears in my note, should have been RCP.
WRONG
NSIDC currently has Arctic sea extent above: 2006, 2007, 2010, 2011, 2012, 2013, 2014, 2016, and 2017
MASIE has Arctic sea ice extent above: 2006, 2007, 2010, 2011, 2012, 2014, 2016, and 2017
DMI has Arctic ice volume above EVERY year back to and including 2005
You DO look like a fool. Is it by choice or ignorance?
Scott Koontz said, “Arctic had some exceptional warm days this past winter.”
That is known as propaganda. Better known as a LIE. There is no “exceptional” warm”th when the temperature is below freezing. Scott, you are a liar.
The sad part is, you know you are a liar. Either that, or you are a useful idiot moron.
Here is my morning routine:
Space Weather for the Spotless Day Count. At 50 percent now. :)
DMI Arctic temperature.
DMI Ice Thickness.
Greenland Ice Sheet Surface Mass Balance.
Then, the “Deplorables”.
WUTU.
Now the plot of Greenland ice is well above the mean line and continues to extend. This is the unhinged part. Although plotted daily, I check it a few times during the day–because it is so “pretty”.
:)
Greenland smb GREW yesterday. A-mazing.
Sad.
I do a lot the same.
Must get off the computer and go back to life.
PIOMAS will hopefully be good.
Bob, here is Ms Griff’s routine:
DMI Arctic temperature.
30 minutes breathing through a Personal Oxygen Bar.
DMI Ice Thickness.
45 calming minutes reading Das Kapital.
Greenland Ice Sheet Surface Mass Balance.
60 minutes breathing through a Personal Oxygen Bar.
Reading a New York Times article about the Deplorables.
Deplorables.
Buying a Antifa hoodie.
Knitting pussy hats for 6 hours and resisting for another 6 (several bathroom breaks taken, in full uniform).
Hah!
:)
In reference to ice “free.”
https://thebarentsobserver.com/en/2018/06/midsummer-tankers-get-ice-trapped-near-russian-arctic-port
The forecast of probably two weeks of cooler than normal could be critical.
A couple of weeks ago I “eyeballed” some charts for the turn of the season.
DMI temp chart–the mean returns to below the freezing level close to August 23rd.
The Greenland surface mass balance stops declining in the middle of August.
The DMI chart of the maximum melt rate peaks in the third week in July.
Going to be interesting.
The cool thing about the Arctic is that at the end of Summer the lights actually are turned out. Party over.
Scott Koontz informed us that he listens to “scientists” who tell him that “exceptional warmth” occurs at temperatures below freezing.
Tony said, “You have no clue what a scientist is, much less who they are.”
Bingo and BOOM!
edit: Above, replace “listens” with “believes” – Scotty doesn’t just listen to them; he said he “believes” them.
Tony is not a scientist. BOOM and QED.
Scott extends his ignorance into new arenas.
Tony is not a scientist. BOOM and QED.
Neither were the Wright brothers, or John Muir.
Booyah!
Update for July 2 DMI Sea Ice Volume numbers:
2018 still #4, at 111.91% of the 16-year average, and 114.05% of the 2003-2013 DMI graphed average. In both cases, rising farther past 1st std deviation.
2014 and 2018 did not change much in relation to each other. The gap between them grew by 9 cu km, and is now 84.
The gap between 2018 and 2003 narrowed by 179 in today’s report, and is now 725.
As a reminder, 2014 crosses above 2003 on the report for July 6. At current rates of change for 2018, it may be at the same value, and cross 2003 as well.
Interesting!
Stay tuned.
Any comments about this photo making the rounds?
https://www.facebook.com/itsthemetapicture/photos/a.387644671313623.87403.129488340462592/1734493253295418/?type=3&theater
Ice melts.