June has finished with Arctic sea ice volume fourth highest in the DMI record, behind 2004, 2003 and 2014.
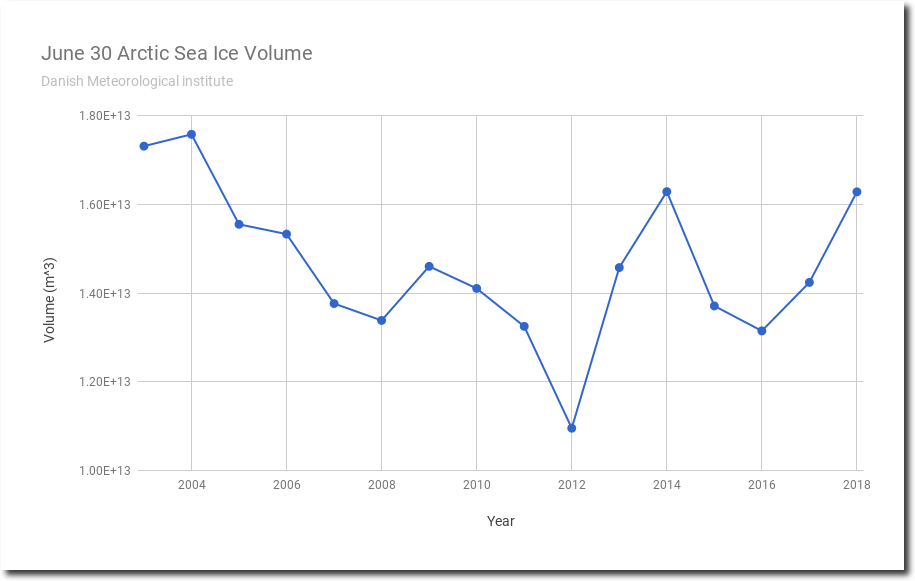
But the big story is the slowdown in melt rates since 2012. The average June ice loss since 2012 is down 17% relative to the years prior to 2012.
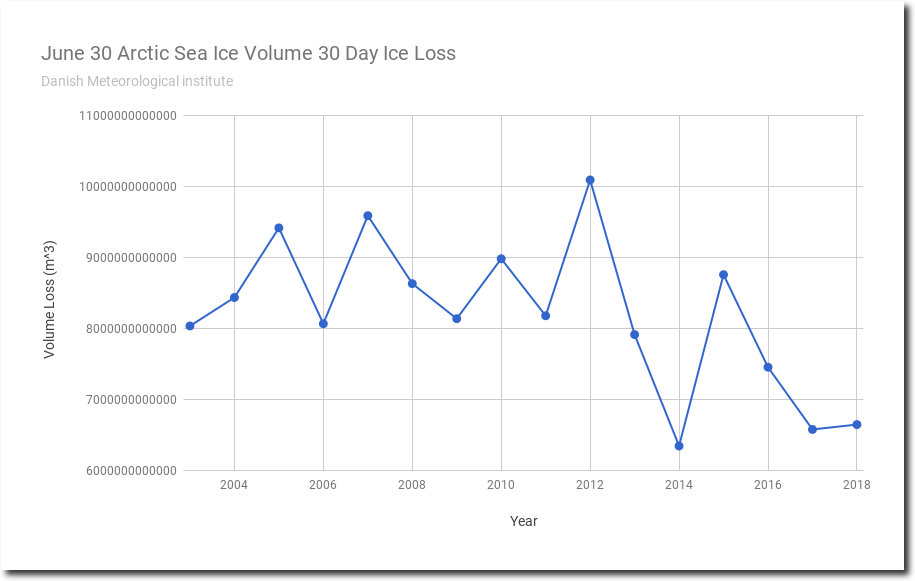
In three weeks, volume melt rates will slow sharply, giving Reggie not much time to make an honest man out of James Hansen.
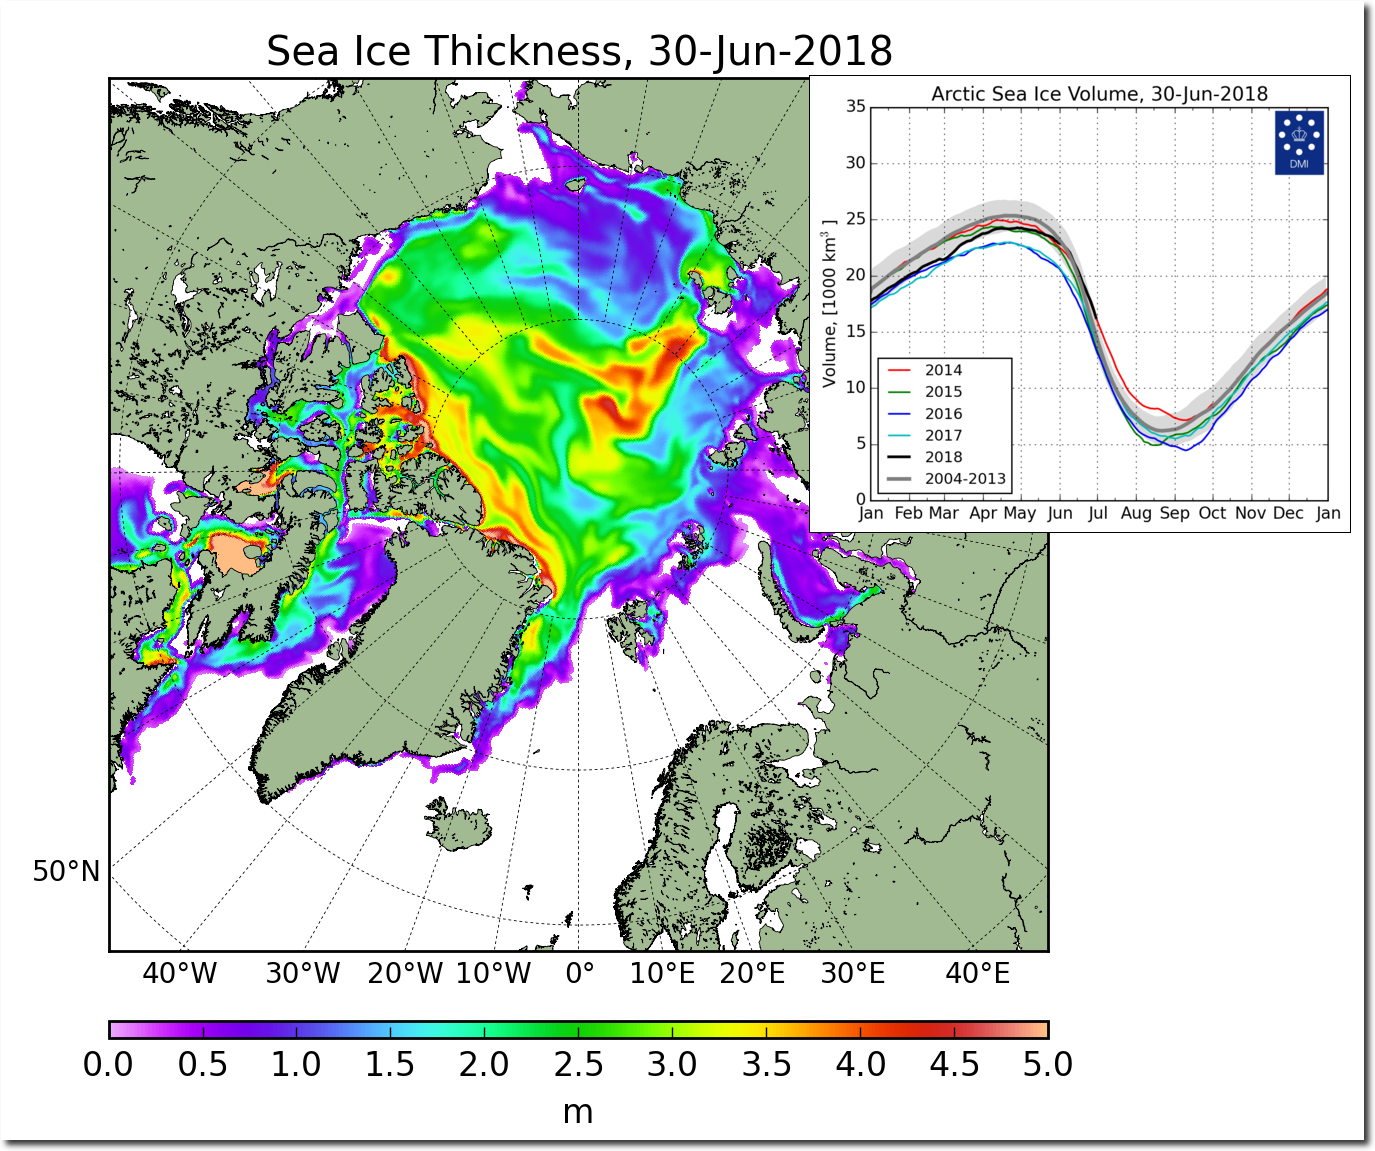
The alarmists will need to get Winston in from “1984” to do some history rewriting! Embarrassing stuff, REAL history!
Keep sticking it up them Tony ….. ?
“Every record has been destroyed or falsified,every book rewritten.
Every picture has been repainted,every statue and statebuilding has been renamed.
Every date has been altered.And the process is continuing day by day,minute by minute.
History has stopped.
Nothing exists except an ENDLESS present in which the party is ALWAYS right.”
(george orwell)
That all sounds eerily familiar! Like the liberal Democrat playbook word for word!
People still think Orwell wrote something fictional,
while in fact he simply exposed the modus operandi
of tyranny disguised as “for the people”.
And by the way of rewriting history one can turn
the killers into victims and the coming ice age into global warming.
(and one can only wonder:”How many of those historical “facts” of the past are completely rewritten bullshit and the opposite of what really happened.
Once there was an emperor-so cruel that even his own bishops criticized him for being merciless.
A massmurder similar to people like Pol Pot,Dschighis Khan etc,
until another massmurderer declared him to be a great,great man.
The other massmurderer was Hitler and the nowadays great great man was Charlemagne.
Many of modern globalists received the charlemagne prize.
Did you know that the U.S. was responsible for Pol Pot. (Soros’ troops are spreading this lie and more.)
https://popularresistance.org/us-has-killed-more-than-20-million-in-37-nations-since-wwii/
Some additional Jun 30 numbers:
The difference between #3 2014, and #4 2018 is 4 cu km. 2018 is still rising compared to the average of the 16 years (111.27%), but slipped by .09% when compared to the DMI-charted 2004-2013 values.
2014 is now in the 2-sigma group, and 2018 has continued to approach the upper bound of 1-sigma, now just 3 cukm below it.
Update: A correction to include the DMI-charted years, 2004-2013: the 2018 value for the 30th is higher than the 1-sigma value. So, while it is just below the 1-sigma value (1649) for the full 16-year result set (1653), due to the different values in the DMI 10-year result set, upon which they base their graphed ‘grey area’, the 1-sigma for that group is 1630.48.
So, though it may be difficult to see on their chart, 2018 is now ‘above the grey’ for that comparison. With current trends, I think we will see it rise above 1-sigma for the 16-year set in the report for July 1.
Very interesting!
Stay tuned.
I concur. Was just waiting until 1st July came in.
I reckon it will be just above the +1sd mark over the full DMI data period.
See, I’m checking on you ;-)
2014 and 2018 seem to be intertwining.
But gaining quickly on 2003,
Maybe catch 2003 within a week ? What you reckon?
Spike55:
Well, we know that 2014 crosses above 2003 on the report of July 6 DMI Sea Ice, and stays there a while. Those numbers are in the record already.
Right now 2003 and 2018 are narrowing. (Trigger Warning: Projection) IF they both stay on their current 7-day slopes, I extrapolate them meeting in the report for the day of July 9, issued on July 10.
It depends on the ‘whether of the weather’.
A quick capture of my graph No left axis because I do the whole year and I couldn’t be bothered fiddling with it.
oops. forgot the graph
Better, Vertical axis now in.
Nice chart. A suggestion: include the grey 1-sigma band in your key.
You’ll note that 2014 never crosses 2004. The 2004 recovery began, and 2014 kept declining to the average.
Hi Tony!
As you know, the current Arctic sea ice volume had been the 3rd highest in 16 years from June 24 to 29, 2018.
That volume seems stable enough.
(^-^)
↑
↑
Nice rendering. Shows how 2003 and 2004 are descending as 2014’and 2018 are rising.
And I know it’s not a great indicator, but it will piss off Griff, June ended as the 8th lowest extent on record and will, probably tomorrow, pass 3 other years to become the 11th lowest.
The weather coming up across the basin looks like strong low pressure over the eastern arctic continuing with strong south winds over the western arctic to start.
A re-enforcing low comes into the Laptev late week with mix weather over the western seas. The models are trying to bring this low over into Canada creating a strong low circulation over eastern Canada, but that’s too far out to nail down.
Messed up on first post. This correct map for Jul 3.
Watch for more storms across S Greenland. That’ll keep SMB pretty stable for the week.
I use the earth.nullschool.net 3-hour precip forecast to get a sense of how much precip, and where will fall on Greenland. Based on that, I think your expectation is pretty good!
Observe the growing silence of the Sea Ice haters…….