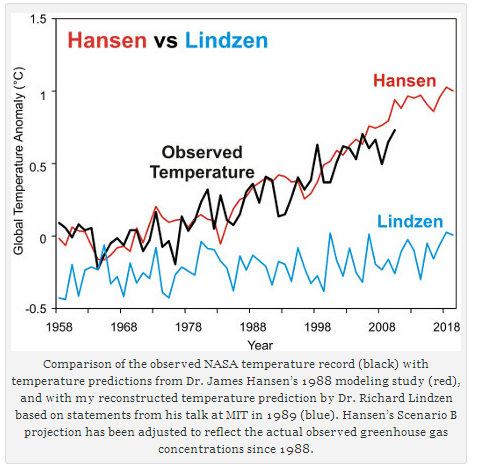
Check out this crock of lies from Peter Sinclair.
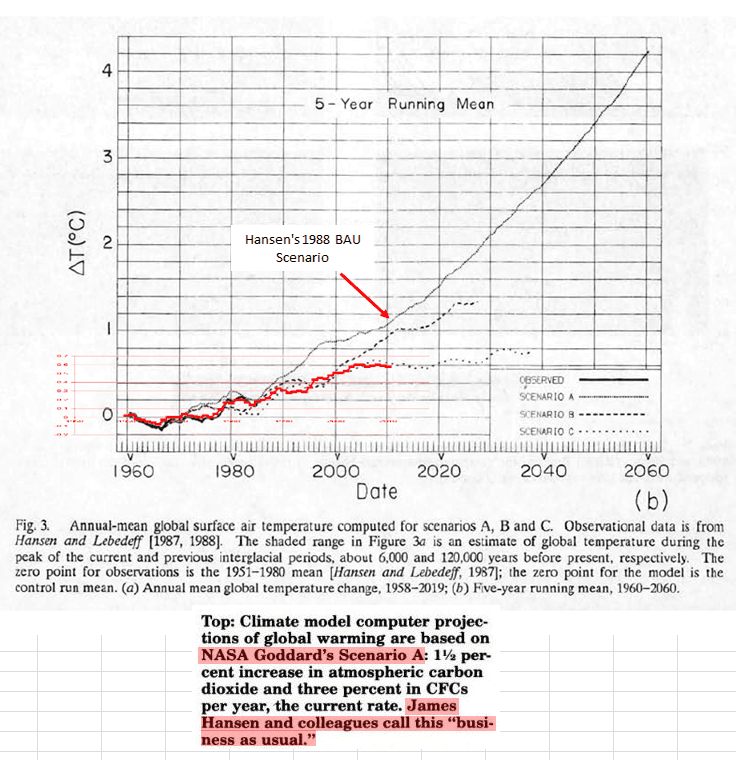
He made up fake numbers for every line in his graph, didn’t normalize the non-existent Lindzen forecast. and used the wrong Hansen scenario.
Hansen’s forecast was a complete disaster, and the claimed Lindzen forecast is a fraud constructed by Nuttercelli.
Graph below shows GISS in red, overlaid on Hansen’s 1988 forecasts.


Oh boy did his groupies have a hissy fit when I figured out how to sneak real links to infographics past YouTube’s link ban. Whole armies of bot-like commenters appeared to drive me off the first page, day after day. I just had to remove the http prefix and add a line break in the URL just before the last “dot.” Desktop browsers ignored the line break, conveniently, though my iPhone is adding a space now when I test it in this edit box. Various other hacks exist like using a forward instead of backslash. This was back in 2010 when using Sinclair’s own channel to broadcast real data plots created real panic in the cult, ha ha. Thanks for the exposure, Pete!
The graph isn’t Sinclair’s, it’s from Honest Dana
Climate science temperature forecasts are always incredibly accurate right before the point where they start to predict the future.
Any chance you could update this post (or post a new one) with a corrected graph showing real temps vs Hansen’s and LIndzen’s predictions? It would be enlightening to say the least.
Lindzen didn’t make predictions. He has pretty much stated repeatedly that predicting the future is not possible based on our current understanding, so the temperature might cool, it might warm, it might stay about the same.
Makes perfect sense. Lindzen’s a smart guy.
This will end up in the Guardian no doubt.
I think that’s where it started originally, in Drillbit Dana Nutthjelly’s blog.
Guardian circulation is cratering, so Dana needs to get controversial or else he’ll be out of his evangelical job.
http://www.theguardian.com/media/table/2013/sep/06/abcs-national-newspapers
In Australia, the Guardian is number 9 news website. Since there are only 7 Australian news websites, its not surprising. Nunavut news could have come in number 8 if they did some self promotion and some poley bear pictures!
http://cdn0.mumbrella.com.au/wp-content/uploads/2013/11/Nielsen.png
This is all Dana knows about the 1989 MIT talk by Lindzen (as linked by SkS)
http://www.fortfreedom.org/s46.htm
And this is the post where Dana goes funny and reconstructs for Lindzen something that Lindzen never said
http://www.skepticalscience.com/lindzen-illusion-2-lindzen-vs-hansen-1980s.html
I suppose this is the next logical step to take. Until now they seem to have largely restricted themselves to distortion, exaggeration and misinterpretation (especially through omission). Now it’s progressed to simply making stuff up.
Who the f*** is ‘Dana’?
Sorry, but I know a bit of whom… former comment missed the /sarc-sign… 😉
If the graph is based on Hansen’s 1988 model, why would he not match the years prior with observations? Same goes for Lindzen in 1969.
I’m guessing “observations” “changed” since then.
So Dana’s new article is based on his own 3 1/2 year old “reconstruction” of Dana’s take on someones else’s beliefs.
I don’t understand where any of this could go wrong. /sarc