
Hansen’s 1988 BAU forecast for scenario A was a complete disaster. They weren’t even in the ballpark.
This is what Dana shows in his 100% fraudulent graph. Nothing about this graph resembles reality.
Hansen’s 1988 BAU forecast for scenario A was a complete disaster. They weren’t even in the ballpark.
This is what Dana shows in his 100% fraudulent graph. Nothing about this graph resembles reality.

What Dana has done is to adjust the Scenario B FOREcast to follow what has HAPPENED in the meanwhile.
Fraud implies a functioning brain, not sure it applies in this case.
It seems Dana just makes stuff up to support a never ending, never fallible stream of propaganda. Appears that he has no shame because he so desperately believes he is correct.
It is disgusting that the public has to be continually bombarded with disinformation. Lots of people still believe we are undergoing catastrophic warming at this point.
Official deception, disguised as “standard models,” “consensus science” and later as “settled science” started at the end of the Second World War to hide the source of energy in the cores of heavy atoms, some planets, ordinary stars, and galaxies: Neutron repulsion
Sixty-eight years of official deception are falsified by precise experimental data shown in Figures 1-3 of my autobiography, A Journey to the Core of the Sun – Acceptance of Reality
https://dl.dropboxusercontent.com/u/10640850/Chapter_2.pdf
The US NAS, the UK’s Royal Society, the National Academies of Science in Gernamy, Norway, Sweden,etc. can show the deceit was unintentional by giving other plausible explanations:
1. The internal composition of the Sun was changed from mostly iron (Fe) in 1945 to mostly hydrogen (H) in 1946, . . . (without discussion or debate) !
2. Textbooks replaced Nobel Laureate Francis W. Aston’s rigorously valid “nuclear packing fraction” with von Weizsacker’s convincing but deceptive “nuclear binding energy” after the Second World War !
If you want to be as fair as possible then Hansen’s Scenario B more closely matches actual emissions. This is because other greenhouse gases besides CO2 did not increase in the atmosphere as anticipated by scenario A.
Nonsense. Radiative transfer models show that the only two greenhouse gases of any significance in Earth’s atmosphere are H20 and CO2. Others are in the noise.
Why do you keep repeating this?
Might I ask why you keep repeating a misdirection?
Will, would you accept the information, if was from other sources and a copy of the original? I am sure you know that Hansen kept saying more warming was in the ‘pipeline’
Trouble is the warming simply has not matched the various model outputs and the divergence is growing. The atmosphere has not been warming, but that is not all.
As Trenberths 2009 email stated ‘The fact is that it hasn’t warmed and it is a tragedy that we cannot account for the lack of warming’. (from memory) His reanalysis of computer outputs suggesting a sequestion of heat below ocean depths of a half mile and remaining there for over a decade is illogical and in opposition to basic science.
So, Will— will you accept actual records if they are presented to you?
darrylb, this is not what’s being discussed. Skeptics have to be held to a higher standard that Eco Worriers. They are free to make stuff up. Skeptic’s aren’t. As soon as you take even a small liberty with the truth, or assert something that’s potentially controversial, it’s an excuse for the media to dismiss all your arguments.
Cut the crap, Will.
Will, I am going to reply a bit more after supper with my wife. Much more important at the moment. Especially if she has a glass of wine. Then again I might reply tomorrow!!
Let’s say you have your particular set of intellectual quirks Steve, but you are entertaining and you do come up with interesting ideas sometimes.
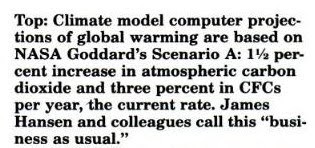
“scenario B assumes a reduced linear growth of trace gases”
James Hansen – 1988
The difference between linear and exponential over such a short time period in the Hansen model is almost entirely irrelevant.
“Obviously, there is no material difference between Scenario A and Scenario B concentrations or, for that matter, with observations up to 2006 or so. CO2 concentrations start to diverge between the two scenarios in the next decade, but, for the near time analysis, calling one graph “exponential” and another “linear” is not really salient to the quantitative analysis (contra Schmidt’s characterization at realclimate.)”
http://climateaudit.org/2008/01/18/hansen-scenarios-a-and-b-revised/
http://stevengoddard.wordpress.com/2014/01/14/hansen-2013-12c-warming-under-business-as-usual-scenarios/
http://stevengoddard.wordpress.com/2014/01/14/hansen-2011-many-meters-of-sea-level-rise-under-business-as-usual-scenarios/
http://stevengoddard.wordpress.com/2014/01/14/hansens-1988-testimony-to-congress-scenario-a-is-business-as-usual/
“The difference between linear and exponential over such a short time period in the Hansen model is almost entirely irrelevant.”
24 years is short? Ok, never mind the duration, what’s the volume difference?
For years, some of us have been saying that climastrology is a fraudulent lie.
Thank you Dana for proving it beyond any reasonable doubt!
Hansen’s Scenario A has CO2 at 398.3 ppm in 2013 which is actually slightly lower than the actual recorded. Scenario B was at 394.8 ppm which is far lower than the actual recorded.
So yeah, people can make stuff up like Dana and Will here but objective people shouldn’t fall for it.
http://www.realclimate.org/data/H88_scenarios.dat
Steve McIntyre reached the same conclusion I did. In the interests of fairness, he also decided scenario B was the closest. You’re a very smart guy Bill, but on this issue you’re falling into the same trap as Steve.
Appeals to authority go straight down the digital toilet here. CO2 is up exponentially. Other gases are irrelevant. Hansen called scenario A BAU.
Steve shows his work and explains his reasoning. He doesn’t make proclamations and then declares, “Trust me”. You know this as well as I do. Grow up.
http://climateaudit.org/2008/01/18/hansen-scenarios-a-and-b-revised/
Bill, I don’t know where those numbers come from at Real Climate, but they do not show a “reduced linear” anything for scenario B. CO2 and N2O both increase exponentially in that table. Looks to me like an attempt to cover up.
“Hansen’s Scenario A has CO2 at 398.3 ppm in 2013 which is actually slightly lower than the actual recorded. ”
How does a calculated exponential increase of 1.5% can end up being “slightly lower” than an actual 2.5% increase after 25 years? I know that (an overestimated amount of) OTGs are included, but they’re apparently miniscule amounts by comparison.
“Hansen’s scenario B projection has been adjusted…”
And compared to a nonexistent Lindzen scenario. Brilliant!
Will N. First, thanks for the reminder, I always appreciate a gentle blow and reminder; never rush a conclusion resulting from some observation, never fall into a trap. My first look was cursory, of course! On this issue, upon giving due diligence, I find that I must agree with Will N. –after reading the Climate Audit bit. Steve,— CO2 is up exponentially? My old eyes see a near linear increase. Perhaps a slight increase in rate.
I also have to state that the whole scenario A ane B divergence is of little consequence.
and I have to say that what is presented at Skeptical Science should be of no consequence; unfortunately, it is because many want it to be.
I appreciate the continual effort Steve puts into presenting both scientific and anecdotal records.
I know of no one that surpasses him.
Again, a note to myself as I am writing on various related subjects in various formats—-never, never, never overstate or fudge anything, and always give due diligence in research, not doing that is the providence of the warmists. The press is obviously pro CAGW in its stance and will find, if they can, the tiny sliver in my eve.
However, I do believe the warmists are finding the increasing possibilities of cooling is making them sweat.
Also, this whole thing should never have been them against us. It should always be education and adaptation to the most likely scenarios.
CO2 since 1988 is not scenario B “reduced linear growth” It is exponential growth
Hansen called Scenario A BAU when he wrote that bit of fantasy and when he presented it to Congress! I do not care who wants to claim B has any meaning, because B never happened! C never happened so Hansen and his defenders need to STFU and face the reality that A was BAU and is still BAU. Scenario A is the only line in that graph that can be compared to records to verify Hansen’s Prognostication! He was wrong then and his followers are wrong today.
@Will Nitschke
… Skeptics have to be held to a higher standard that Eco Worriers. They are free to make stuff up. Skeptic’s aren’t. As soon as you take even a small liberty with the truth, or assert something that’s potentially controversial, it’s an excuse for the media to dismiss all your arguments…
Although I am a died-in-the-wool denier, I’m with Will on this.
It’s a matter of tactics. If we start fiddling or bending the truth, even by a little bit, the controversy will be seen by undecided players as being a battle between two sets of liars. If, however, we remain whiter-than-white, we claim ALL the truth for ourselves, and our opponents are forced into taking the controversial or downright wrong ground for themselves. So long as we say NOTHING that can be credibly refuted, our opponents are forced to up the ante by making wilder and even wilder claims.
My understanding of the battleground is that the science has already been won. There hasn’t been a defensible new technical paper put out in years. We are now moving into the political battle, where appearance is important, and staying level-headed will force the other side to exaggerate. They are doing this all the time now, and losing support hand over fist. Stay with the winning tactics!
You too are a victim of an old Jedi mind trick.
I’ll explain the trick
Dana set out onto his psychotic journey to compare Lindzen and Hansen and their ability to predict i.e. understand the climate.
This was supposed to be based on what the two said at the end of the 1980s.
One problem is that Lindzen never said what Dana hallucinated him saying.
The other problem is that neither did Hansen. Reanalyses done 20 years later don’t matter. Even a poor mathematician such as Dana can concoct ways to change past predictions around more recent data.
Hansen’s BAU is wrong despite 25 years of BAU. Simple.
Thankyou omnologos. Some sanity. You addressed the topic of Linzen vs Hansen without diverting into other issues. Nutty Celli employed the old “straw man” fallacy by showing a prediction he reconstructed from something Lindzen said. Why didn’t he use Lindzen’s actual prediction? Because it wouldn’t have shown what Nutty Celli wanted it to. And heaven only knows where he got his “observed temperature” trace from.
P.S. ‘Died’ should have been ‘Dyed’ – but in retrospect I quite like the ‘dead in the ditch’ implication as well. Freudian?
Steven, you should be using Scenario B. I looked closely at the difference between scenarios a few years ago – see http://climateaudit.org/tag/scenario-b/ – and determined that Scenario A assumed major increases in CFC concentrations that have not occurred. The most reasonable basis of comparison is Scenario A. Better not to conflate this issue with the misrepresentation of Lindzen.
I understand your point about the CFC’s, but there are number of points which sway me the other direction.
1. Hansen’s 1988 definition is “reduced linear growth of trace gasses.” CO2 has increased exponentially.
2. The concentration of CFC’s is extremely small 250-500 PPT. The increase in CO2 overwhelms the CFC numbers
3. Hansen used numbers three orders of magnitude too large for his CFC numbers (262 PPB for 1988 scenario B – should be more like 262 PPT)
4. Radiative transfer models show that a doubling or tripling of methane and CFC’s has very little effect on downwelling longwave radiation.
And mainly because Hansen called scenario A BAU, and continues to say that we are on a BAU track. They can’t have it both ways.
I am ready to produce a graph with 1,000 different scenarios (*) and will await the day in 2044 when I will be eventually shown right.
(*) with a temp increase over 30 years uniformly ranging from -10C to +10C
You and the IPCC promoters! 😉
Steve, your arguments about Scenario A are incorrect. Notwithstanding your various assertions, the incremental forcing from CFCs in Scenario A was very large and make its forcing assumptions unrealistic. In any event, the debate about Scenario A and B has been going on for years – since at least Pat Michaels. This is an old debate, while the attribution to Lindzen of a projection that he never made is a new and surprising development: why conflate the two?
Steve, Hansen has consistently said that we have continued down BAU – or worse.
If we are off BAU, then “it’s better than it seems”
If we are still on BAU, then Hansen’s forecast is even more defective
Why let them have it both ways?
Steve Mcintyre:
You were wrong to make the claims you did years ago and you are still wrong about which scenario should be used for Hansen’s fantasy projection. BAU means exactly BAU!
To Steve M.
Why do you maintain such a narrow focus on criticism of the methods of climate scientists?
Is it to prevent watering down of the message?
Academic politeness?
Or is there no interest in the issues external to the science?
Thanks for your efforts.
Hansen was wrong every which way. CO2 Emissions increased more then he projected, The earth warmed less then his scenario C, reduce to zero all emissions. That is the story, and it is not controversial. Politically CAGW should be dead.
(All the rest is pedantic academic haggling, fit for a class room, unfit for policy).
There has been a rapid curtailment of man’s co2 since 1988. We are saved, just look at observed temperatures, Hansen is a star. 🙂
Whichever way you look at it his projections are crap and likely to get even worse over the next decade. How people can defend his projection is beyond me. How much longer can he still be ‘right’? There will come that moment you know. 🙁
So Nutty recreated Prof Lindzens predictions. From 1958 ????
That is brilliant! Who knew there was another Prof. Lindzen?
Looking at the leaked AR5 graph, which ones were Jimmy Handjobs?
That would make for a tidy comparison. Theres nothing like hitting them back with the soggy end.
As it is possible to (re-)characterise ‘Scenario C’ as ‘changes in CO2 will have no effect on GST’ I think the graph above makes that point rather well!
Hansen made presumptions on CO2 and temperature that simply do not exist in any of his scenarios. They do not exist on Venus, Mars nor Earth. Altering his guesswork and faulty “models” cannot make it any more correct than presuming predictions Lindzen never made and correcting his line with modern facts and figures. This is a non-existent assumption and has not been “corrected” in line with… whatever guess fits today.
There is a nonsense and non-science.
I’m still waiting for Hansens hot, flooded and crime ridden NY.
You miss the point.
The longer that GST tracks ‘Scenario C’ the easier it is to ‘prove’ that the concept of CAGW is not based on factual evidence/science.
Whatever people are prepared to agree, the one thing that I think we all can agree on is that CO2 did NOT track the levels set out in ‘Scenario C’. Yet temperatures ARE doing so.
From there it is a small step to conclude that CO2 and GST are unrelated (or at least as far as how the models and the science that supports them claim that they are)!
Thanks Richard… If only I knew all your buzzwords I’d be in on the game.
We basically agree though. Here’s some proof.
http://www.woodfortrees.org/plot/hadcrut3vgl/from:1997/offset:-0.4/mean:12/plot/esrl-co2/from:1997/normalise/mean:12/detrend:0.81/offset:0.45/scale:6
CO2 lags behind the heating. CO2 does not create heating. This trace disproves seasonal growth and dieback with the two year lags.
What the adjustment numbers do is make CO2 raise above temps, (offset), detrends the climb, normalise makes the levels meet on the graph and scale magnifies the CO2 variances. Oh and the “mean” with 12 is one year smoothing.
You like? 🙂
Andyj:
GST = Global Surface Temperature
CAGW = Catastrophic Anthropogenic Global Warming
Scenario C = Fictional CO2 concentration levels put into the models
Therefore if GST tracks the fictional levels, CAGW = Fiction.
Ta!
So it’s one of these lines then. 😉
http://tucsoncitizen.com/wryheat/files/2013/06/CMIP5-73-models-vs-obs-20N-20S-MT-5-yr-means1.jpg
No Its the bottom line in the graph at the very top of this post. The ‘fictional’ one that GST has tracked rather well.
http://stevengoddard.files.wordpress.com/2014/01/screenhunter_1716-jan-13-17-41.gif
WUWT:-
“scenario C assumes a rapid curtailment of trace gas emissions such that the net climate forcing ceases to increase after the year 2000.” Hansen’s predicted temperature increase, from 1988 to 2012, is 0.29 ?C, ONLY 31% HIGHER than the actual increase of 0.22 ?C.”
CO2 has no effect. Has maxed out.
Gotchya! and thx.
The graph I sent is proof, if anything seems to show CO2 is a coolant gas.
“scenario C assumes a rapid curtailment of trace gas emissions such that the [effect of the] net climate forcing ceases to increase after the year 2000.”
Works for me.