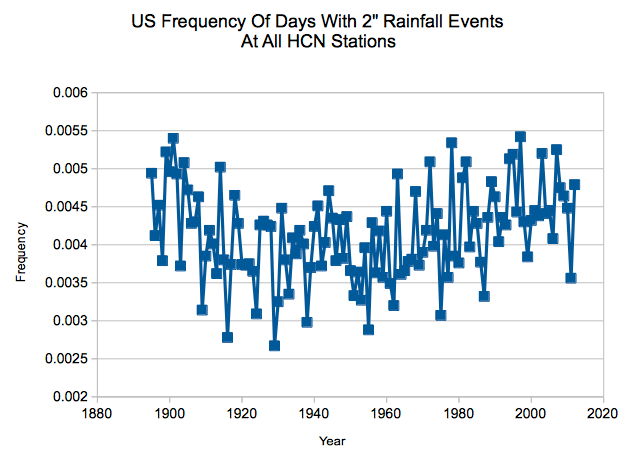
Two inch rainfalls peaked around 1900, and again in the 1990’s. The pattern is an oscillation, not a linear trend.
On a side note, we had more than an inch of rain yesterday, yet the Fort Collins weather station reported 0.00. It looks like their rain gauge is broken.


How do professional gauges work?
My own (amateur) used to get spiders in it which built webs, which stopped the rocking bucket.
I would hope the professionals would have something better.
Looks like precipitation data is a little iffy in the GHCN database. At what year to you conclude it becomes reliable? And how did you filter for GT 2″ (using GT rather than “greater than” symbol in case it thinks its HTML)
test : > (GT Symbol was here)
I am uncder the impression that there has been an increase in the number of U.S. stations in the last 50 years — and that is one reason why we see the # of record highs on an ongoing basis: the 1930s are not included in these newer stations. When you prepare your graph, can you control to include only stations that have been aroudn for all 130 years and have complete information for all years?
This graph is a ratio of number of events divided by the number of readings (a dimensionless number) – so the number of stations doesn’t matter. The number of stations is dropping sharply since the 1980s.
Thanks for the explanation on frequency. I should have figured noticed that on the vertical axis.
On the number of stations, I know that the number of GHCN stations used by GISS has dropped sharply since the 1980s, and according to some analyses that has contributed to the warming trend in its estimate. However, I thought that the number of stations that NOAA looks at has increased in the last fifty years. Are the HCN stations you used in your graph a subset of the GHCN database?
in re to your rain gauge comment, we had a similar event here, it rained so hard the parking lots had half an inch of water over them and wipers on high in a parked car couldn’t get the window clear enough to drive – the weather channel reported 0.01″ that day.
I wonder if the 4+ inches on 5/02 will be counted? The main corridor flooded for the first time since Hurricane Isabel. But, that was only “local weather”.