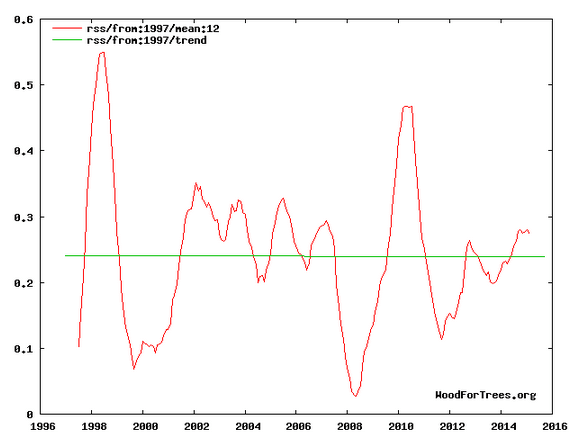
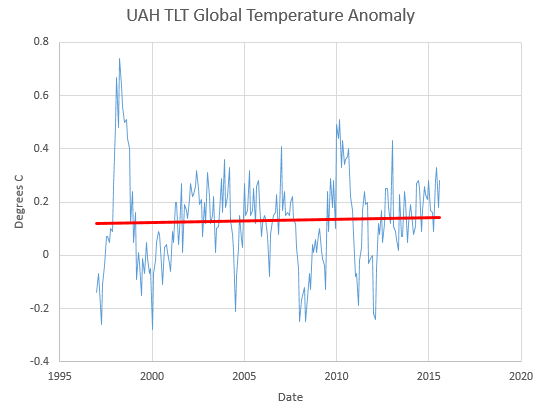
Among satellites which study Earth’s temperature, 100% of them agree that Earth is not warming.
Wood for Trees: Interactive Graphs
vortex.nsstc.uah.edu/data/msu/v6.0beta/tlt/uahncdc_lt_6.0beta3.txt
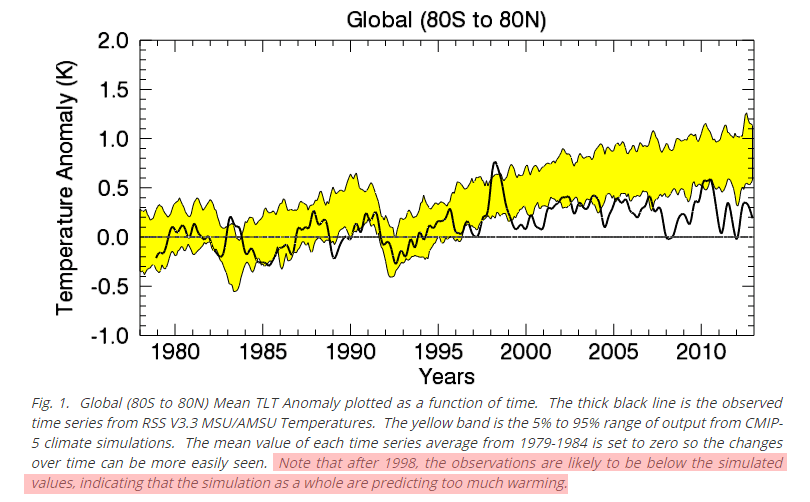
By contrast, 100% of climate models are wrong.
So how do climate experts respond to this? They ignore the best data we have from satellites, and rely on completely worthless climate models.


Since 100% of their funding is dependent on global warming, 100% of climate scientists are going to agree that there is global warming.
Is there any proof the LIA ended in 1850??
If it ended in 1990….there’s been no global warming since the end of the LIA
Good point. If it ended in the 1930s then we have had cooling since the end of the LIA.
Curve fitting worked up to 1998. They could go back to more curve fitting to make it all come out to 2015 observations, but then they would have admit that there hasn’t been much if any warming.
Steve, have you any data from the balloons and other atmospheric temperature measuring technologies?
Presumably, for fairly obvious reasons they would be at least as relevant as the satellites?
http://cdiac.esd.ornl.gov/ftp/trends/temp/angell/
Ta!
http://cdiac.ornl.gov/trends/temp/angell/graphics.html
http://www.woodfortrees.org/graph/rss/from:2002/trend/plot/uah/from:1997/plot/rss/from:1997/plot/uah/from:2002/trend/plot/none
I am not happy with UAH
My own [3] data sets say it is cooling at about 0.01K per annum since 2000.
RSS seems to come closer to my results.
Either way, it is a small amount,
so nobody really sees or feels a difference.
UAH version 6.0 Beta gives a trend much more similar to that of RSS’s. See this pre-paper for information about it: http://www.drroyspencer.com/wp-content/uploads/Version-61.pdf.
If I look at my own data set, I also get 0,010K/annum since 1980.
However, if I look from 2000 I get -0.01K/annum
That means we started crossing a point some time around 1995
as can be seen also at the change in rate of minimum temperatures
https://i0.wp.com/oi62.tinypic.com/33kd6k2.jpg
This graph also shows that there is no AGW as it should affect minima, showing up some chaos.
but there is no chaos. It is a 100% correlation on a random sample, balanced by latitude. (balancing on longitude is not important as long as we look at K/annum )
I would refrain from saying there is “No AGW”, as virtually all climate scientists have come to that conclusion, but, as with all sciences, there is a slim chance that everything we think we know may be wrong.
Hi just another person
you say
I would refrain from saying there is “No AGW”, as virtually all climate scientists have come to that conclusion, but, as with all sciences, there is a slim chance that everything we think we know may be wrong.
In fact, during my investigations I did come across some results that do look like AGW, namely the large increase in minima in Las Vegas, from 1973-2014, where they turned a desert into a green oasis.
Then I also came across a large drop in minima in Tandil, Argentine, from 1973-2014. I found out that this is where they chopped the trees, in great numbers…..
What does that tell you?
More vegetation traps heat, less vegetation causes cooling.
Which one is more, AGW or AGC?
From my results, it looks that the positives cancel out the negatives.
AGW or AGC is immeasurably small compared to the heat from the natural process on the Sun.
I don’t have the expertise to say if the positives cancel out the negatives, but the point of the greenhouse effect is that the greenhouse gases harness the heat of the natural processes from the sun and keep some of it from escaping to space.
Most every notable skeptic agrees with the notion that CO2 can cause warming, e.g. S. Fred Singer, John Christy, Roy Spencer, Sherwood Idso, Richard Lindzen, Patrick Michaels, Henrik Svensmark, David Douglass, Petr Chylek, Craig Loehle, Nic Lewis, Paul Knappenberger, etc.
Henry, I think WFT still uses UAH5.6
UAH 6 shows a tiny negative trend since 2002
http://s28.postimg.org/69f65awd9/RRRv_UAH.jpg
DOH!.. my graph goes from 2001, not 2002.
Thx. I will check tomorrow. H
Cannot find the reported vs 6 of UAH data/ original graph
either way
it is better to look at the acceleration/deceleration of warming,
ie. the rate of warming/cooling
SI dimension:
K/annum square
A bit of something to have a chuckle at. They probably got paid to produce this. !
http://www.abc.net.au/news/2015-09-29/sharks-and-other-predators-help-prevent-climate-change/6813042
OH goody, so maybe we should start feeding the sharks politicians and lawyers to keep them healthy and increase the numbers.
“feeding the sharks politicians and lawyers to keep them healthy”
?
To keep the sharks nice and health with lots of food so they breed better. In livestock breeding it is called FLUSHING
ABSTRACT
Could that not in the long run provoke a mad shark disease ?
can i make them into chum first gail 🙂
Start with hanged, drawn and quartered since it fits so nicely.
Better Mad Shark disease then Mad Marxist diseased politicians and lawyers. Besides if the brain and spinal cord are removed before chumming there is no chance of infecting the sharks. The problem is trying to find a brain and spinal cord in the politicians.
The sharks have already being trained to attack scientific instruments.
http://www.abc.net.au/news/2015-09-29/shark-tries-to-eat-uwa-underwater-glider-off-perth-yanchep-coast/6813166
Reblogged this on Climatism.