
US trends since 1930, taken from Index of /pub/data/ghcn/daily/hcn/
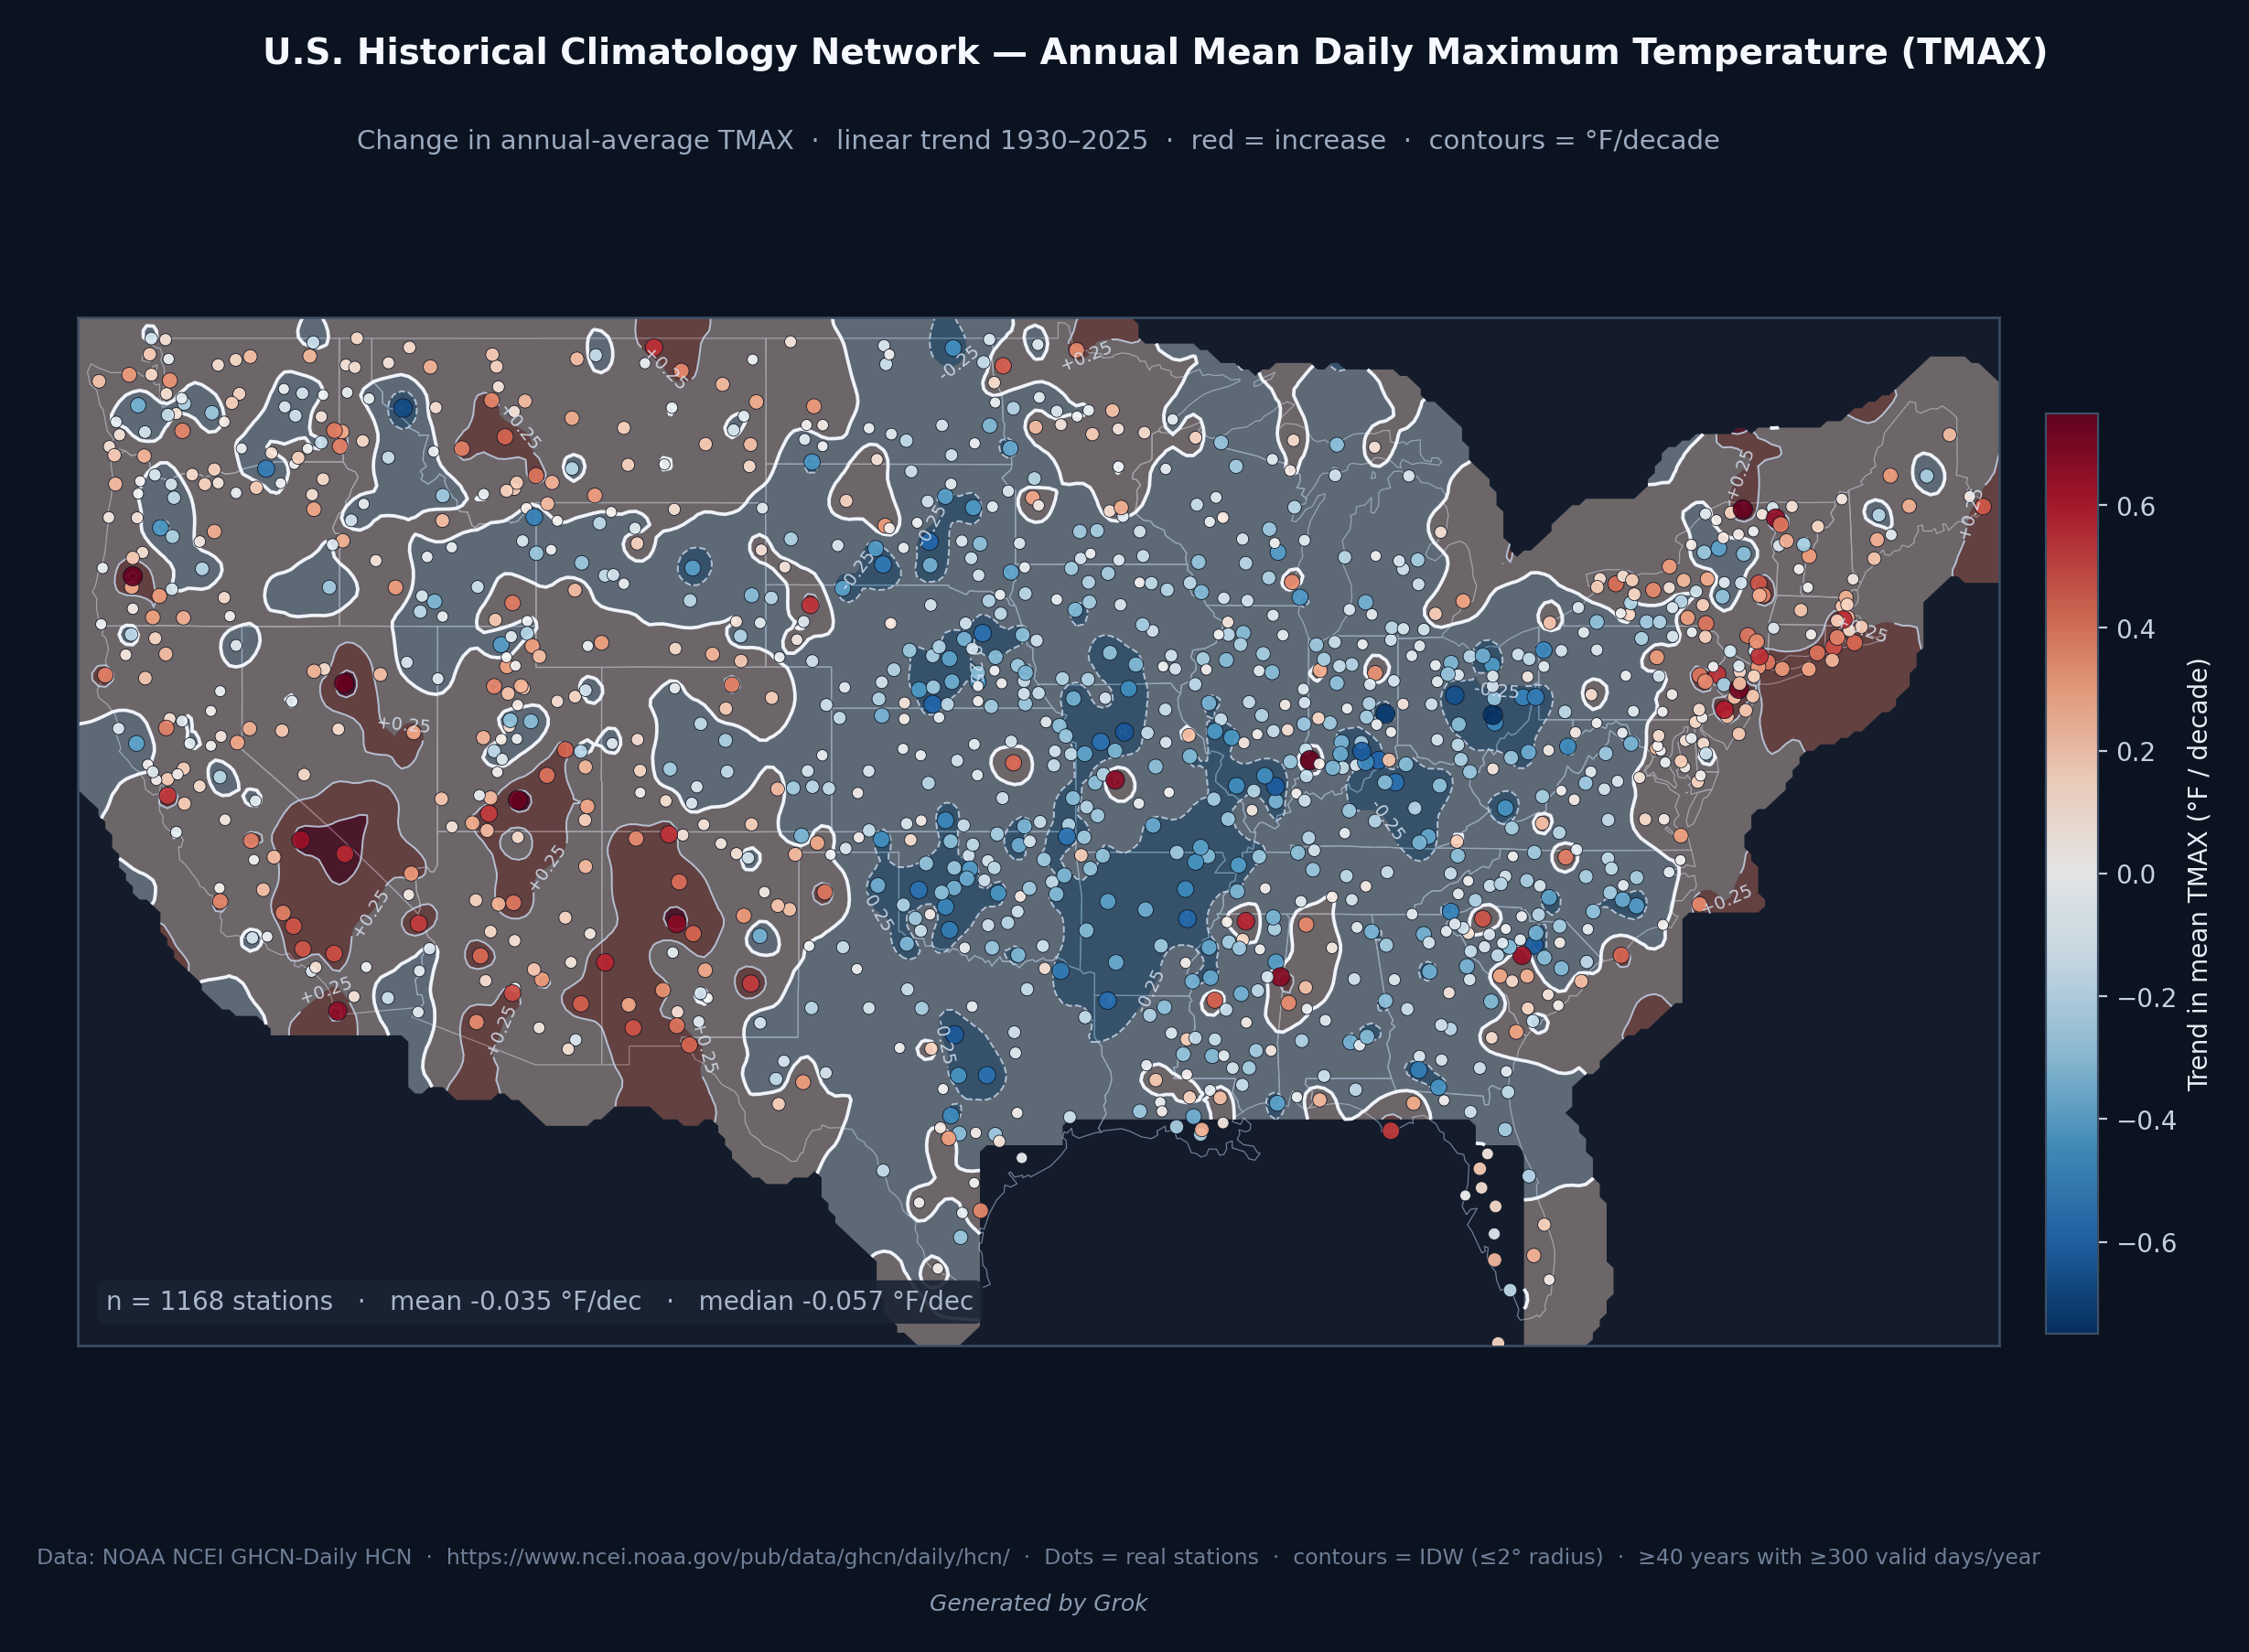
Daily maximum temperature.
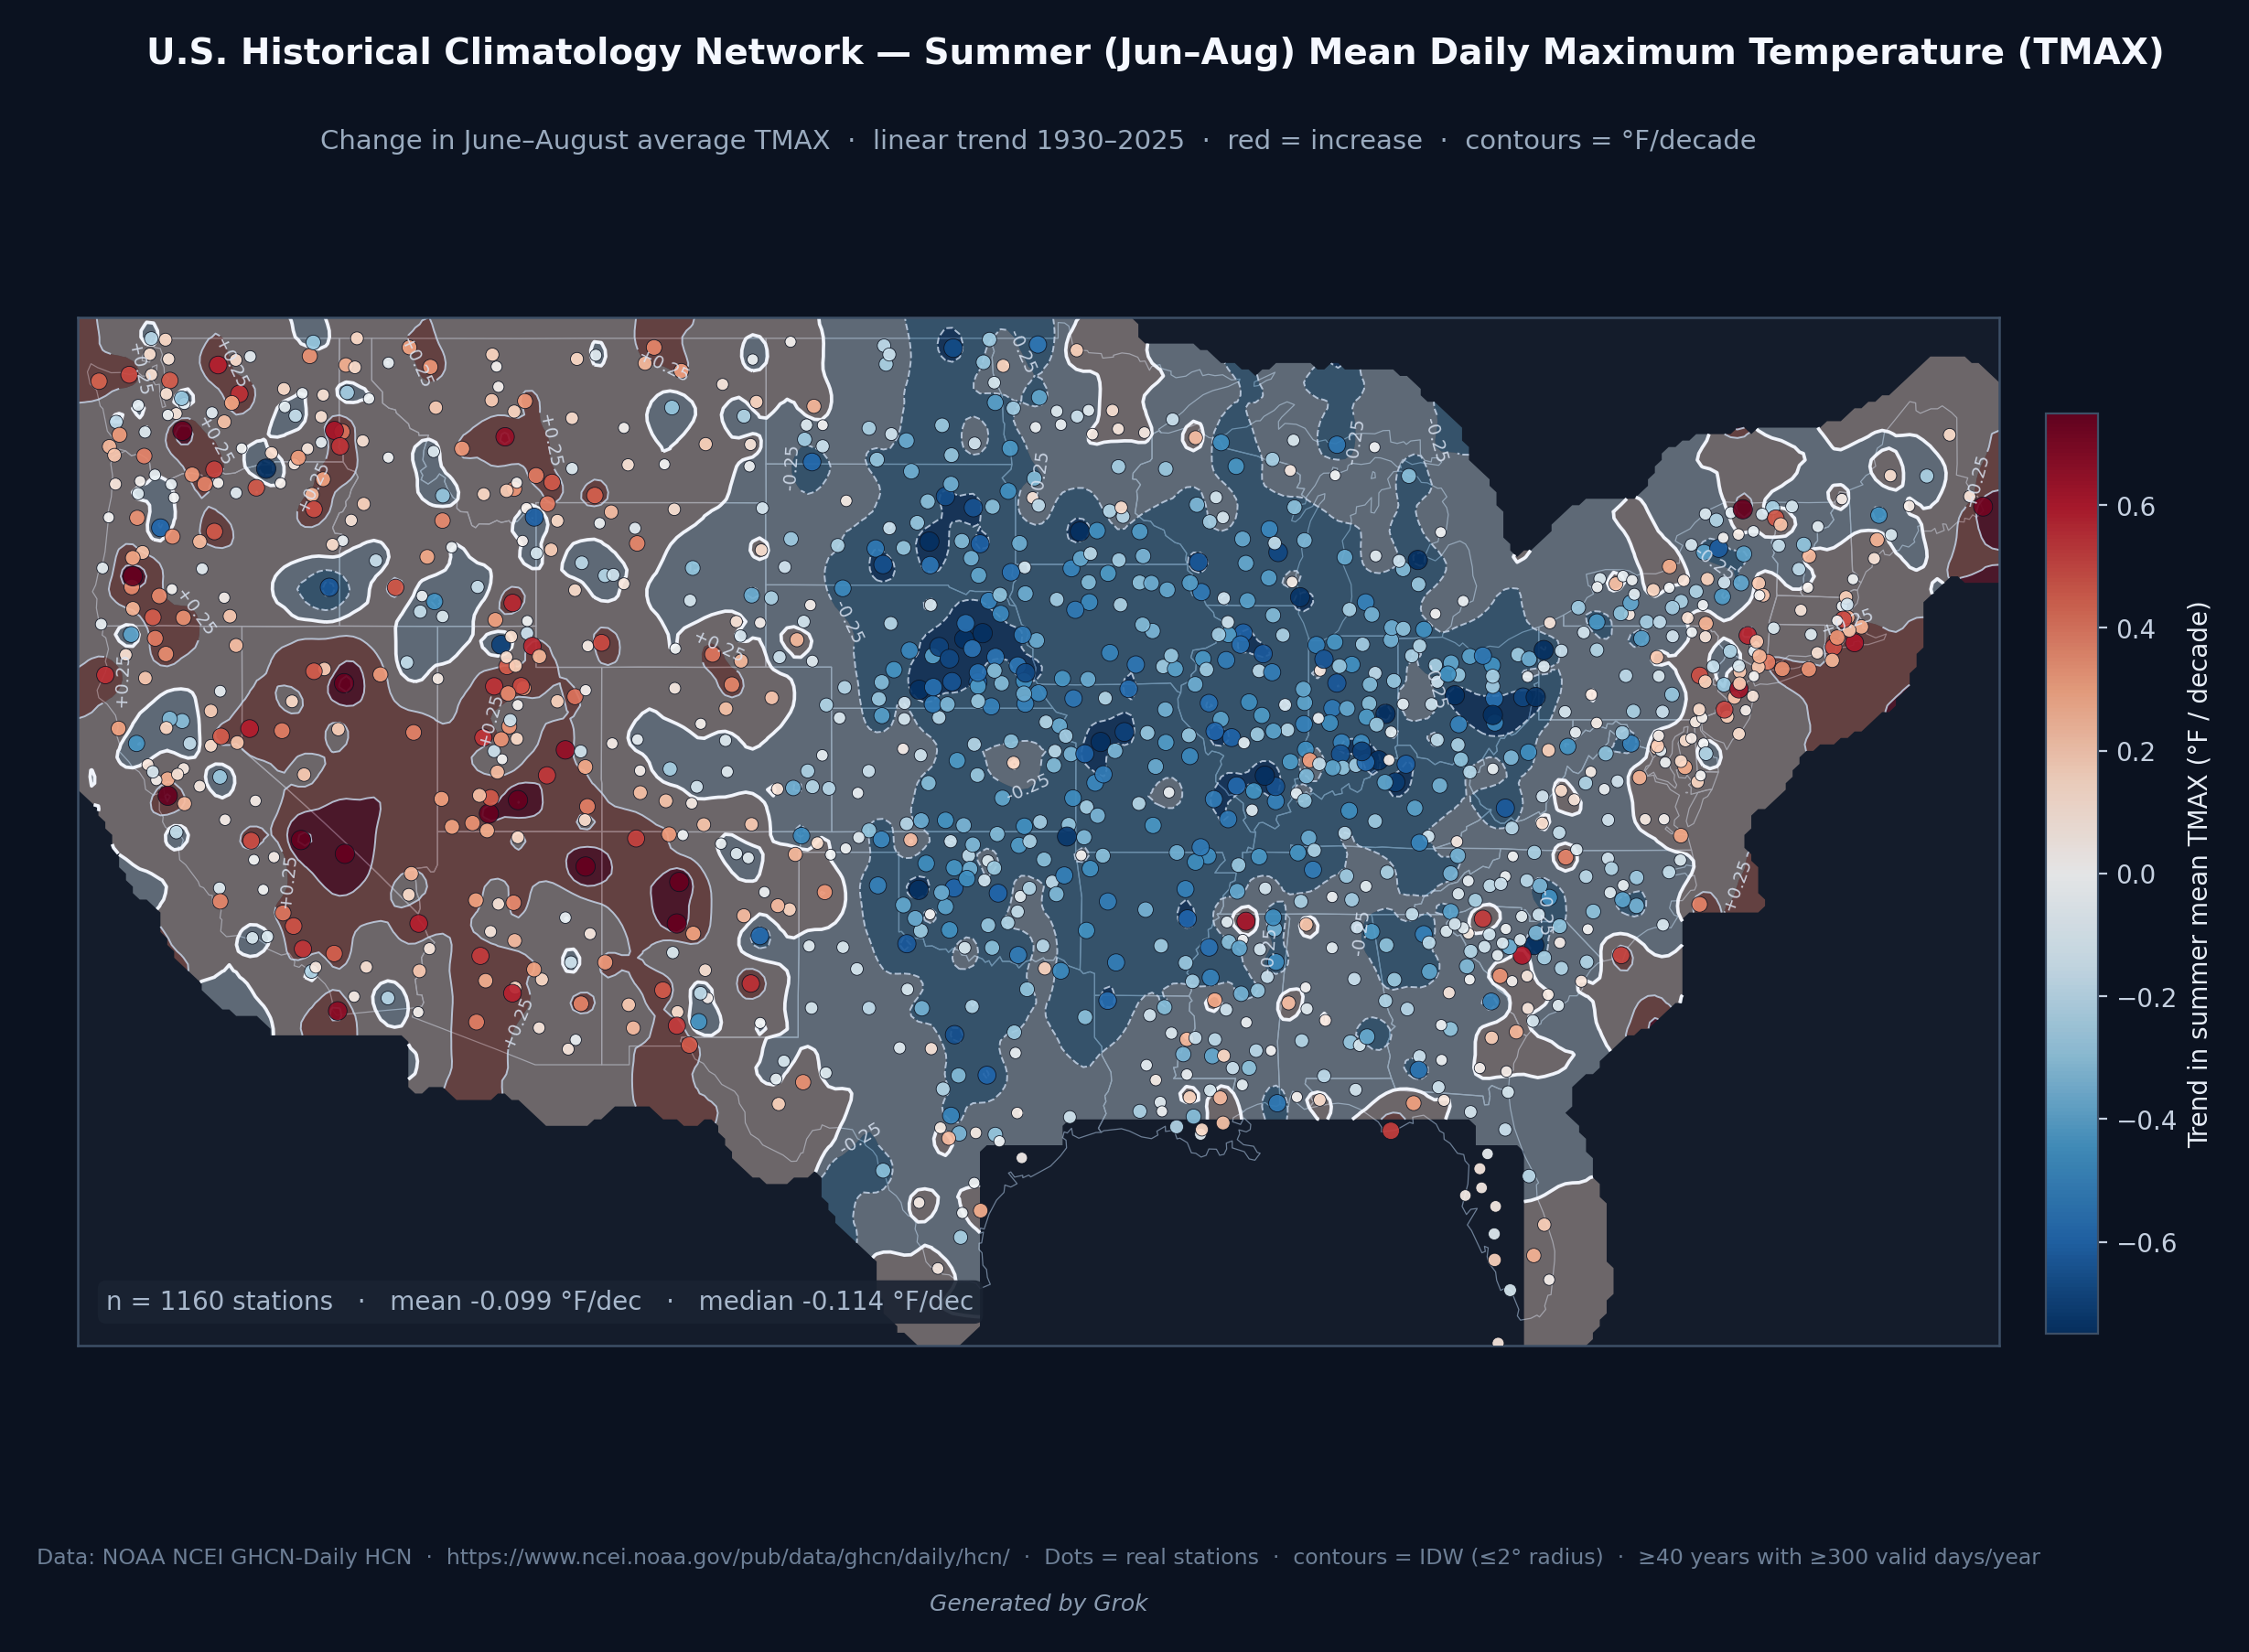
Summer daily maximum temperature
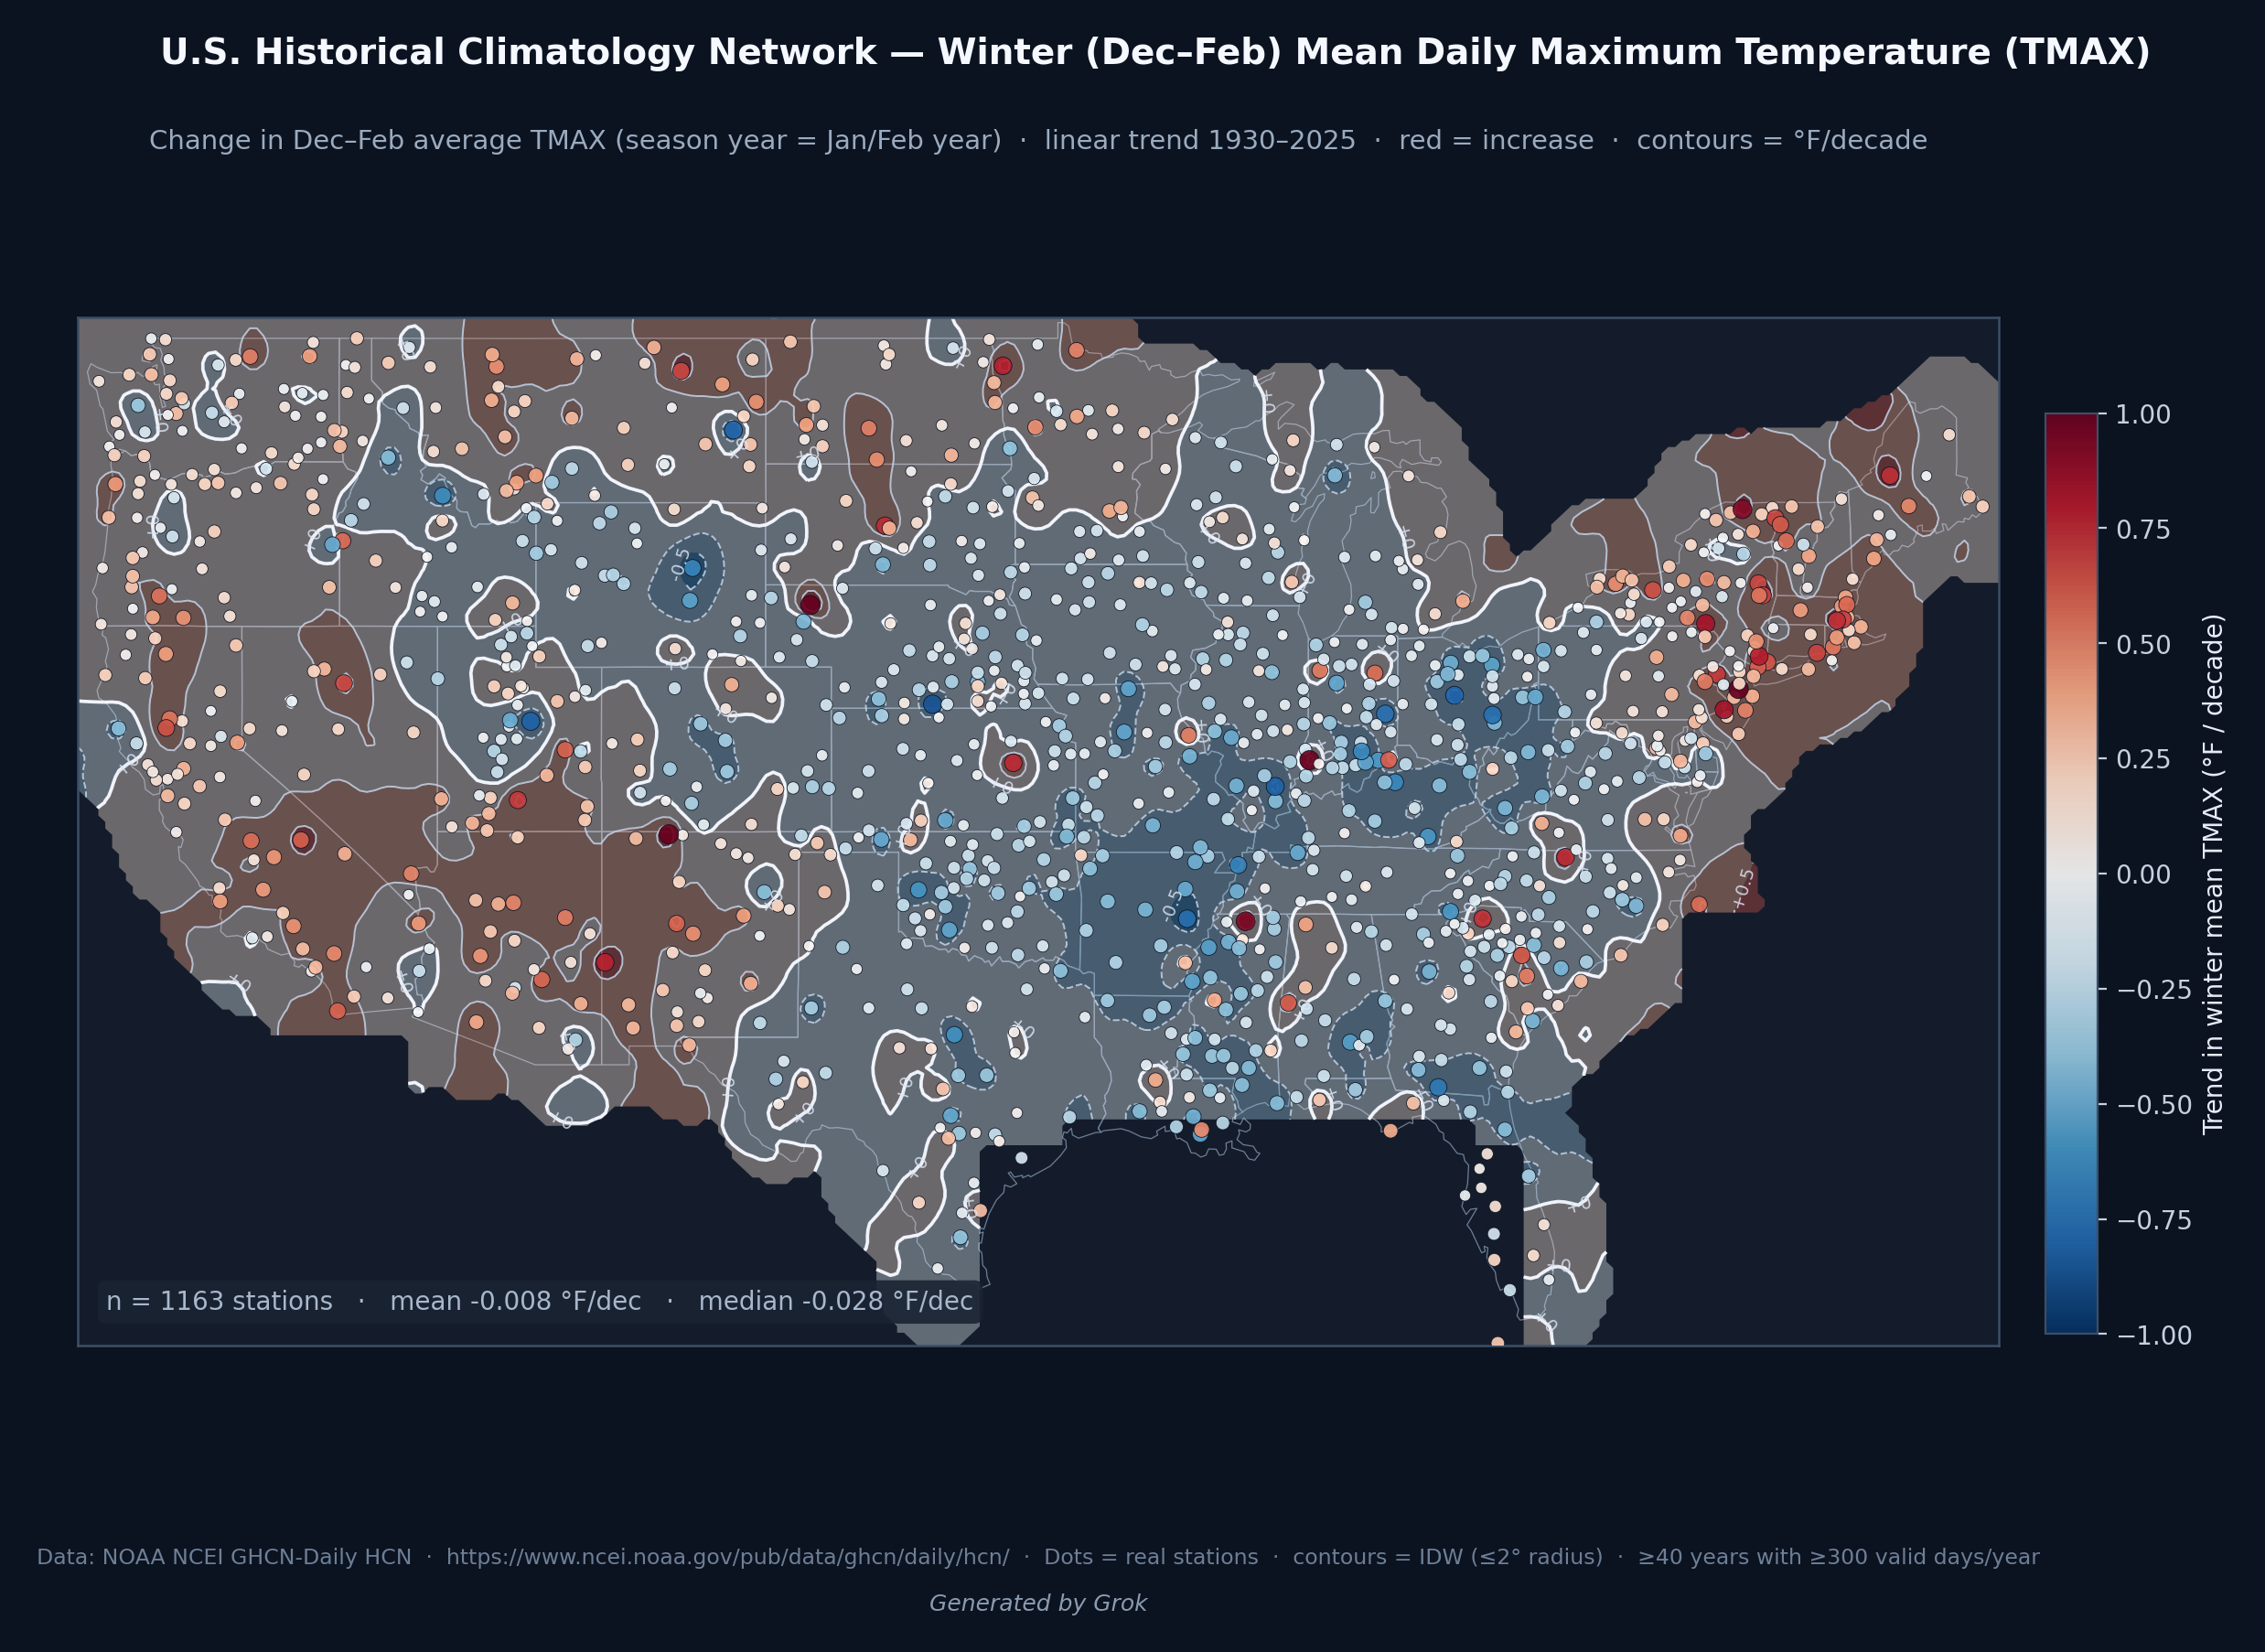
Winter daily maximum temperature
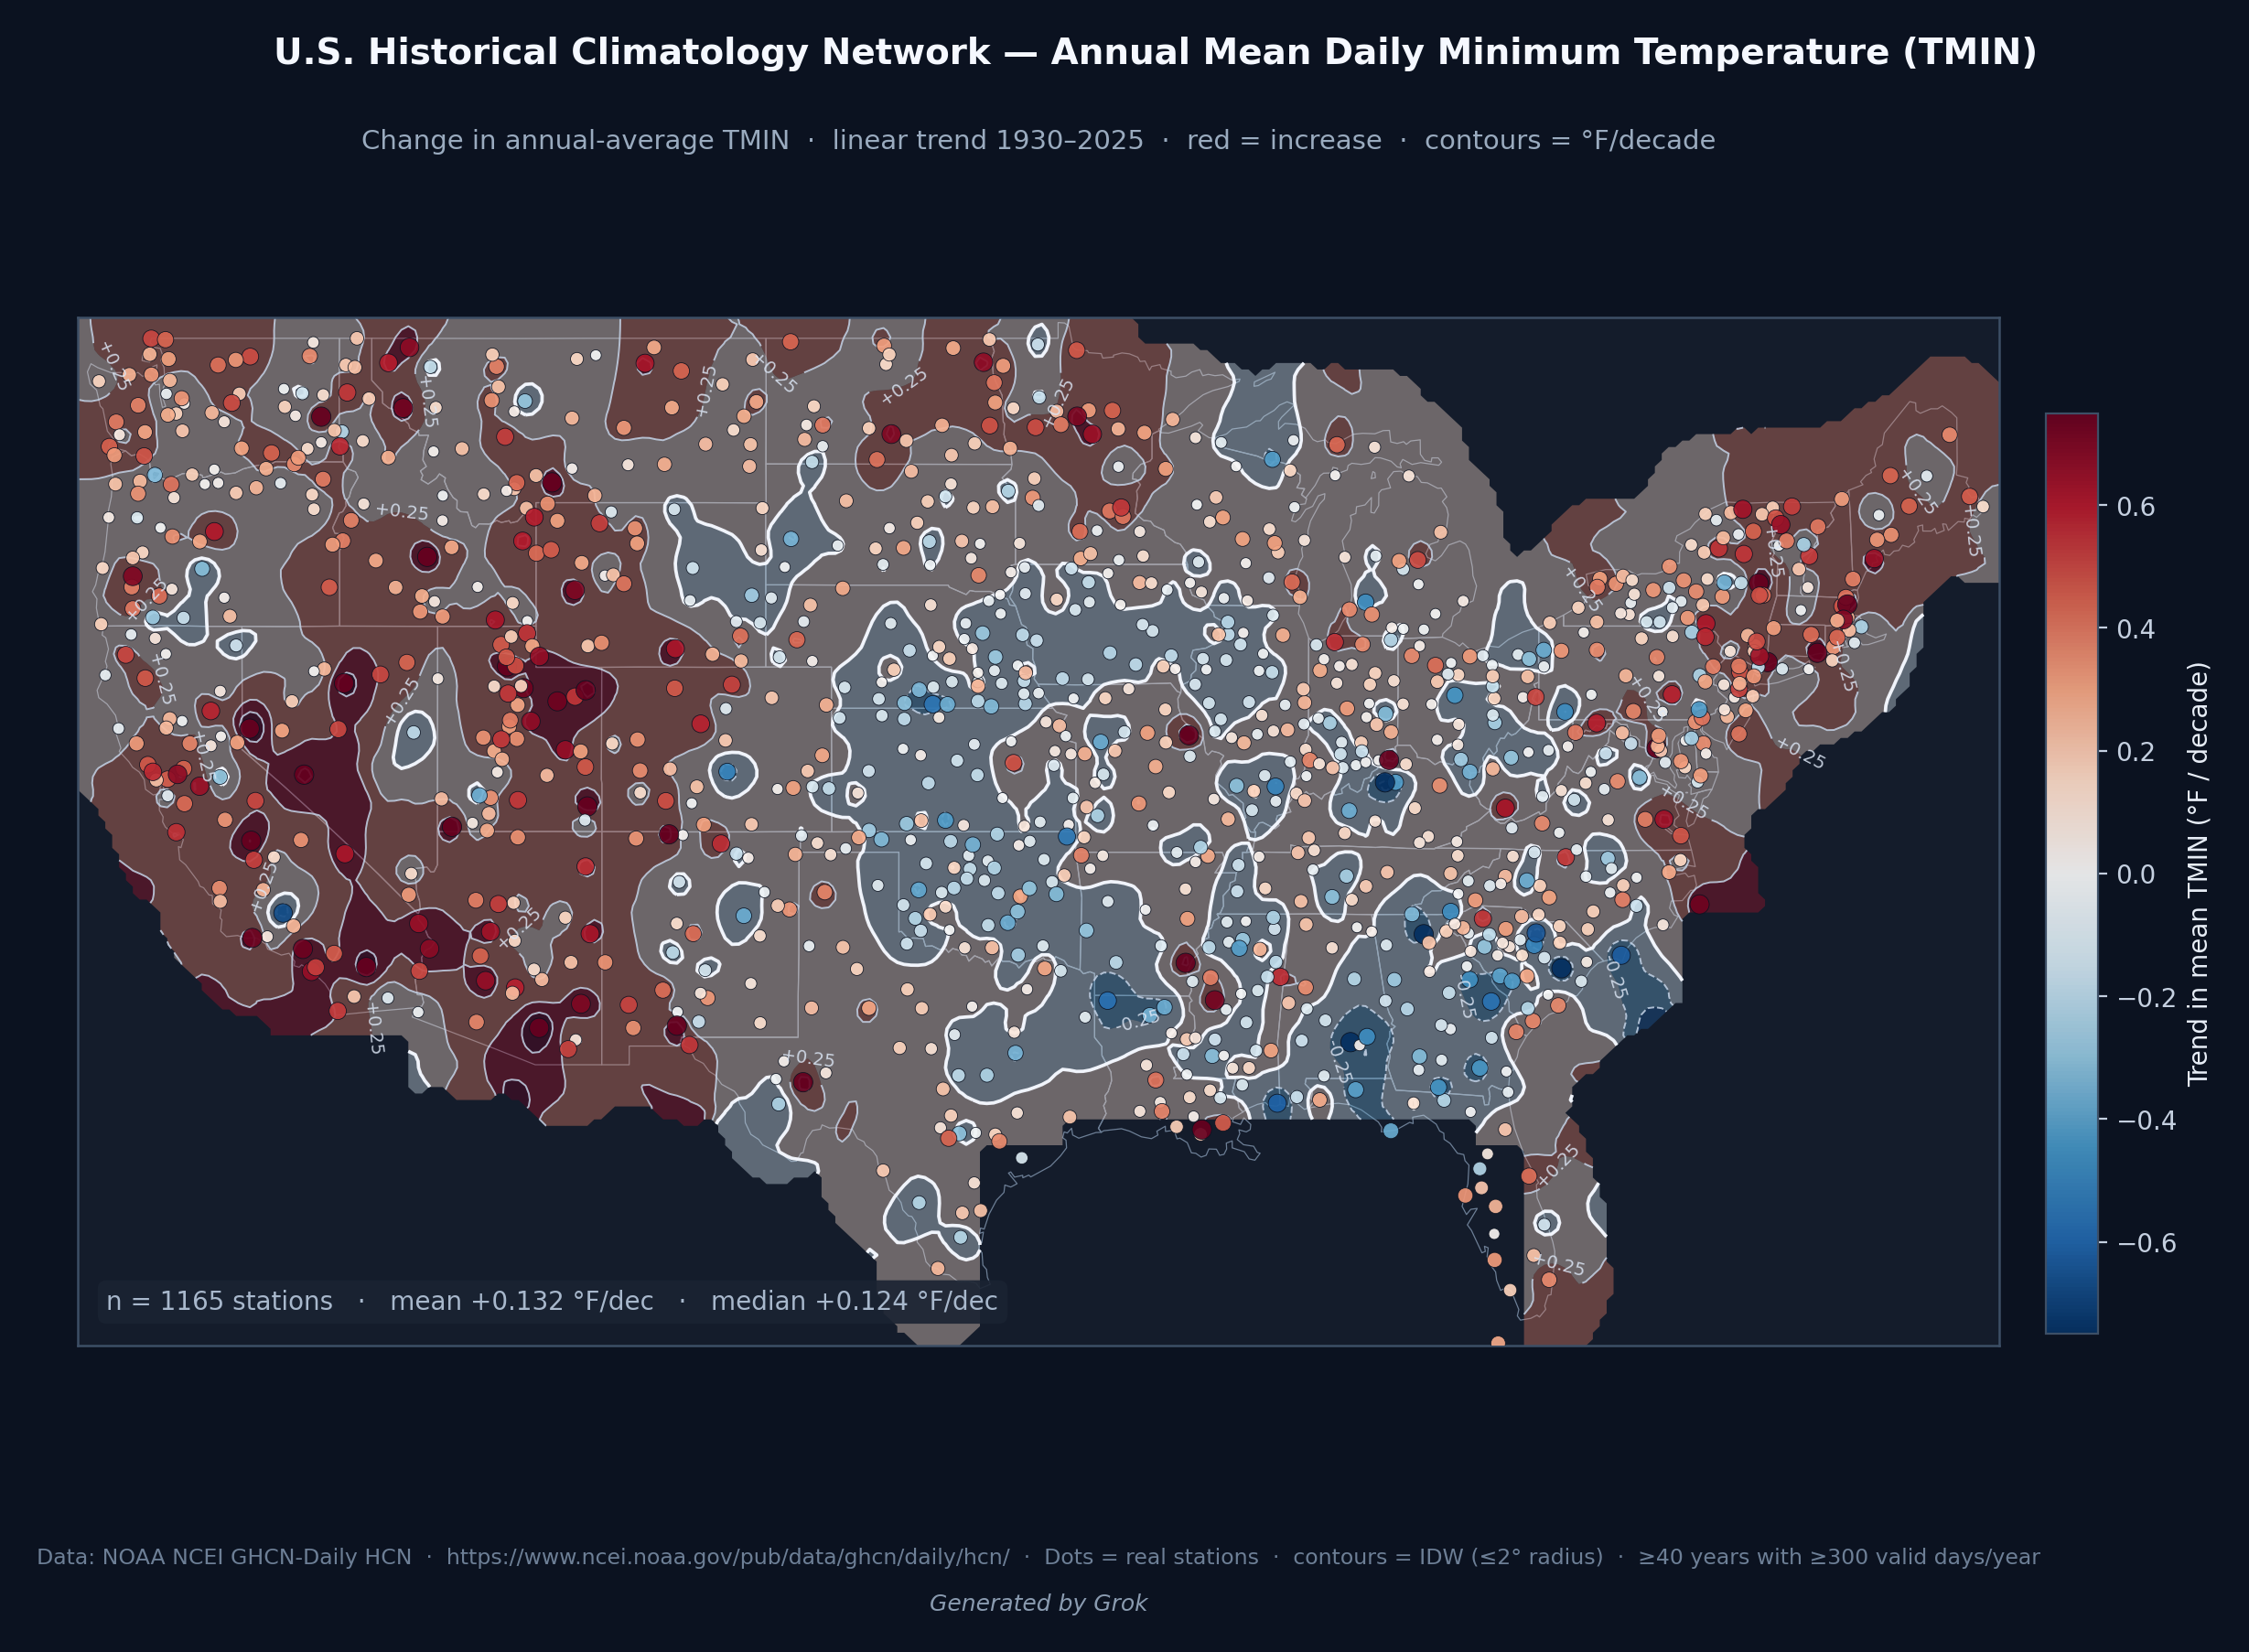
Daily minimum temperature.
Summer daily minimum temperature.
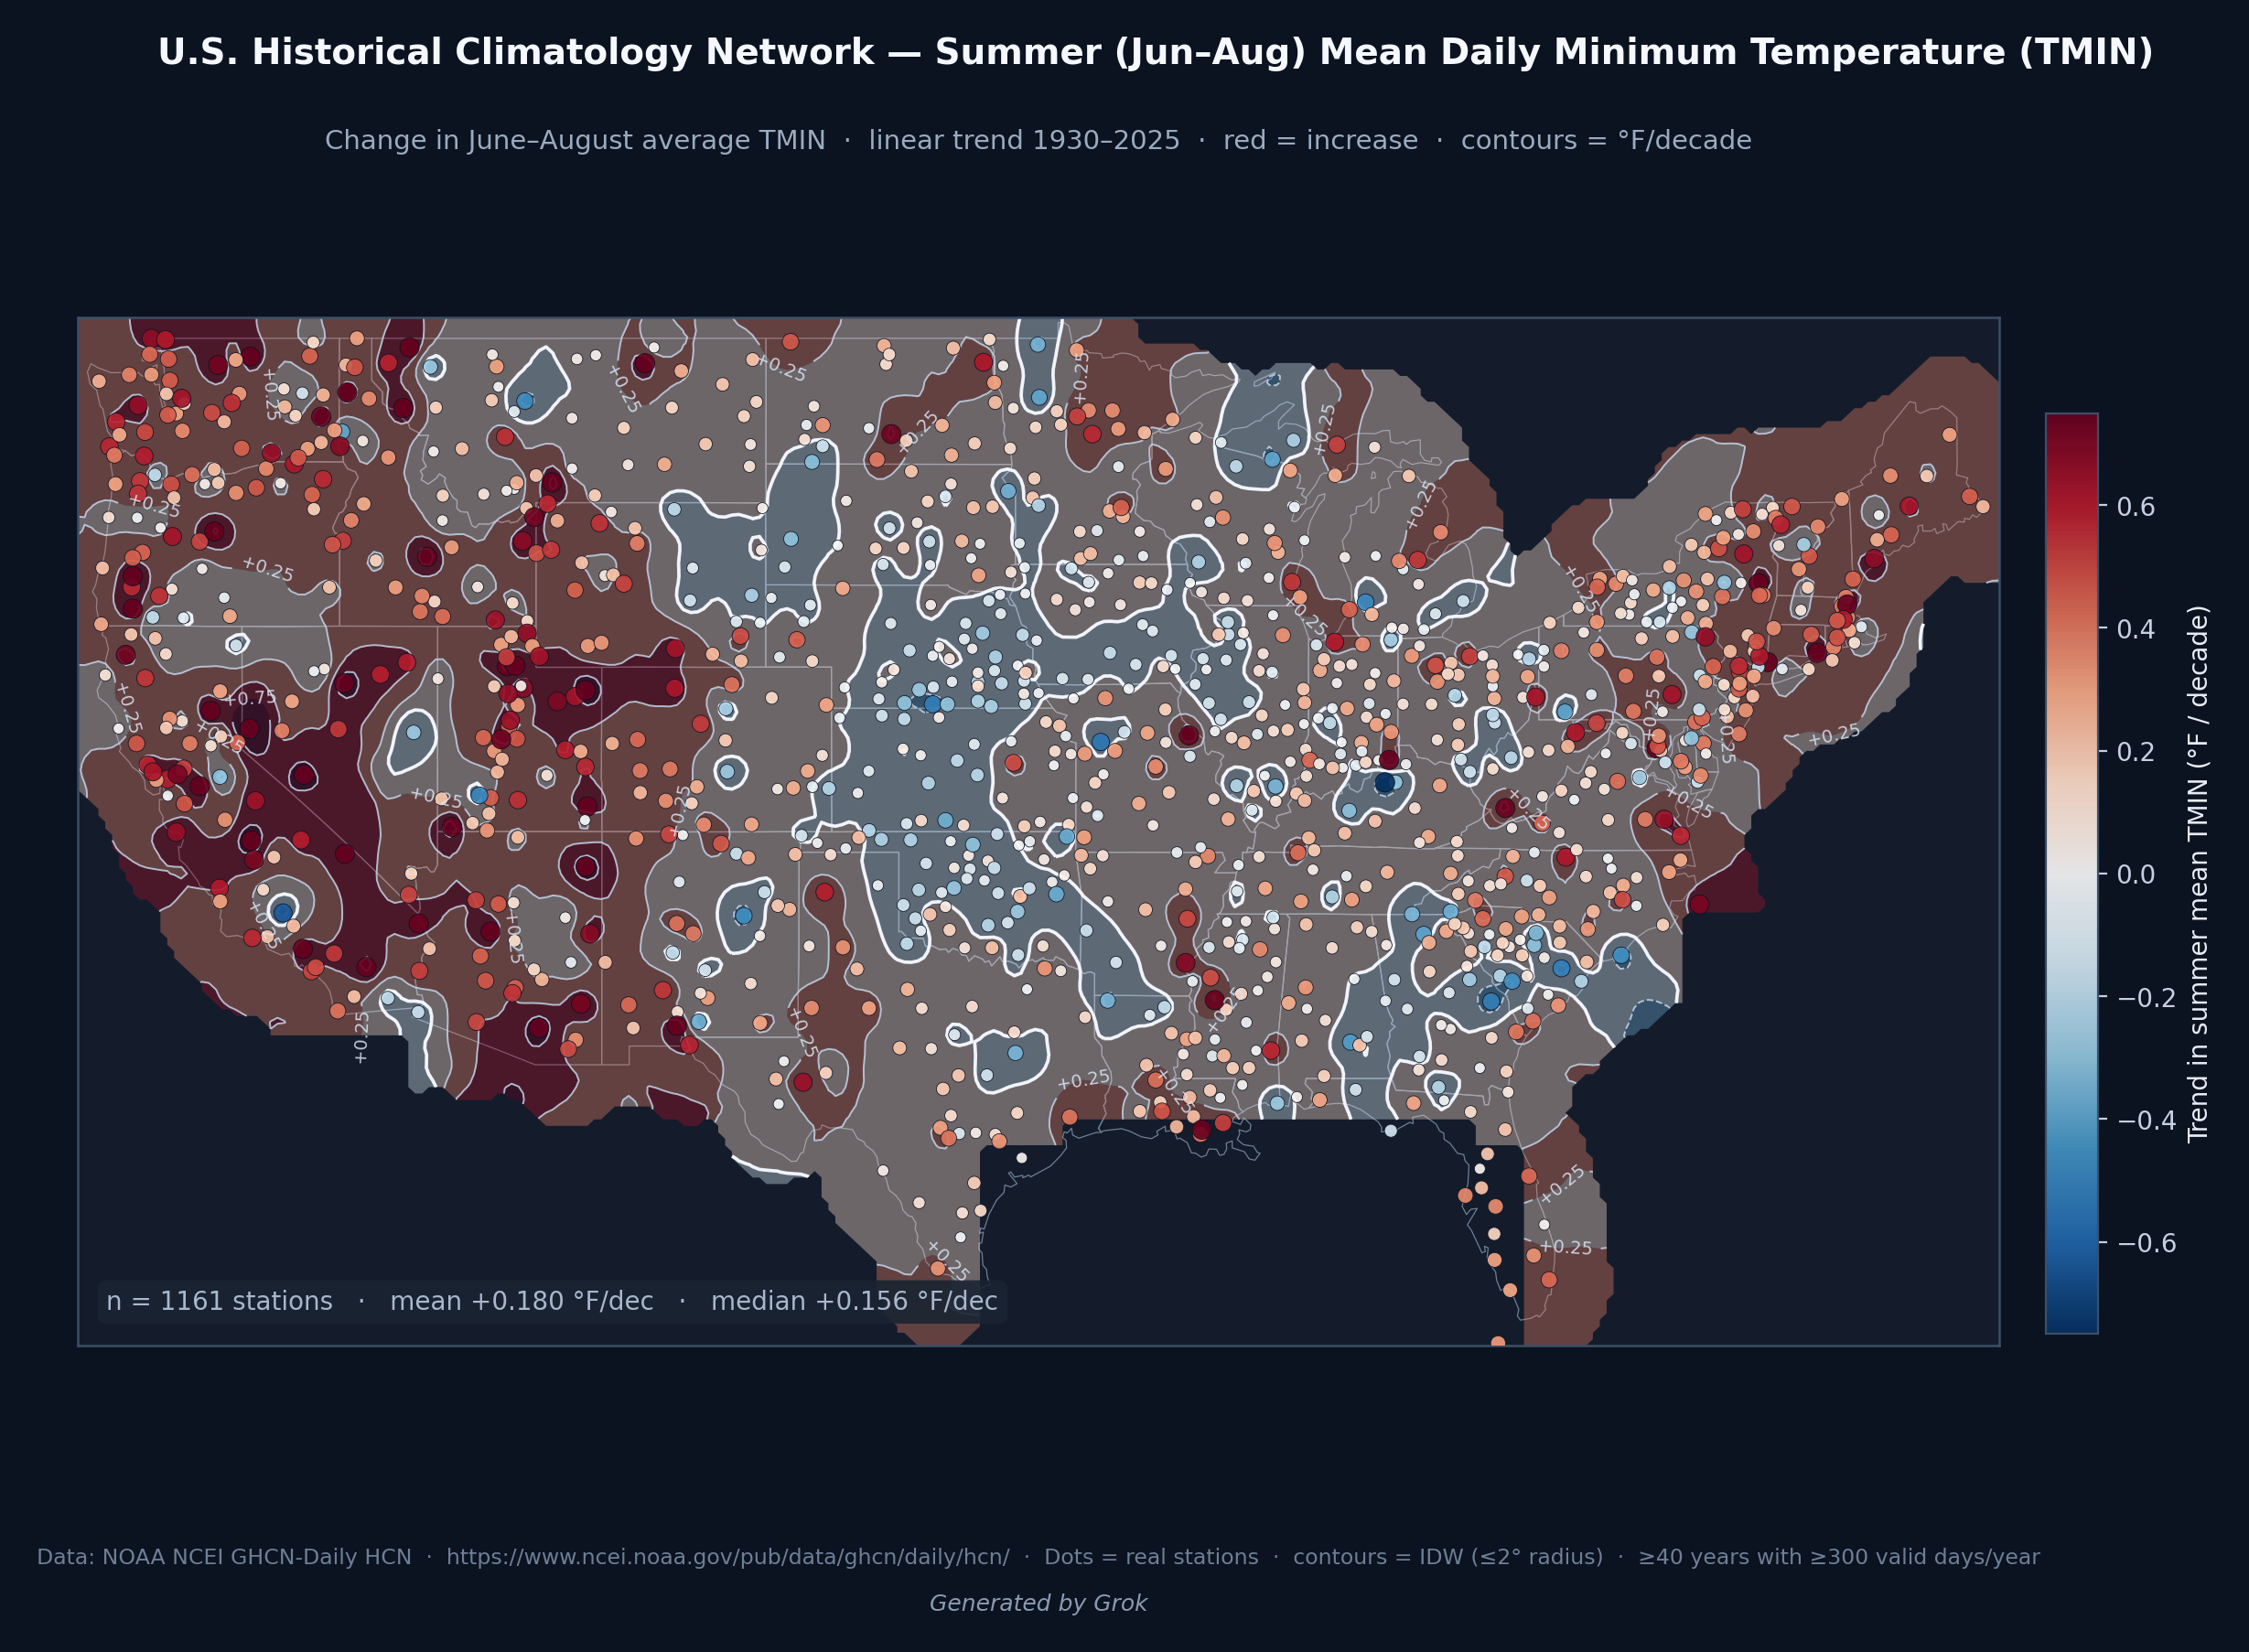
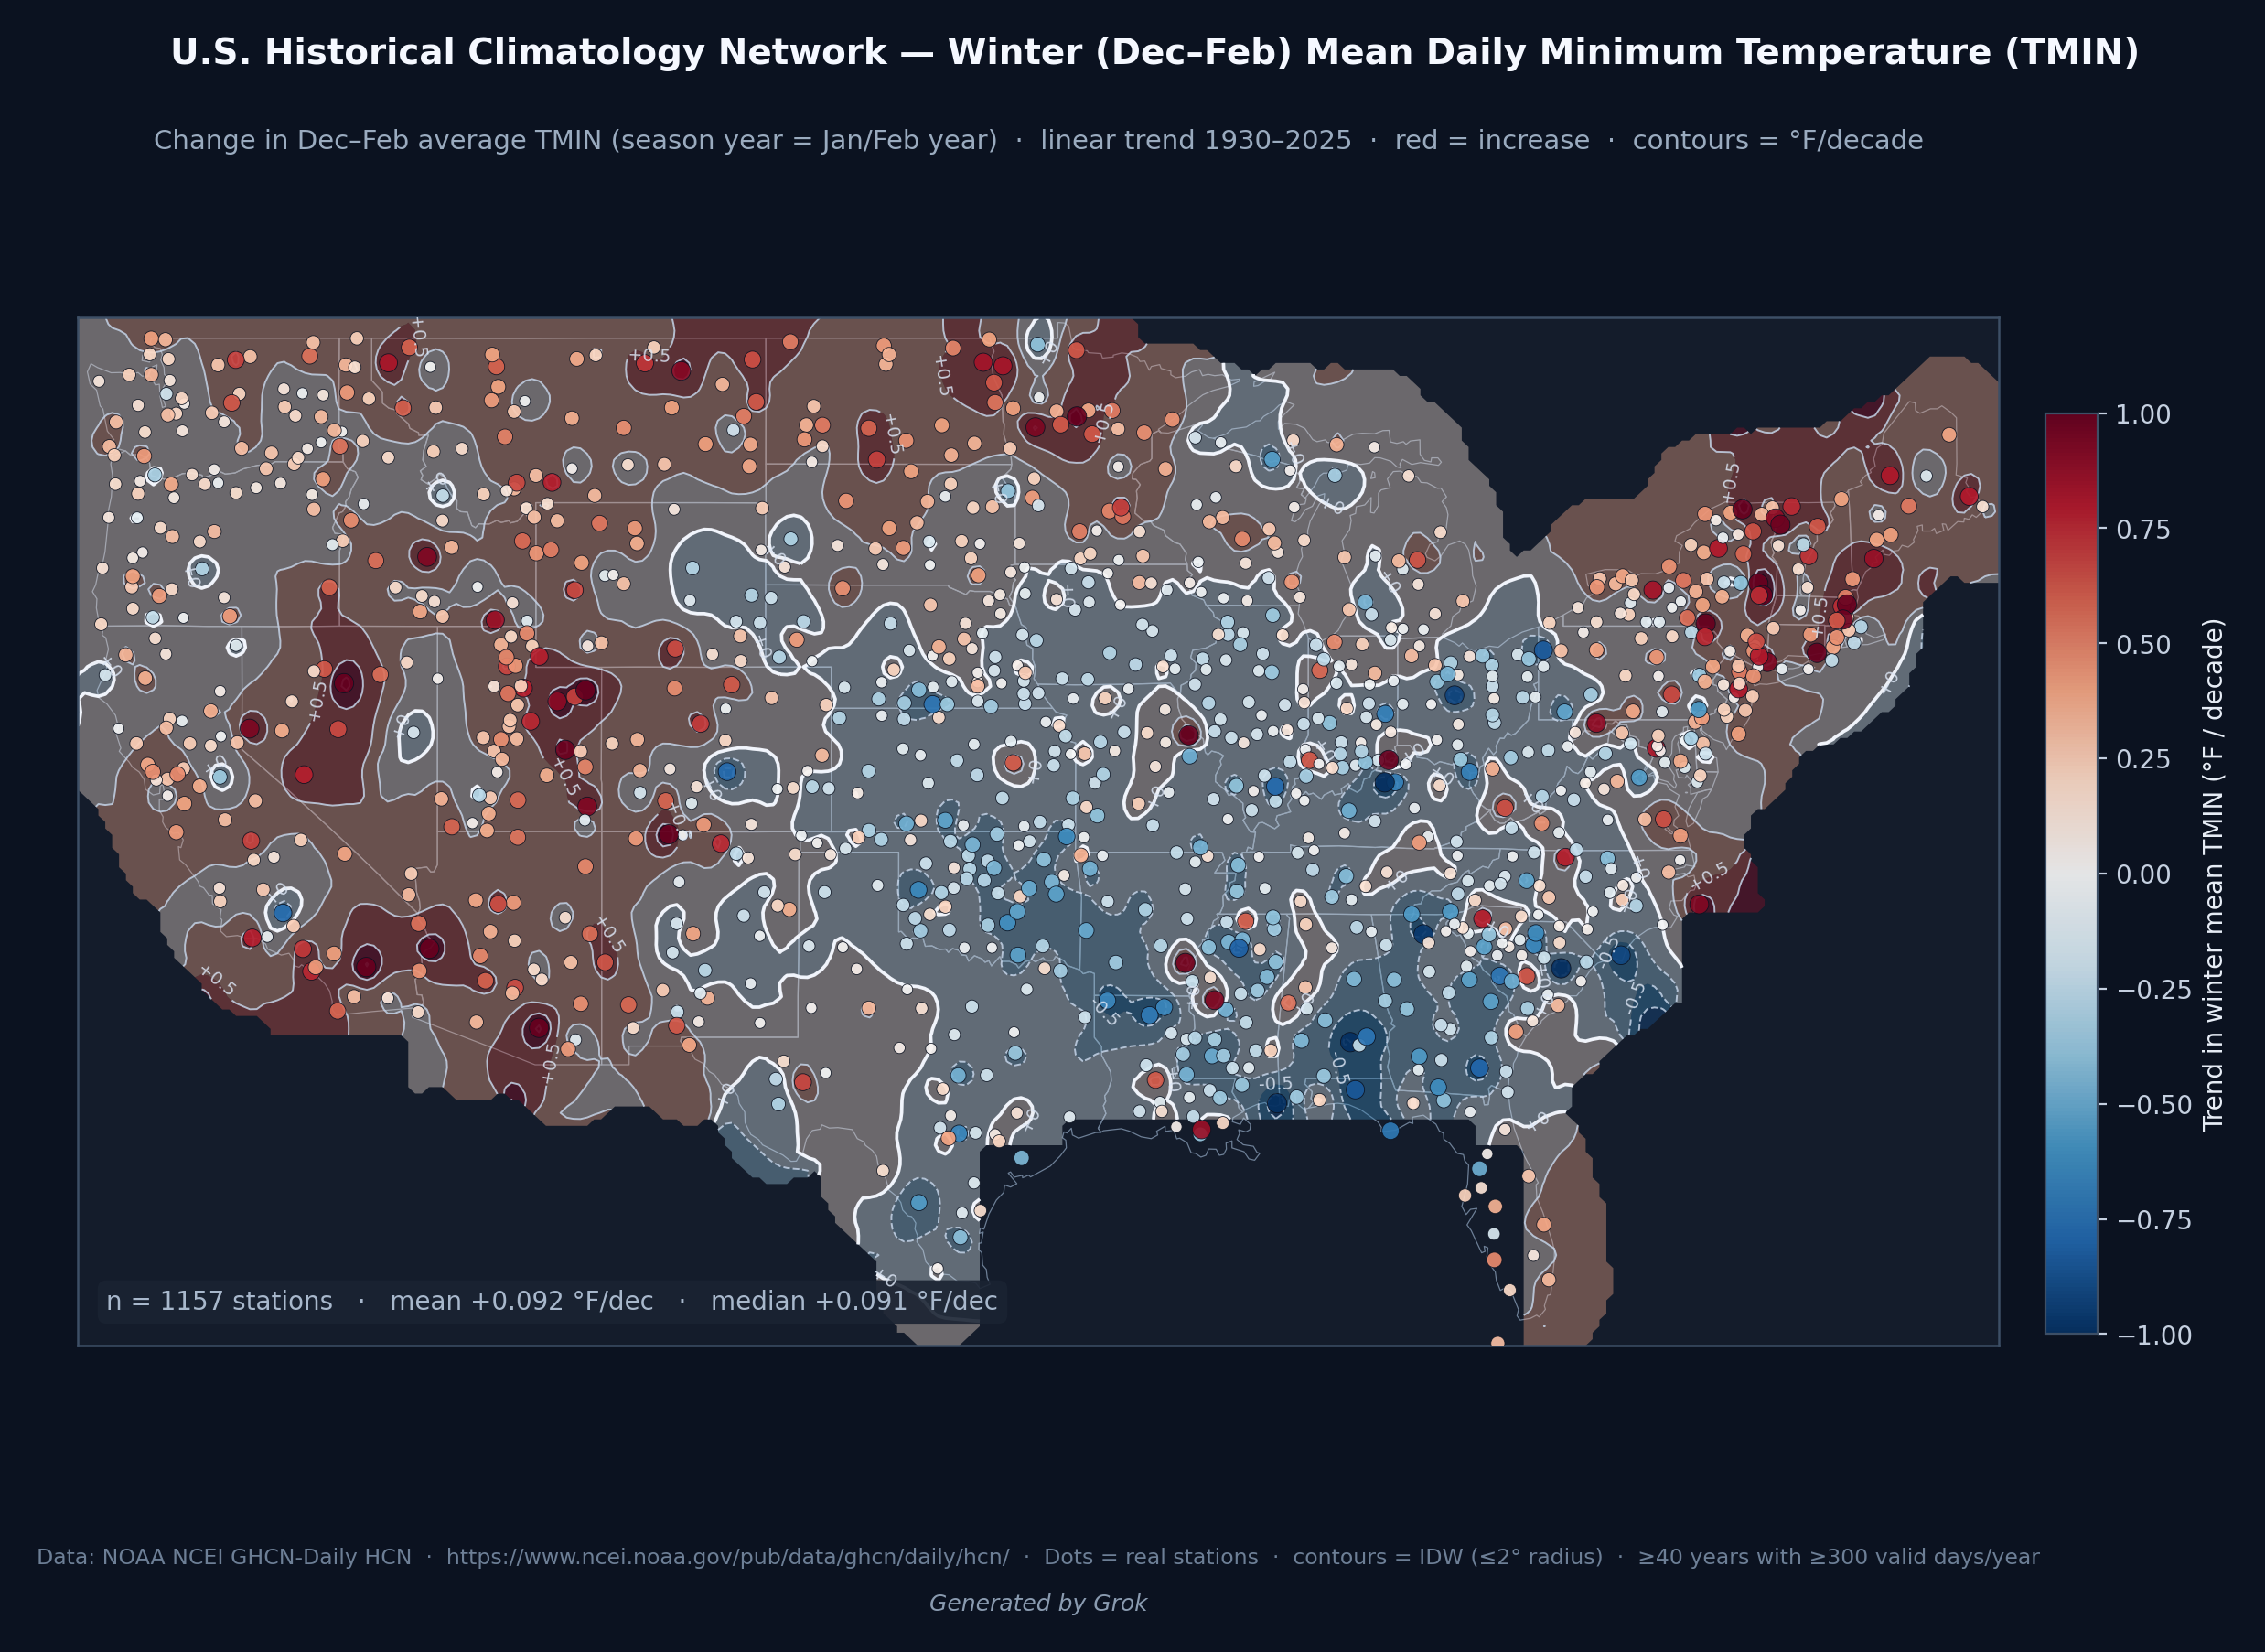
Winter daily minimum temperature
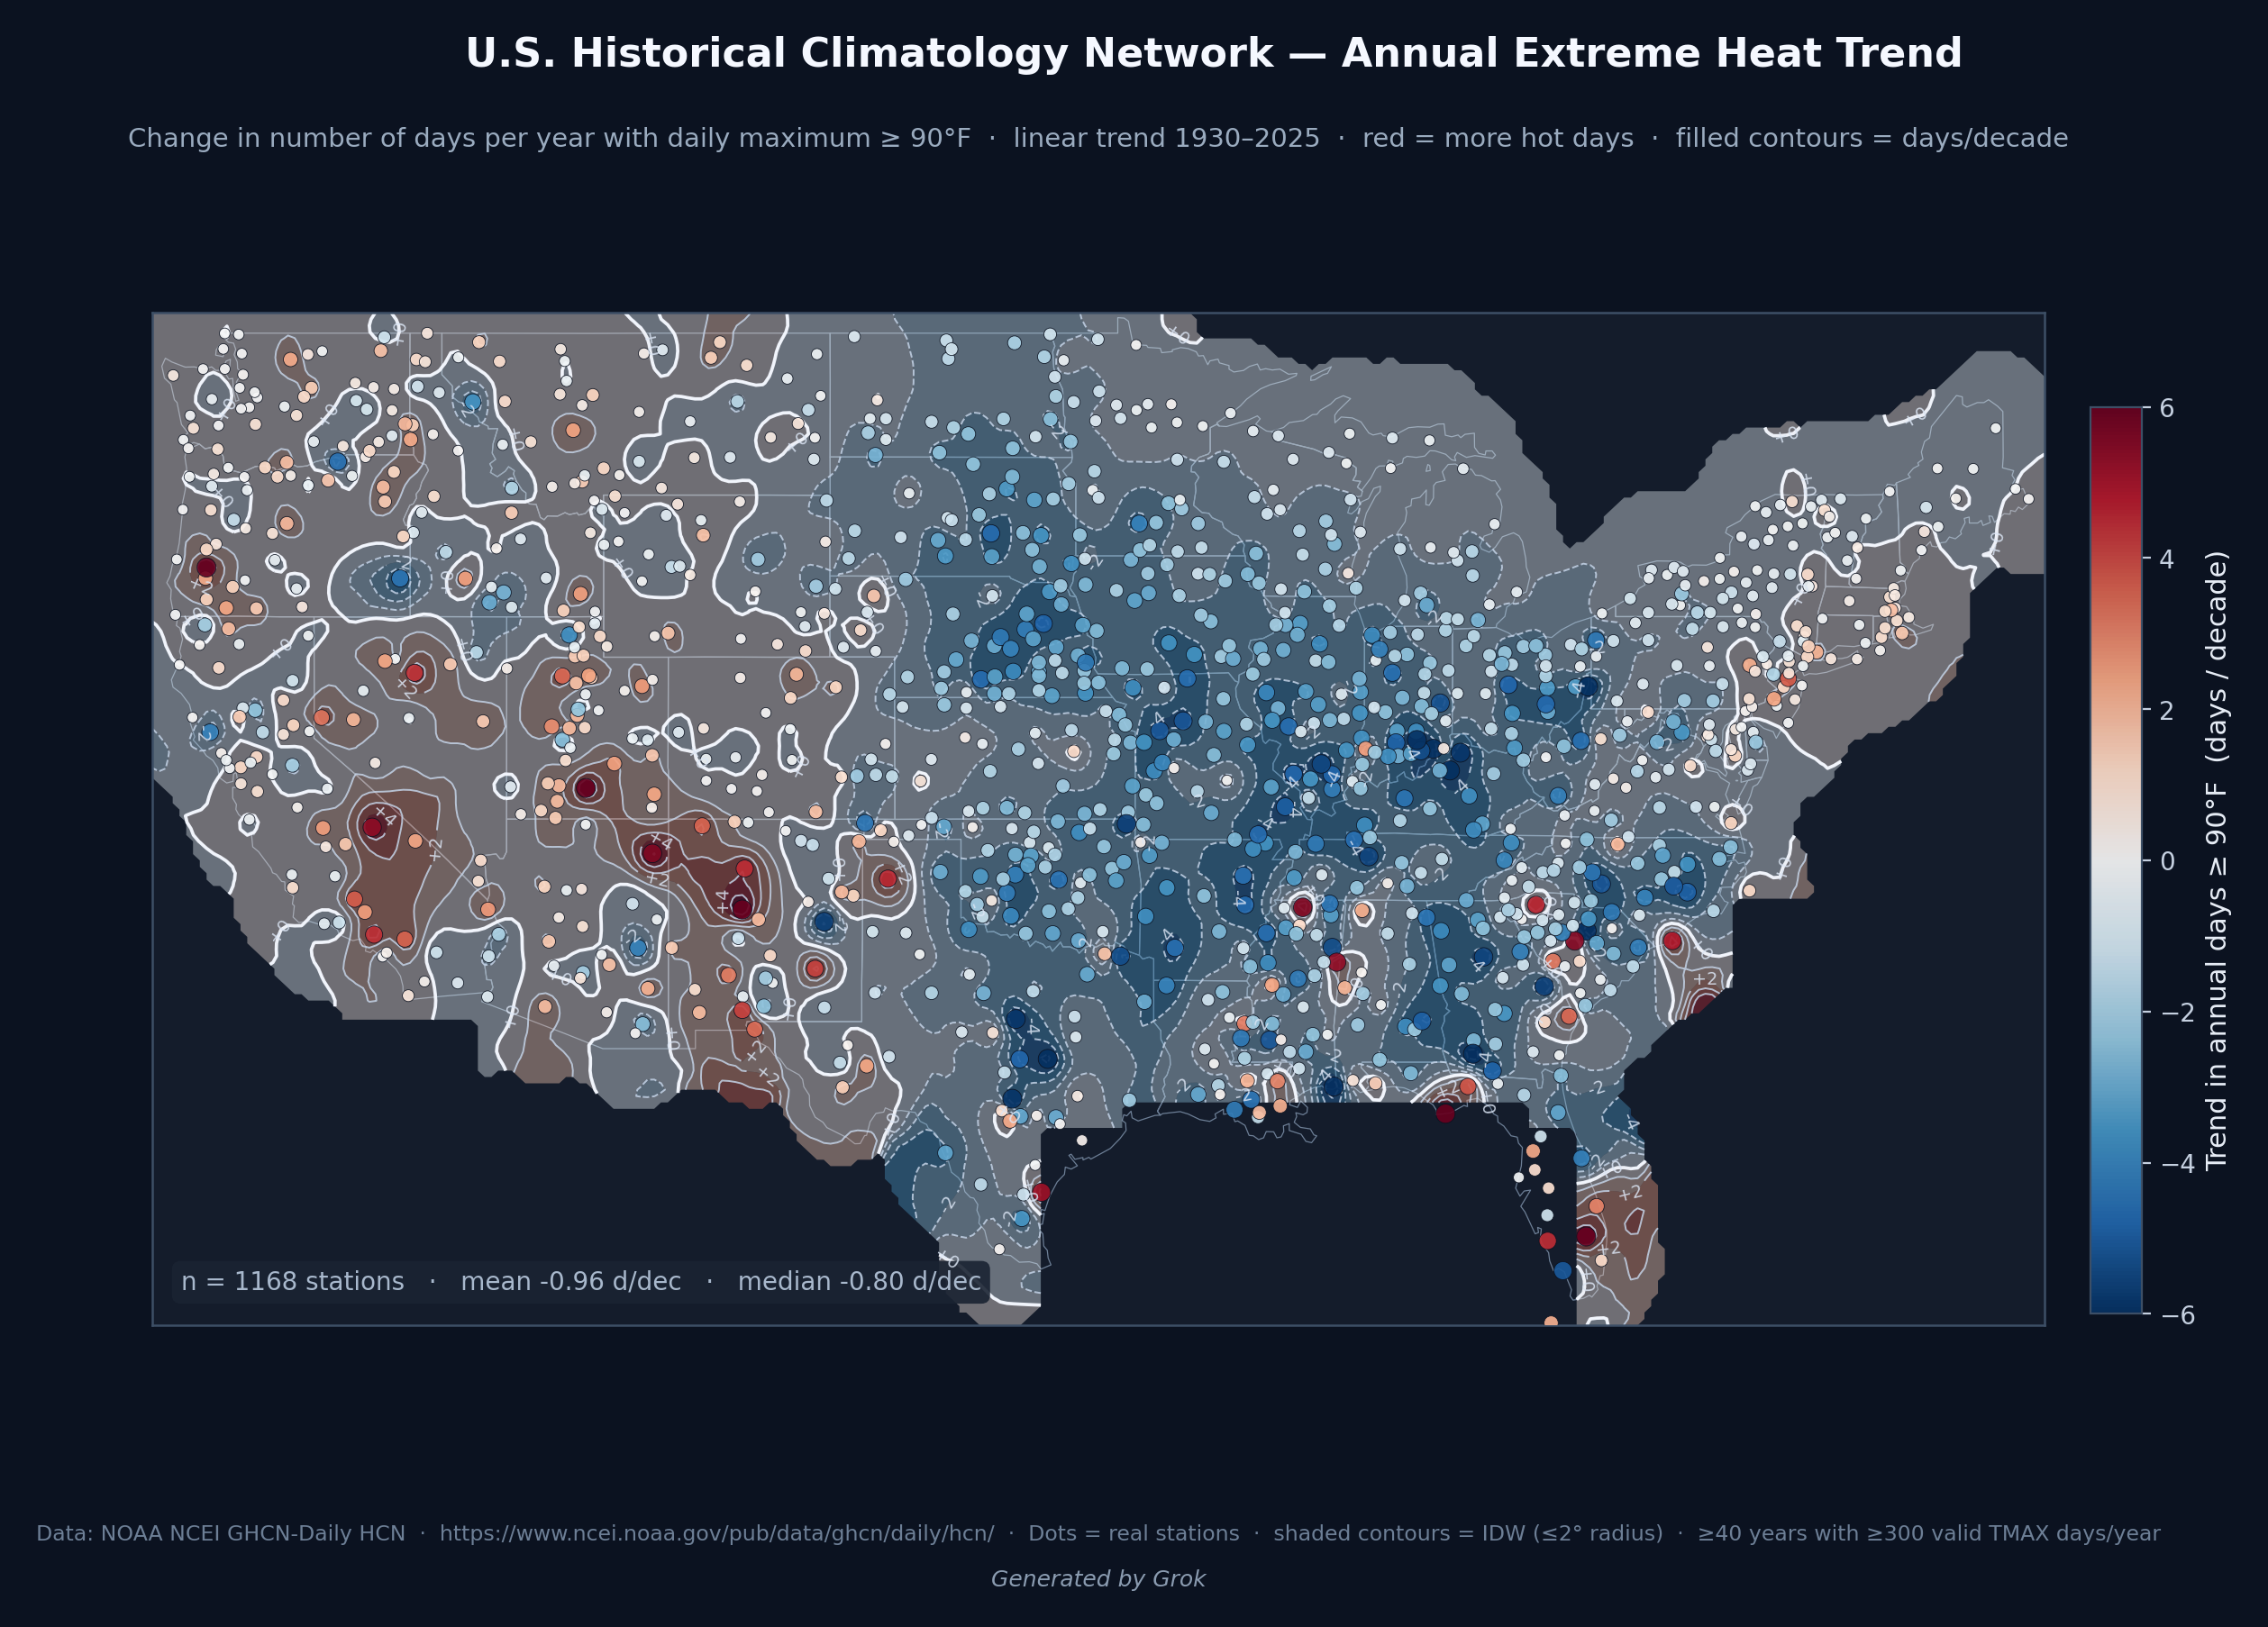
Number of 90F days.
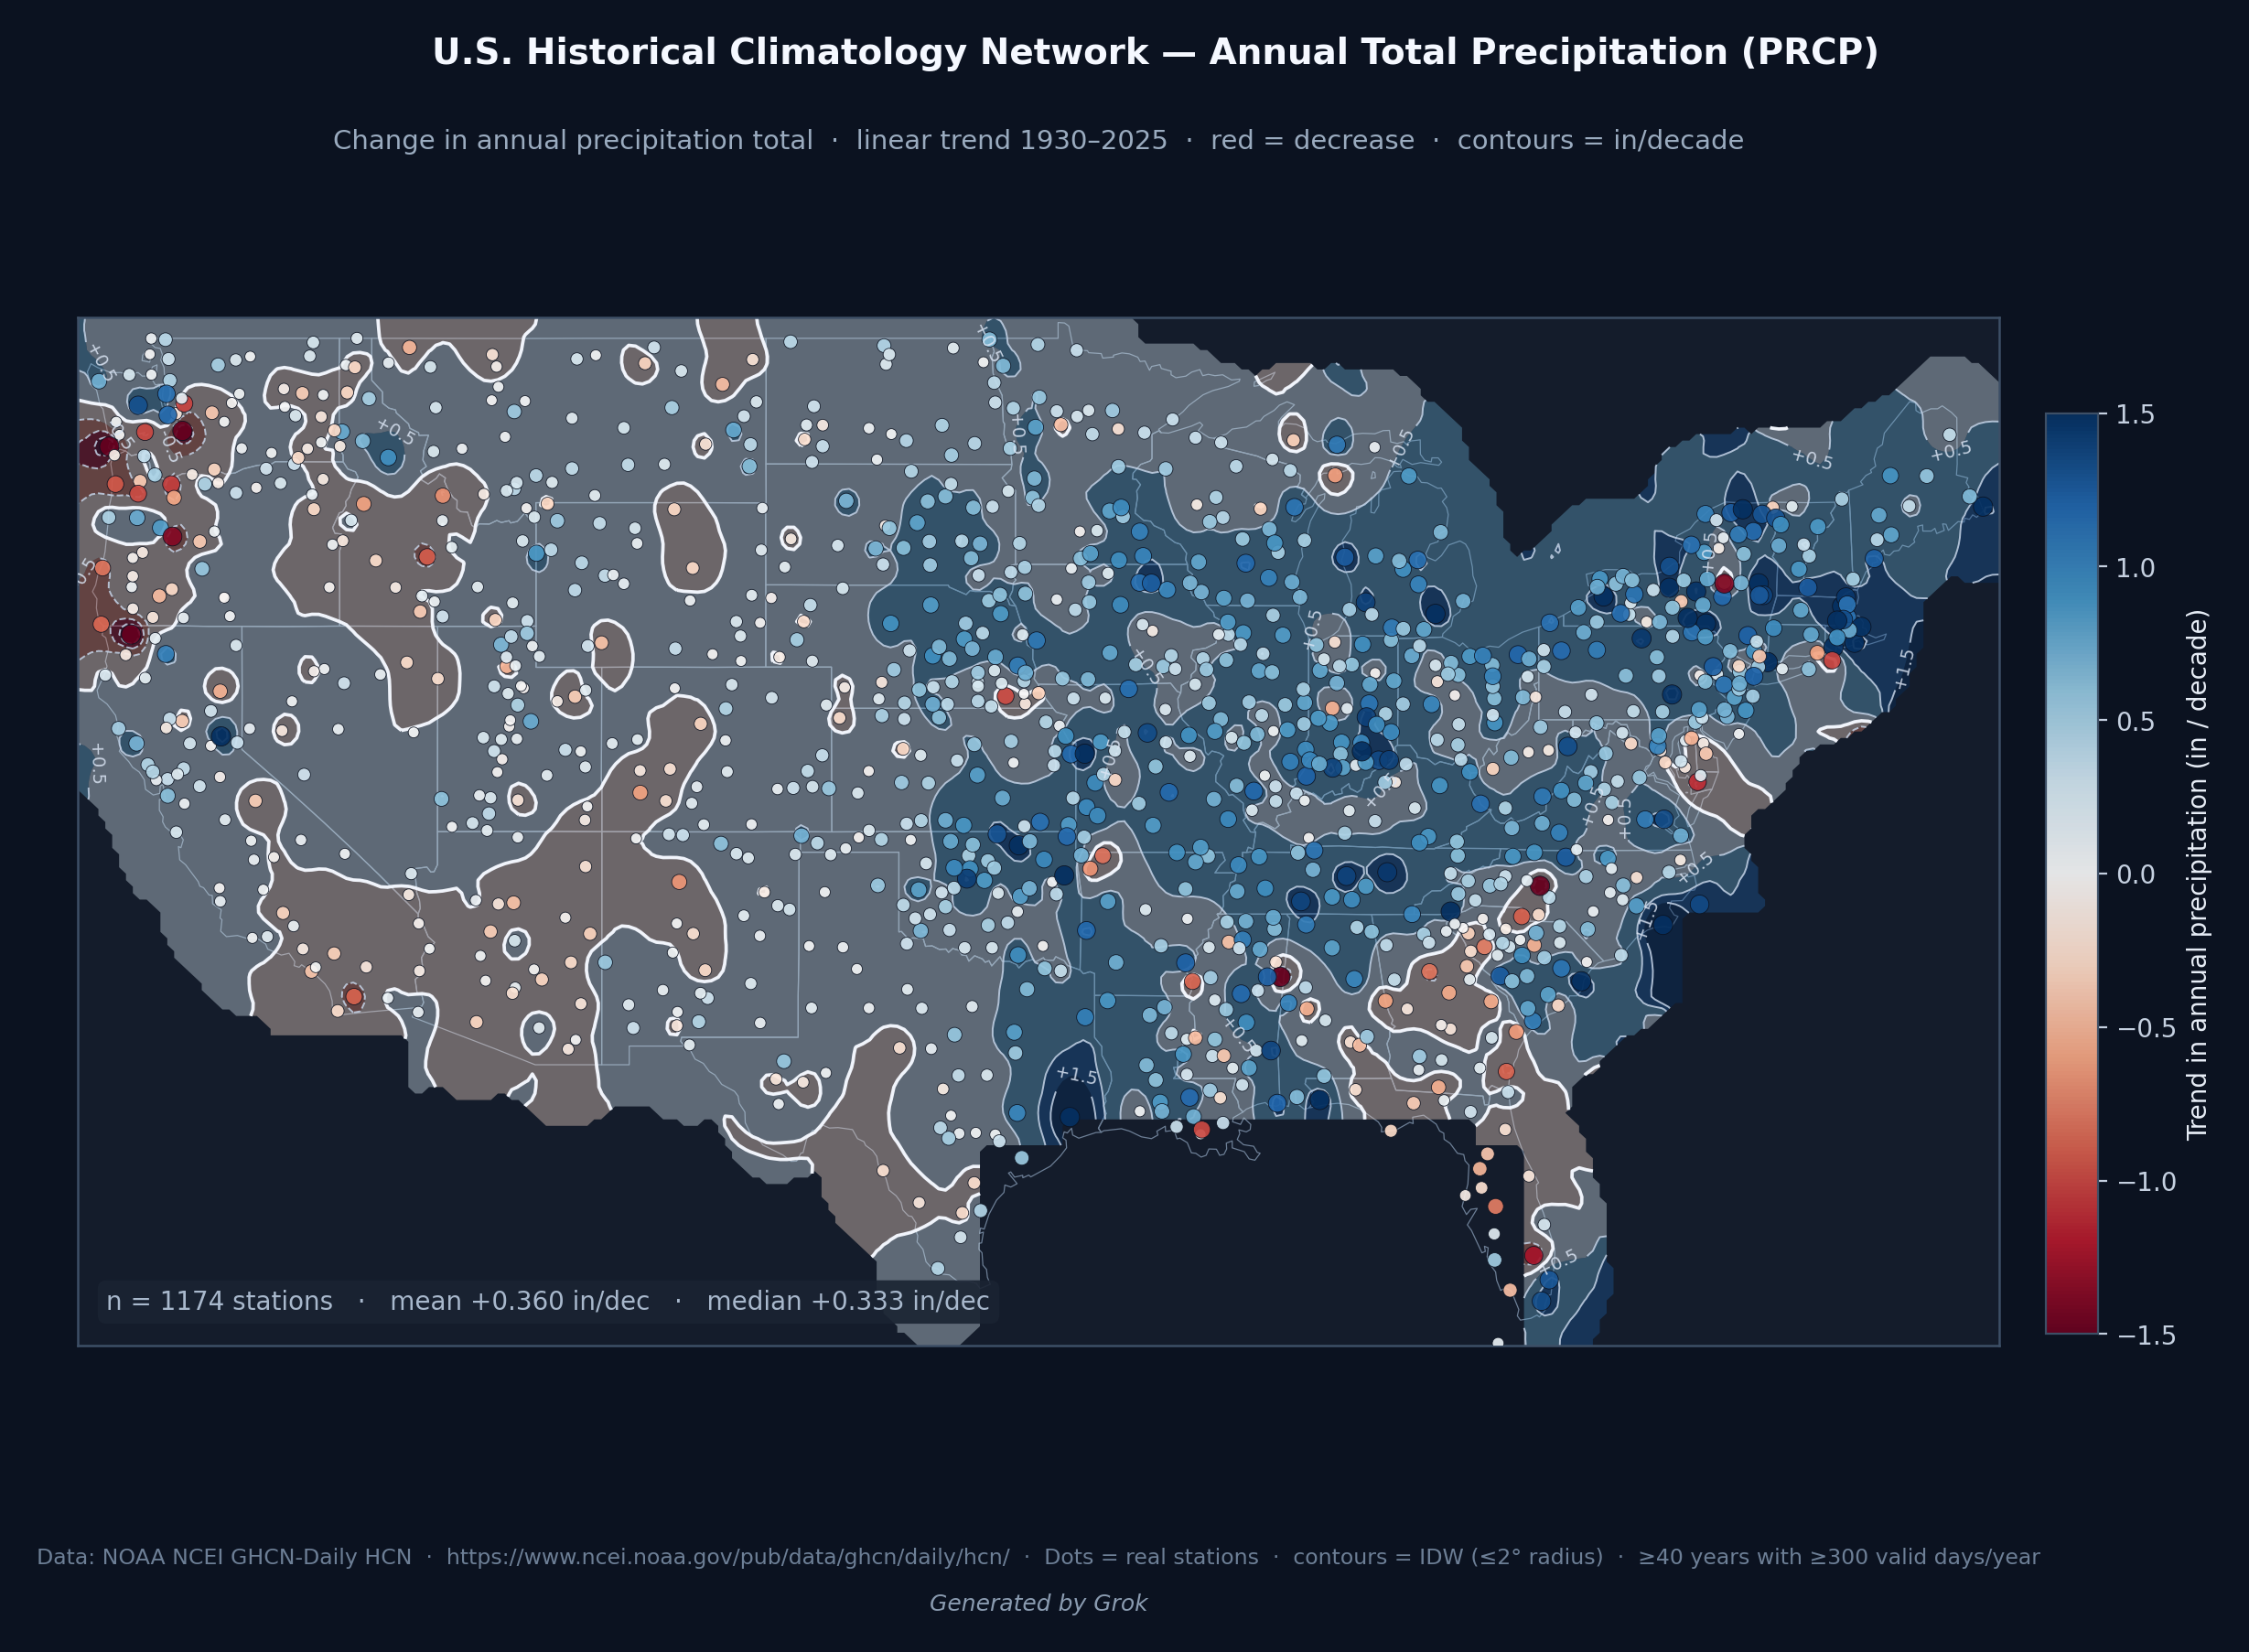
Precipitation
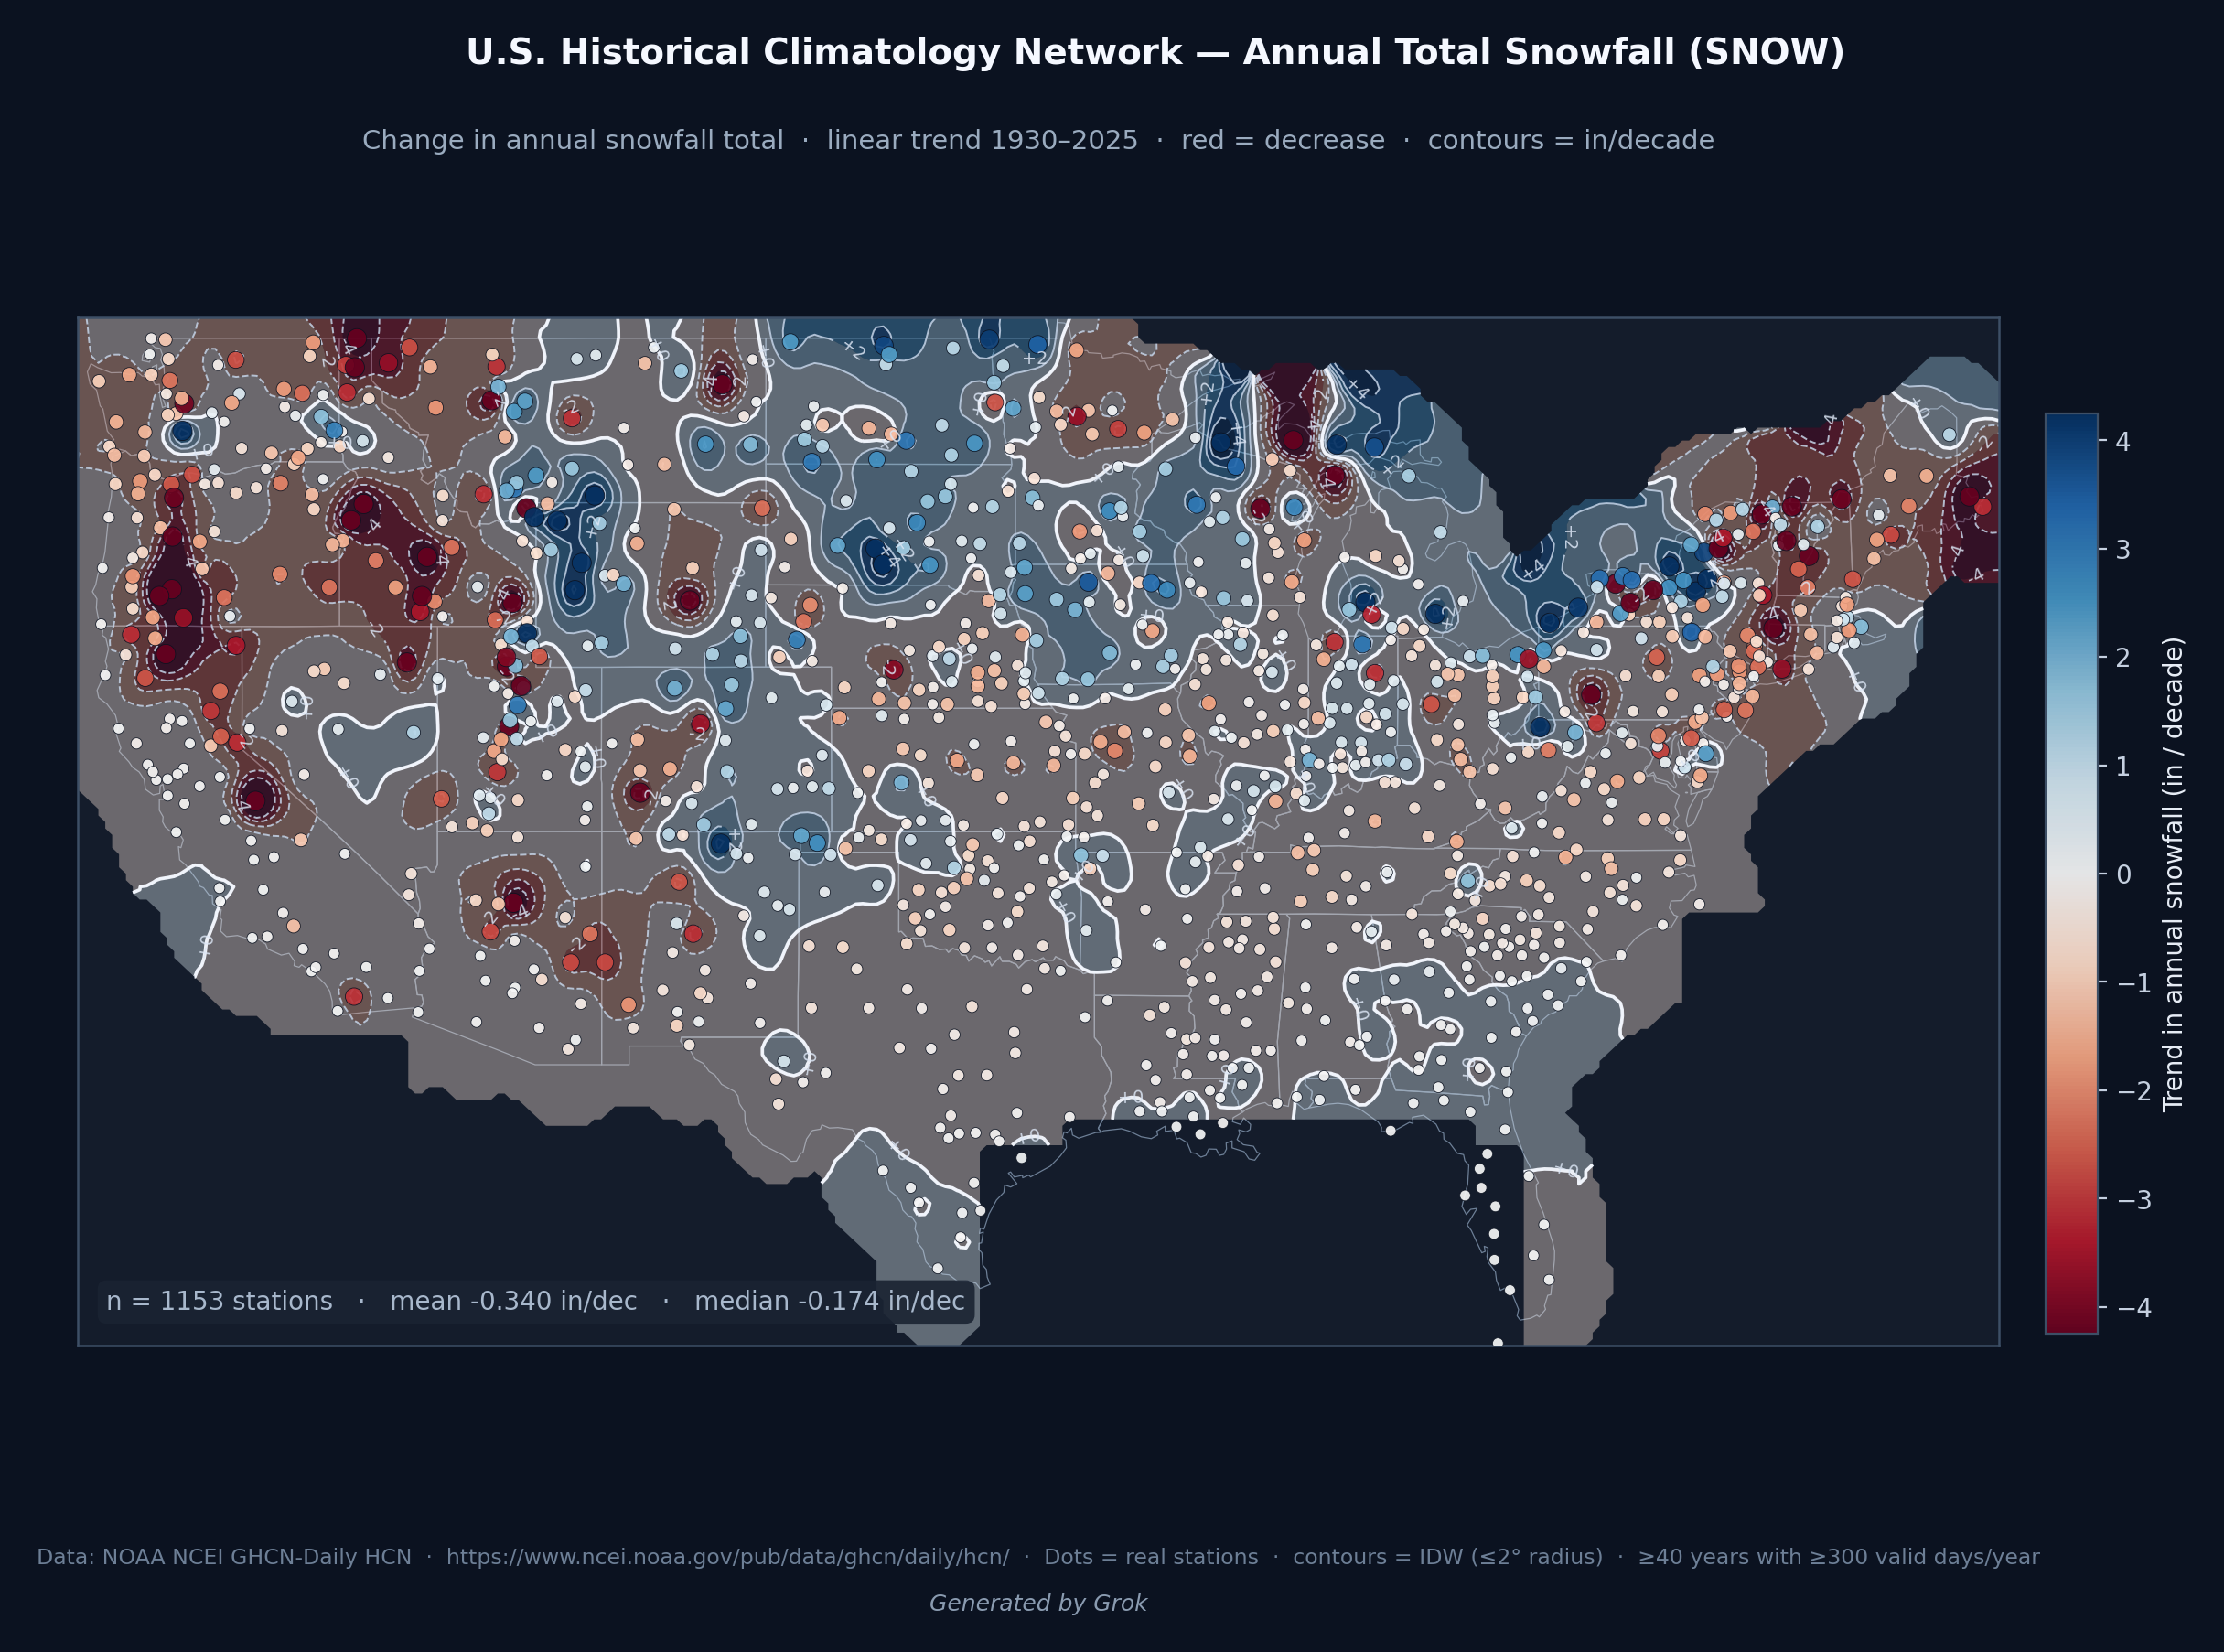
Snow


Lower high temps, and higher low temps implies that the air is more humid.
This matches what we are seeing in Ohio with the spread of rhizosphaera needlecast fungus killing off the Colorado blue spruce trees that used to do fine.