
Disrupting the Borg is expensive and time consuming!

Google Search
-
Recent Posts
- One Atomic Bomb Per Hour
- New Video : Analyzing Oil And Gas
- Is Antarctica Melting?
- High Speed Analysis And Visualization
- El Nino To The Rescue?
- Fake News Update
- Growth Of Antarctic Sea Ice
- 65 Years Of Progress!
- El Nino To The Rescue?
- Worst March Drought On Record
- ChartGL Process Control Demo
- The Biggest Money Laundering Scam
- Drought In The Headwaters Of Lake Powell
- Unrealistic Expectations Of Water Availability
- Did Bill Gates Do This?
- Worst March Drought On Record In The US
- The Real Hockey Stick Graph
- Analyzing The Western Water Crisis
- Gaslighting 1924
- “Why Do You Resist?”
- Climate Attribution Model
- Fact Checking NASA
- Fact Checking Grok
- Fact Checking The New York Times
- New Visitech Features
Recent Comments
- Bob G on One Atomic Bomb Per Hour
- Mike Peinsipp on One Atomic Bomb Per Hour
- Mike Peinsipp on One Atomic Bomb Per Hour
- Bob G on One Atomic Bomb Per Hour
- John Francis on One Atomic Bomb Per Hour
- John Francis on One Atomic Bomb Per Hour
- arn on One Atomic Bomb Per Hour
- John Francis on One Atomic Bomb Per Hour
- John Francis on One Atomic Bomb Per Hour
- Bob G on One Atomic Bomb Per Hour
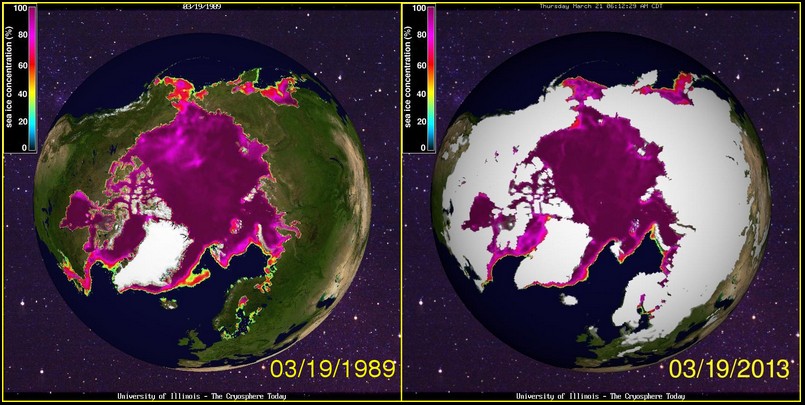
There’s a lot more snow now!
Actually, even more since that shot was taken 4 days ago. The UK is now white, for starters.
Note that “Historic snow cover data not displayed on these images….” There was snow but not displayed for 1989.
Steve,
it doesn’t look identical to me. What does the NSDIC say?
You are an idiot.
The AGW alarmists don’t have much to hang their hat on these days. The global mean temperature hasn’t risen in 16 years, regions of the northern hemisphere are experiencing record snow and cold (again), sea levels are barely increasing and their latest much-publicized hockey stick turns out to be the product of data manipulation (what’s new?).
So it’s back to talking about arctic sea ice extent, which increased dramatically during this season’s freeze after an enormous arctic storm last summer blew the ice to pieces, triggering a fast melt. Meanwhile, the warmists ignore the record sea ice extent in Antarctica because it doesn’t confirm the “sea ice is melting” scare.
Steve,
As you didn’t see fit to answer my question, I had to look it up on the NSIDC wesite. It turns out there is a huge difference in ice extent from 1989 and 2013 with far less extent occurring in 2013. http://nsidc.org/cryosphere/sotc/sea_ice.html
Along the way, I also found this post of yours from last year which basically made the same claim for May of 2012. And that too, was way off.
Where do you get your information?
DOH Homer : Ice area was almost identical on this date in 1989
http://arctic.atmos.uiuc.edu/cryosphere/timeseries.anom.1979-2008
Steve,
Those long lines of numbers from the Illinois Cryosphere Today website gave me a headache. Too many numbers to make sense of and too many opportunities to cherry pick. So I followed their link to a chart based on the column 2 data: http://arctic.atmos.uiuc.edu/cryosphere/IMAGES/seaice.anomaly.arctic.png
You know what they say: “A picture is worth a thousand words”. In this case it was worth 10,000 numbers. In any case, the linked graph certainly doesn’t back up your implication that the March ice cover for March 2013 or for May 2012 is in anyway similar to the ice cover in 1989.
1989 13.68 2013 13.58
Steve,
You must have spent hours combing through those 10,000 numbers to find something that you could say “aha” to, but it still doesn’t tell the complete story. As I have stated many times, winter ice extent is meaningless in comparison to summer ice. Today’s ice could be 10mm thick and only covering a small part of the ocean with a lot of open water surrounding it — it would still be considered sea ice extent.
Here is a much-more relevant graph showing ice thickness for years going back to 1980. Please note where 2013 is on the graph: http://psc.apl.washington.edu/wordpress/wp-content/uploads/schweiger/ice_volume/Bpiomas_plot_daily_heff.2sst.png
I have a 1969 Buick GS400 convertible that loves to melt rubber. And ice according you the village idiot formerly known as Laz.