What is up with Canadians named Katharine and Catherine?
What is up with Canadians named Katharine and Catherine?
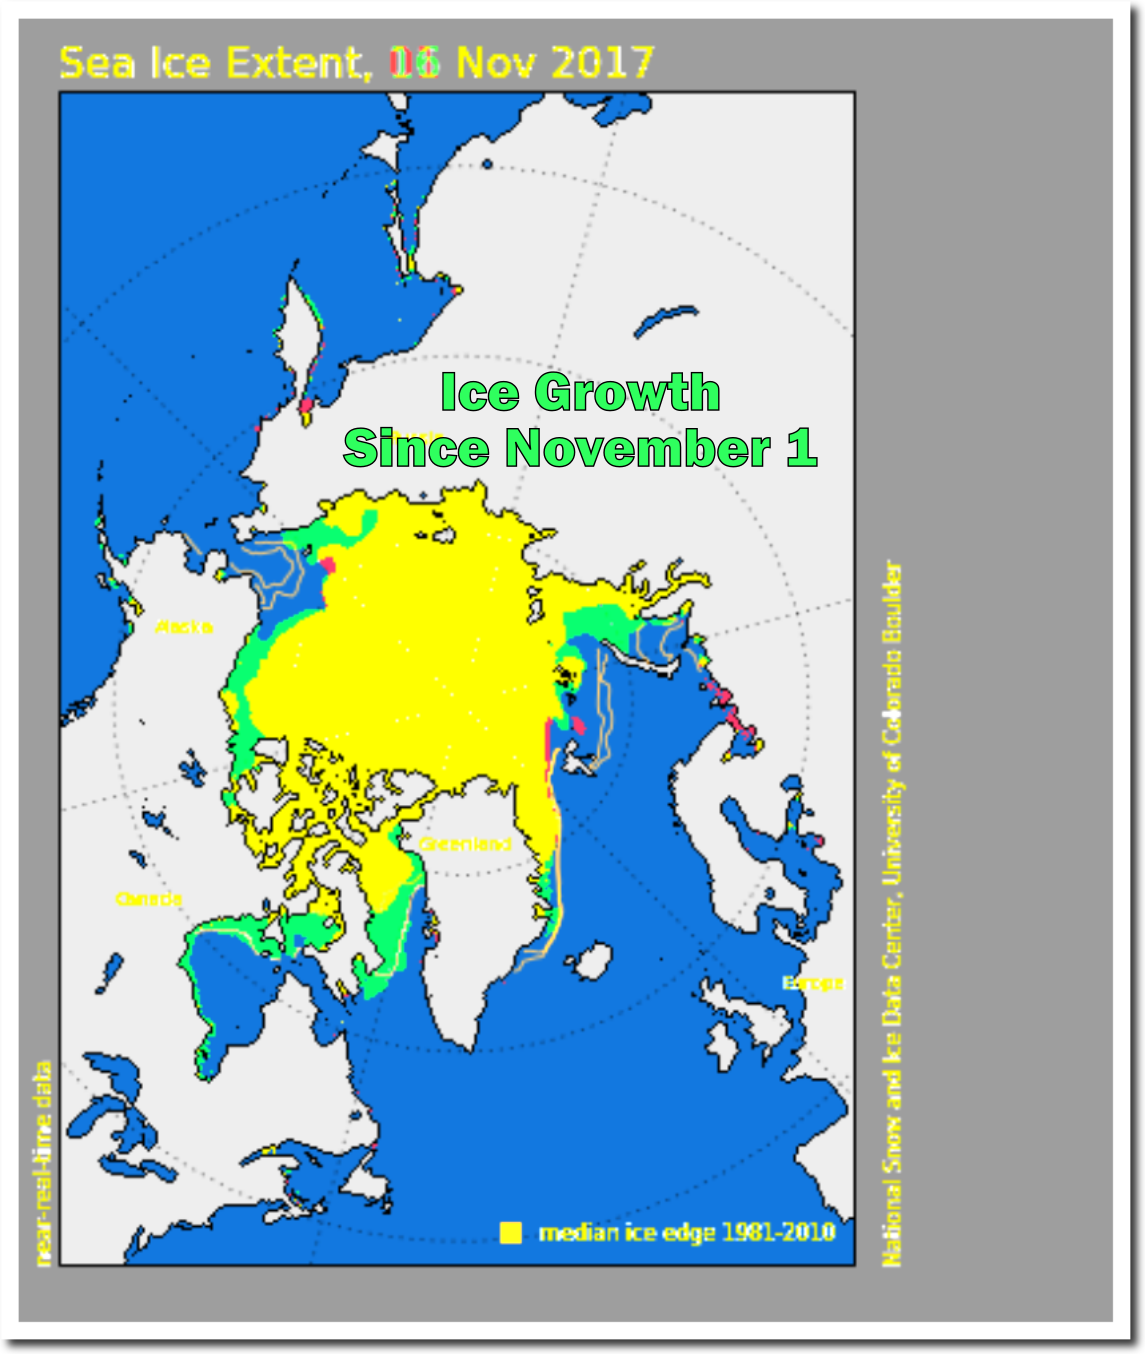
Arctic sea ice is expanding very rapidly this month, and is now above “normal” in the Hudson and Baffin Bays.
Greenland ice growth has also been well above normal. for the second year in a row.
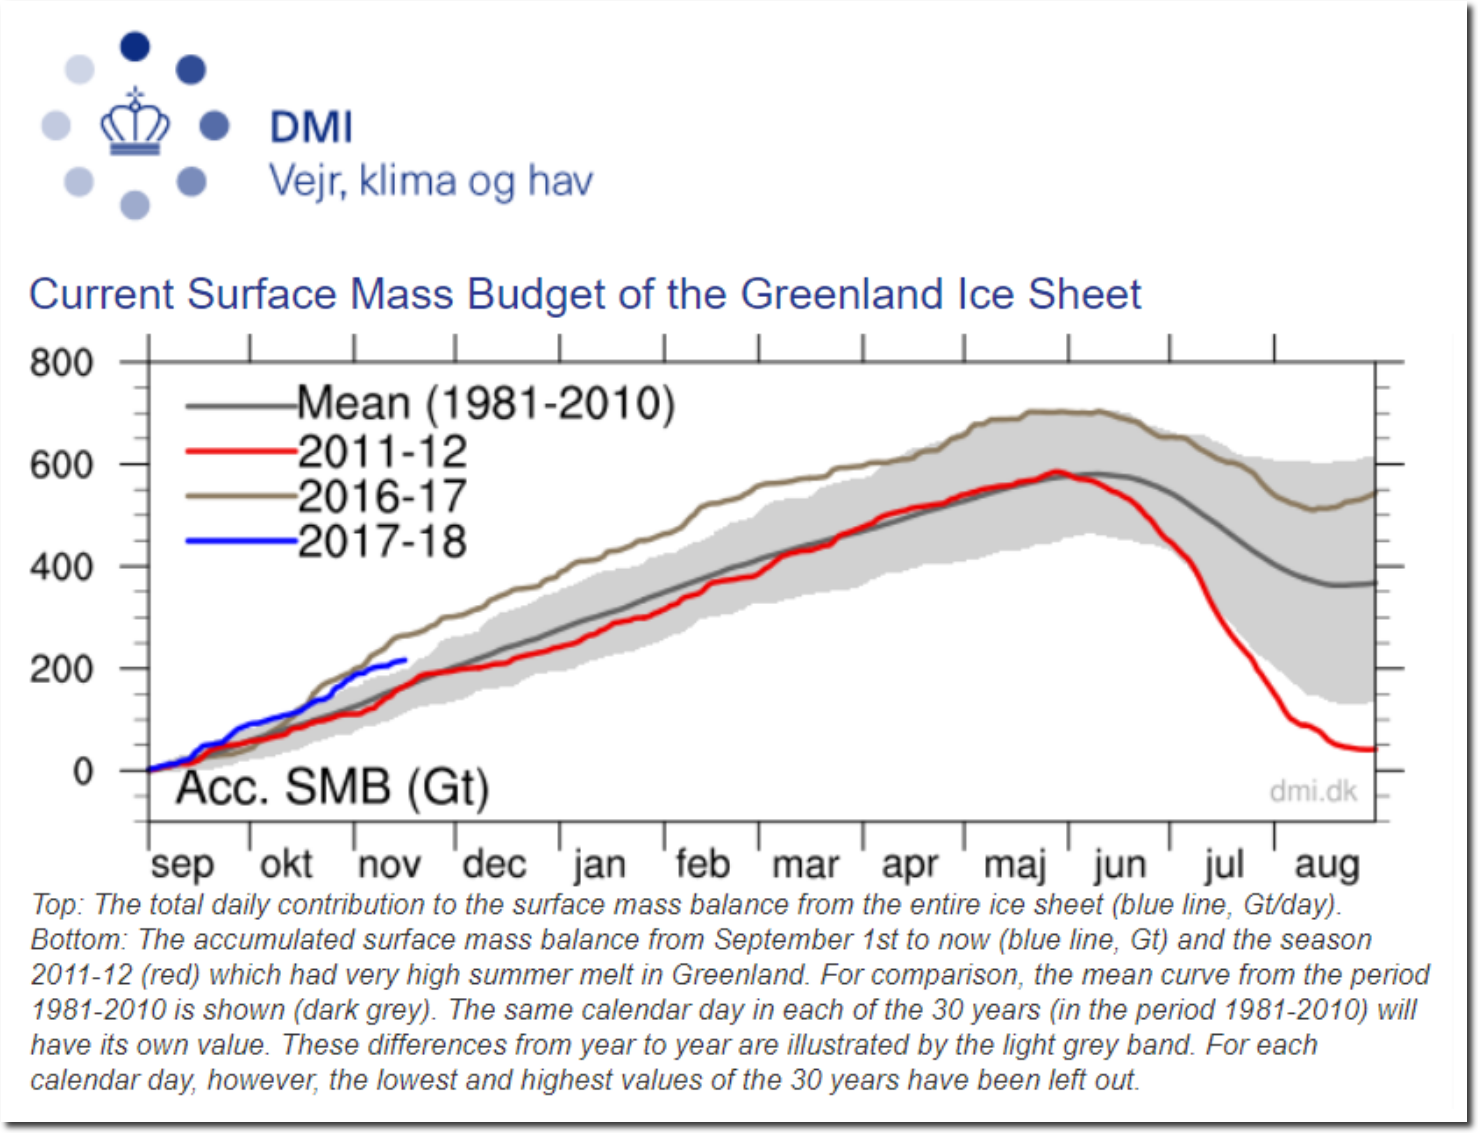
Greenland Ice Sheet Surface Mass Budget: DMI
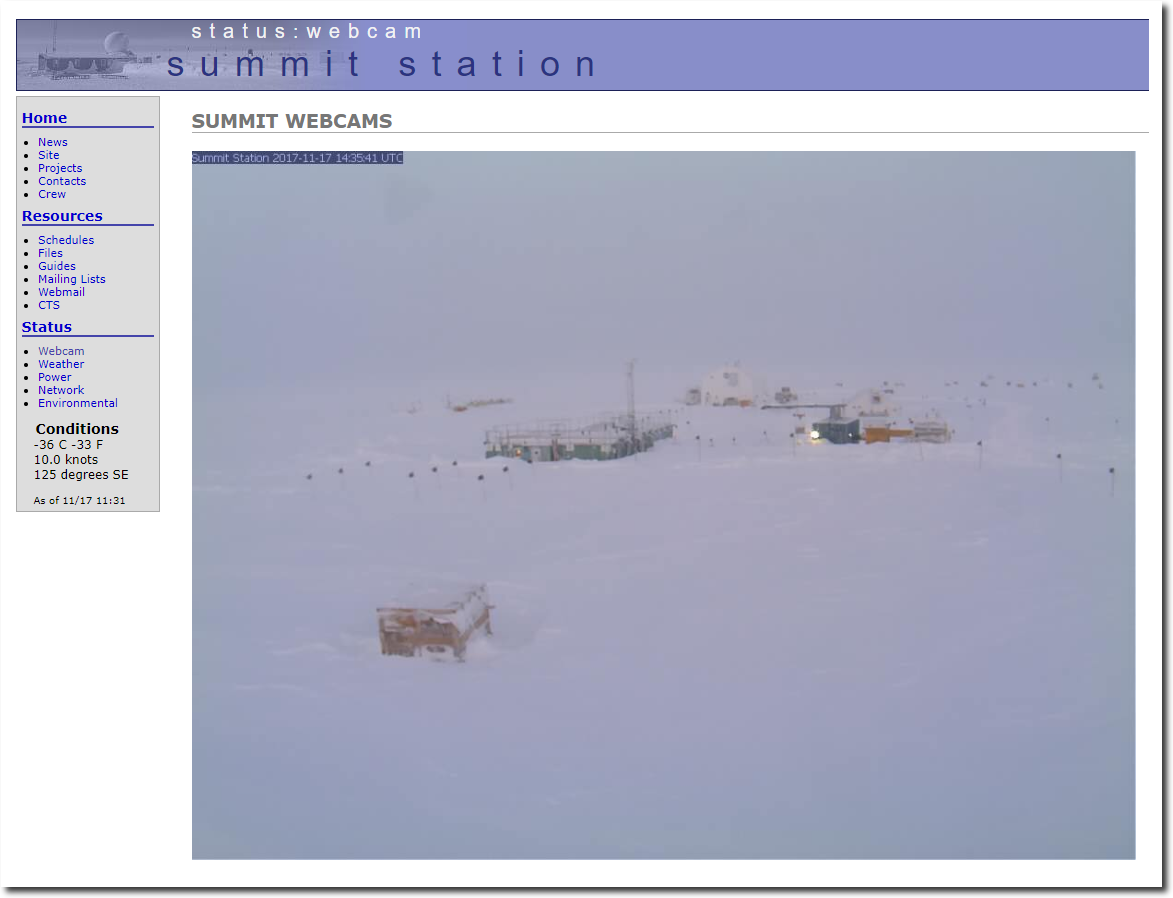
Temperatures are extremely cold on the Greenland Ice Sheet.
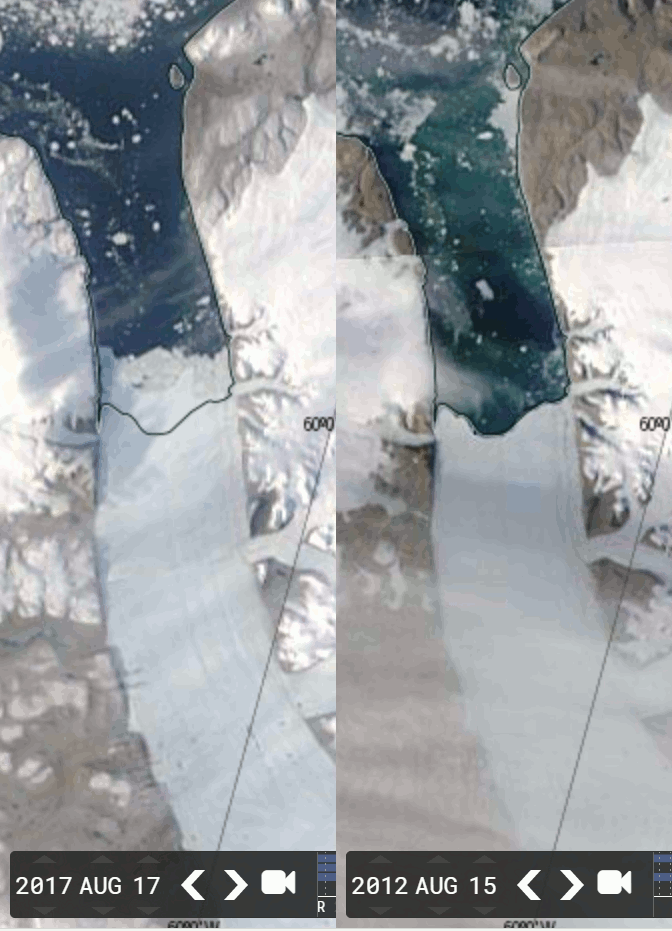
Greenland’s most famous glacier, the Petermann glacier, has grown more than one mile over the past five years.
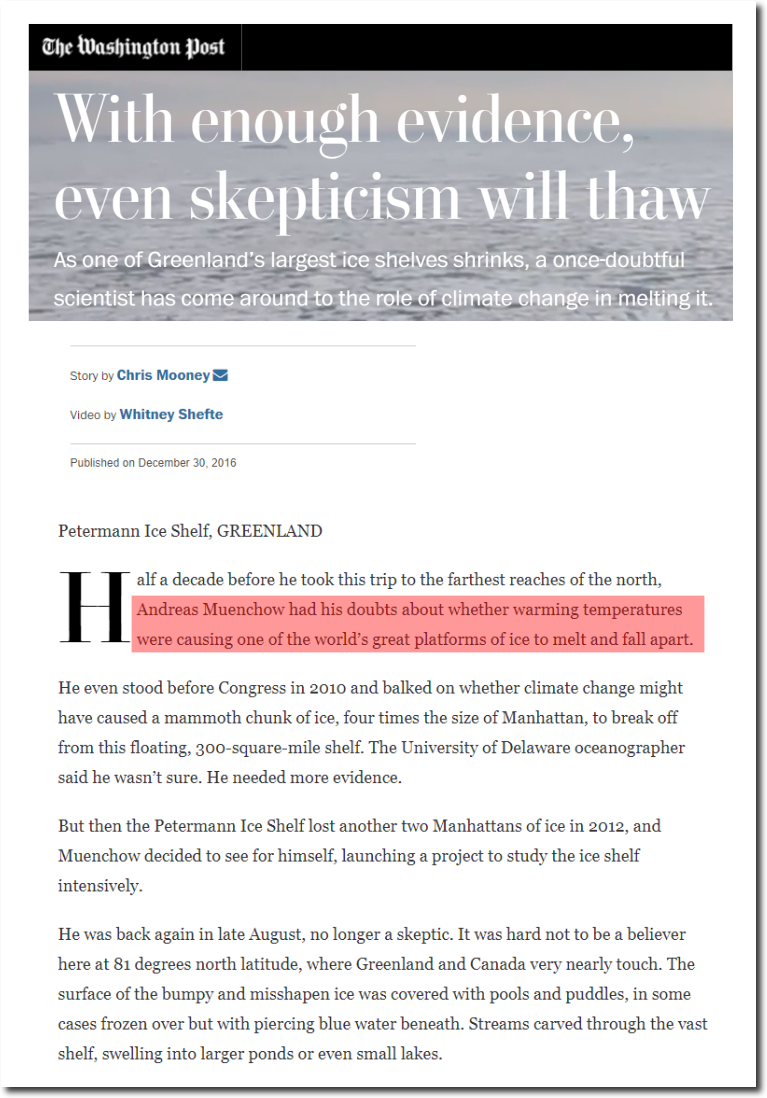
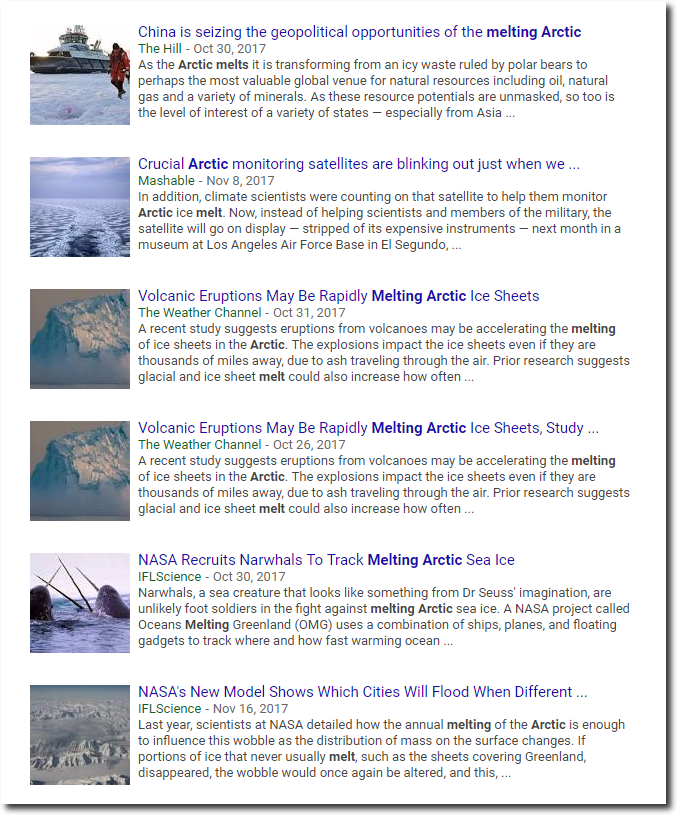
Meanwhile, criminals in the press corps and science community report the exact opposite.
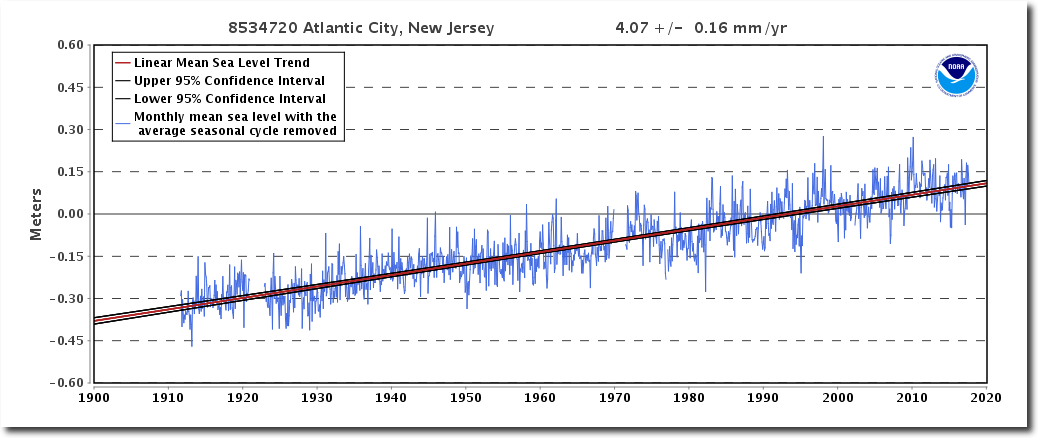
Over the past century, the long term sea level trend at Atlantic City has been a fairly steady 4.07 mm/year.
Sea Level Trends – State Selection
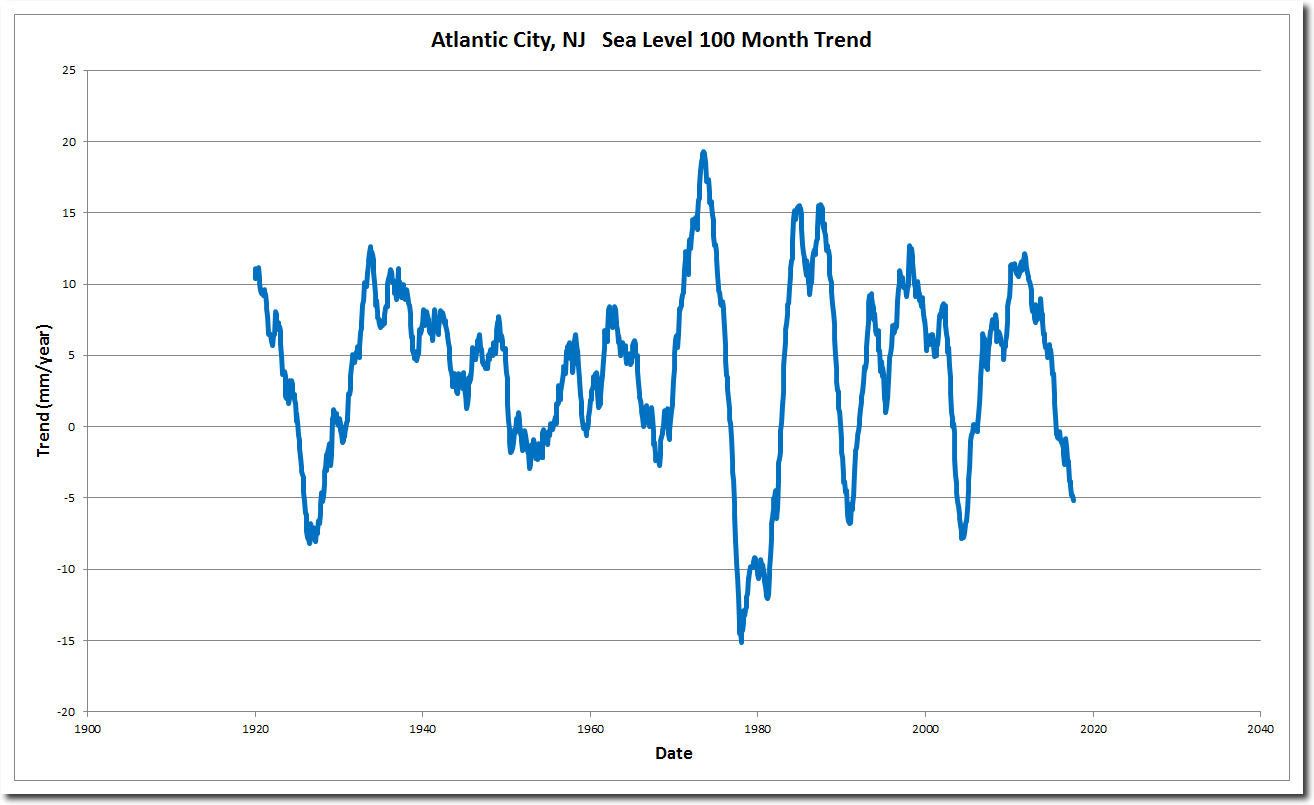
The rate of change in sea level peaked in 1973 at 19 mm/year, and follows an ~11 year cycle. Sea level is currently falling at Atlantic City at about 5mm/year.
Sea Level Trends – State Selection
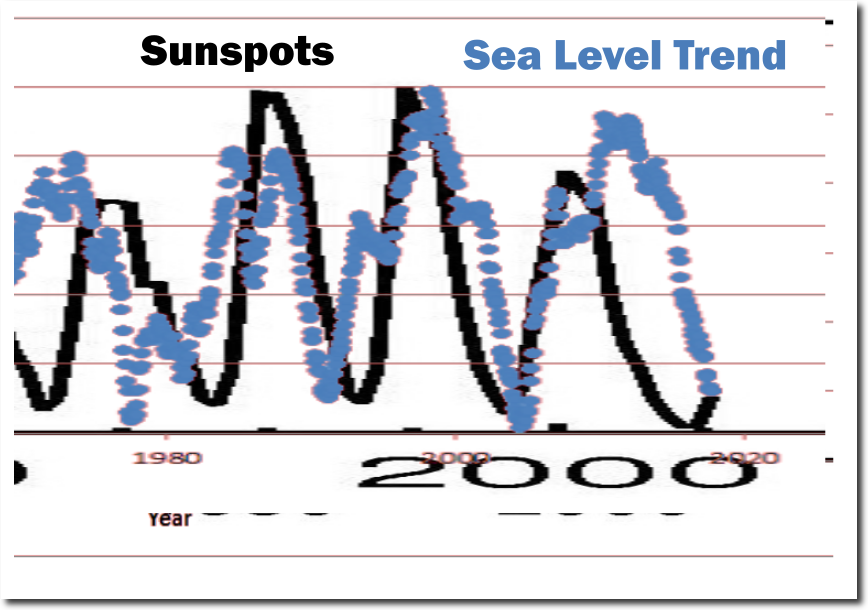
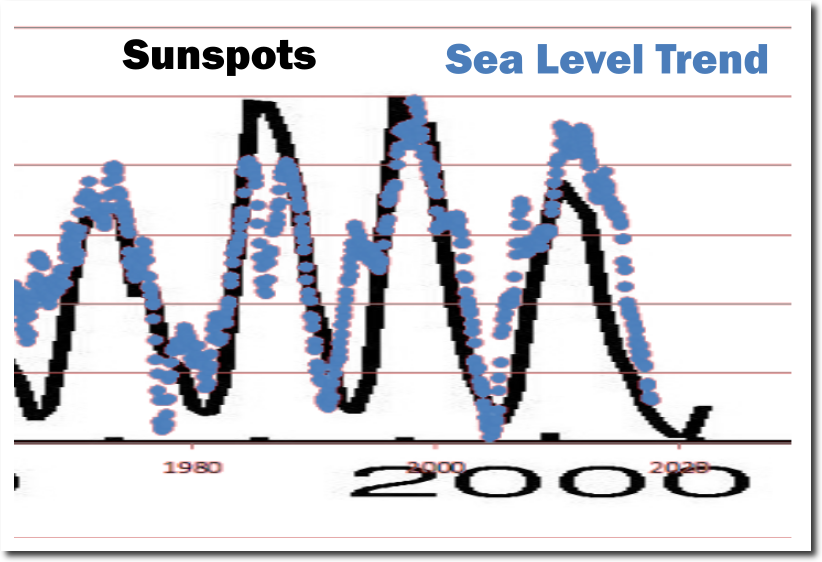
Atlantic City sea level trends loosely track solar activity, and show no correlation with CO2.
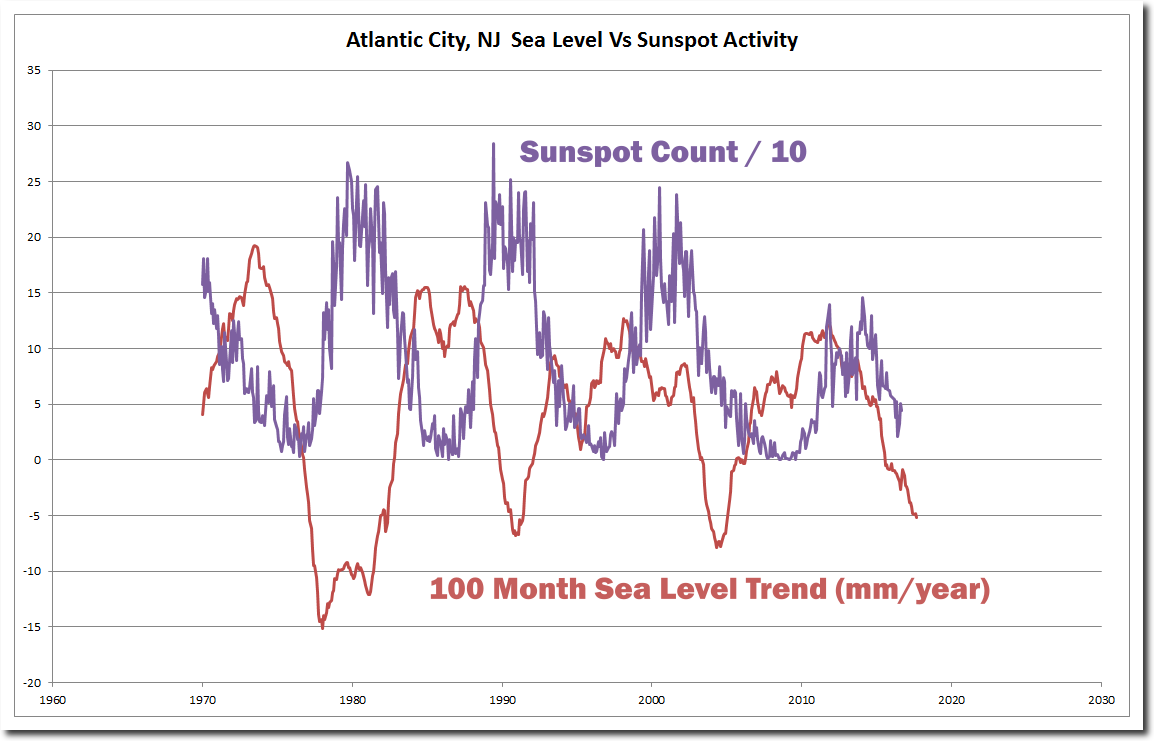
https://solarscience.msfc.nasa.gov/greenwch/SN_m_tot_V2.0.txt
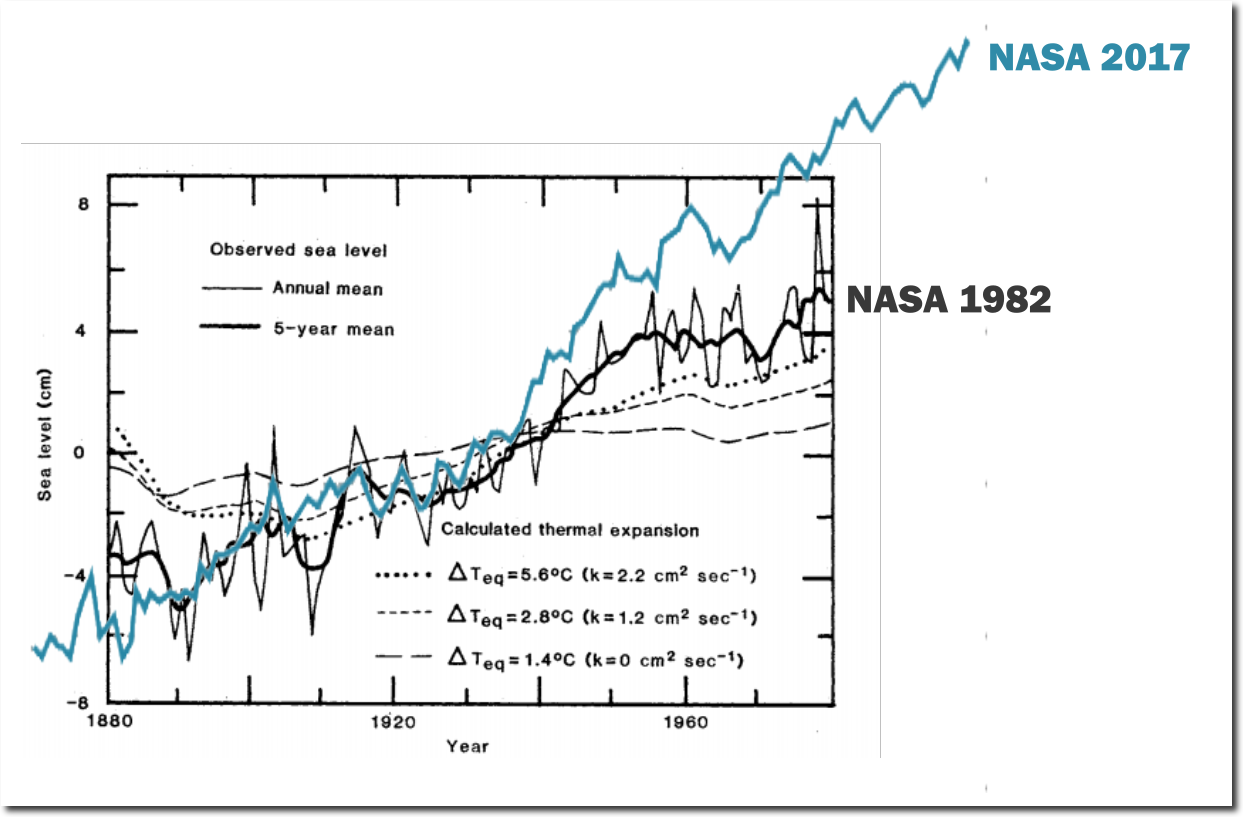
There is nothing in the sea level record which indicates humans have any influence, but lots of indication that the Sun controls it. However, there is one area of human influence – data tampering by government agencies.
Global warming is the biggest scam in science history, and is driven by tens of billions of dollars in government funding which has corrupted the science. The real trend started in 1993, when Vice-President Al Gore started purging skeptical scientists from funding sources. He created a consensus by separating anyone who dissented from funding dollars.
In questions of science, the authority of a thousand is not worth the humble reasoning of a single individual.
- Galileo Galilei
Five hundred years later, the Pope is still attacking scientists who question church dogma.
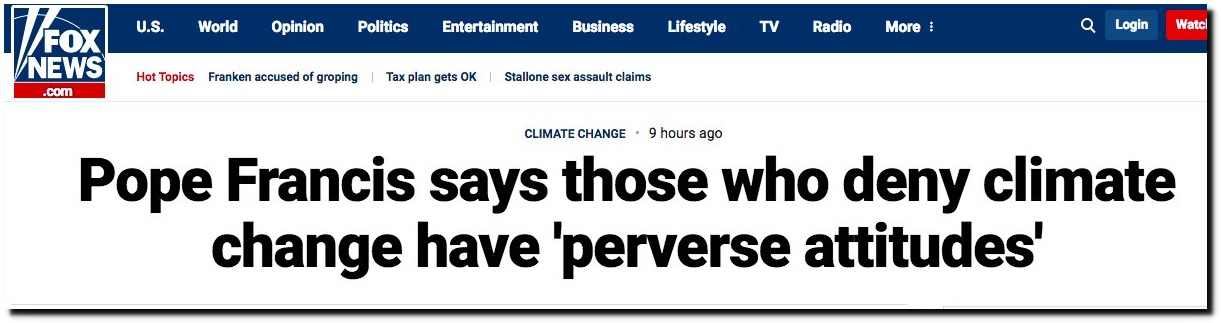
Forty years ago, pedophile Roman Polanski was ending his career, just as pedophile Sylvester Stallone was starting his.

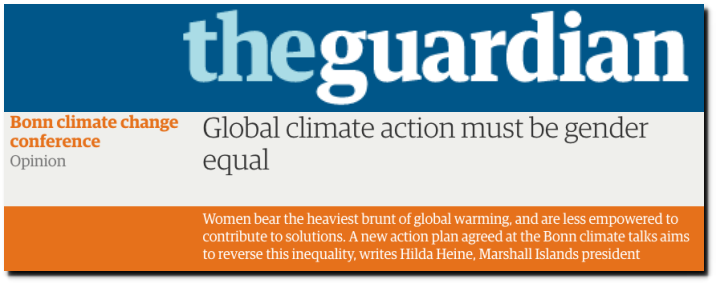
Global climate action must be gender equal | Hilda Heine | Opinion | The Guardian
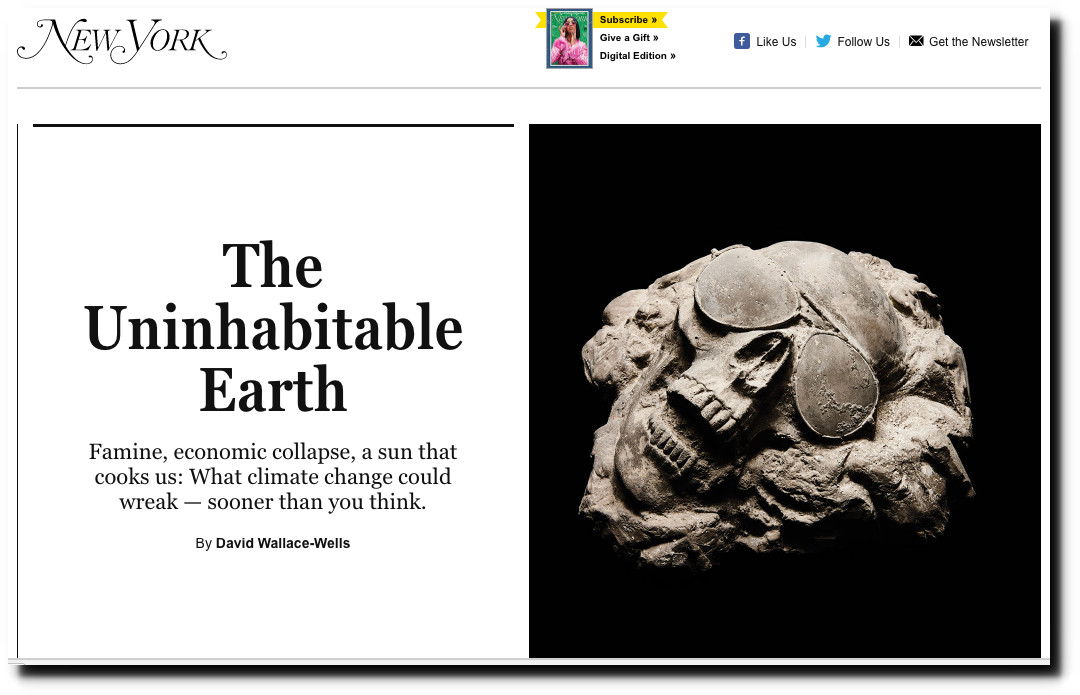
When Will Climate Change Make the Earth Too Hot For Humans?
These people need a full time psychiatrist, not a climate scientist.
It is an incredibly clear day today. I took this picture of NCAR from 2.4 miles away.

Then I rode my bike up to NCAR (first bike ride in three months, after being ill. Thanks for all your prayers.)

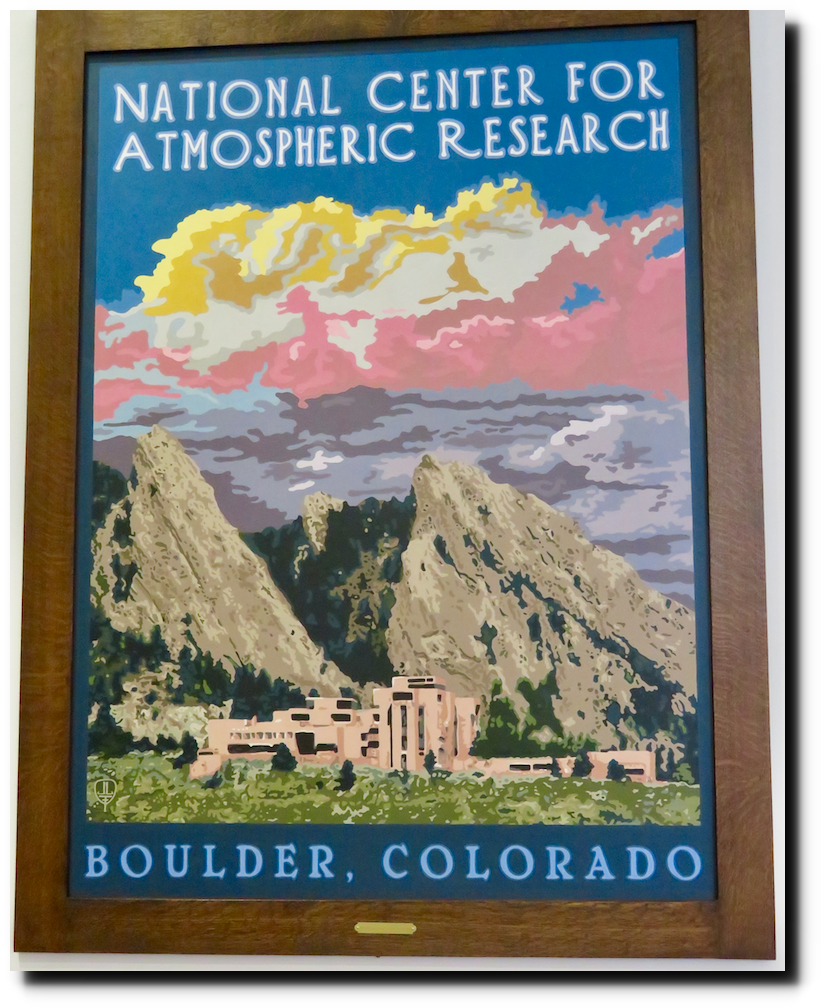
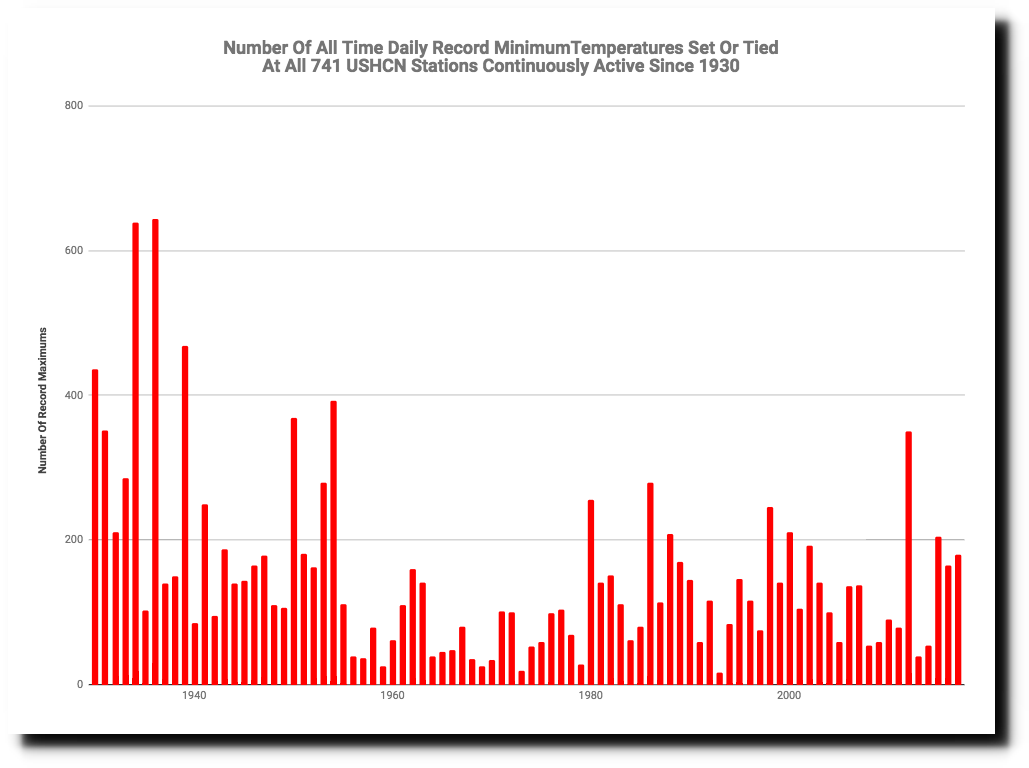
The NCAR museum has this spectacularly deceptive graph, claiming to show that record maximum temperatures are increasing in the US.

Their graph was carefully cherry-picked to start at a low point in the 1950’s, which cooled sharply after 1954. Had they started the graph in 1930, it would have been obvious that record maximums are declining in the US.
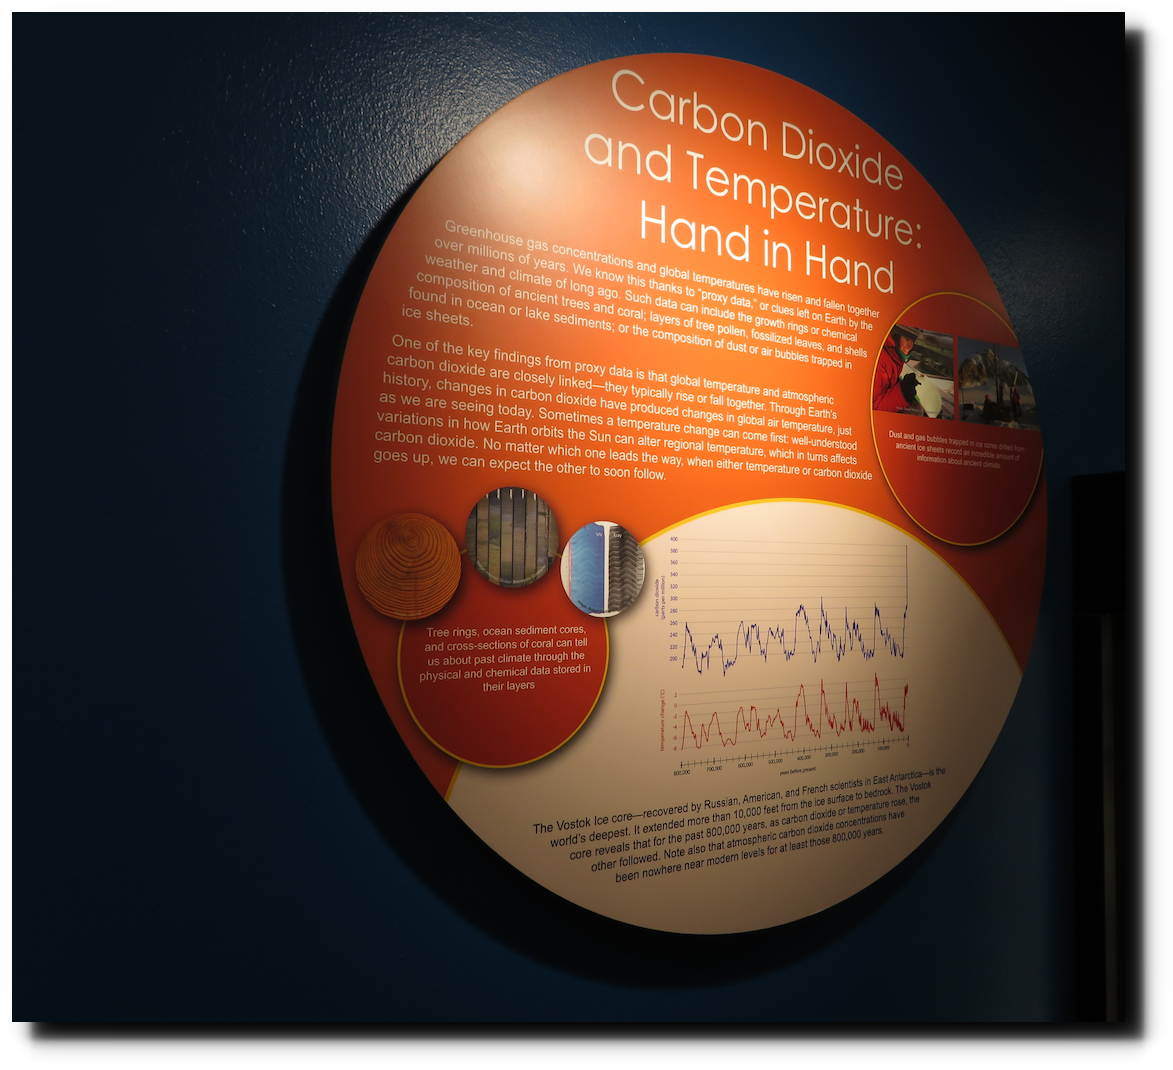
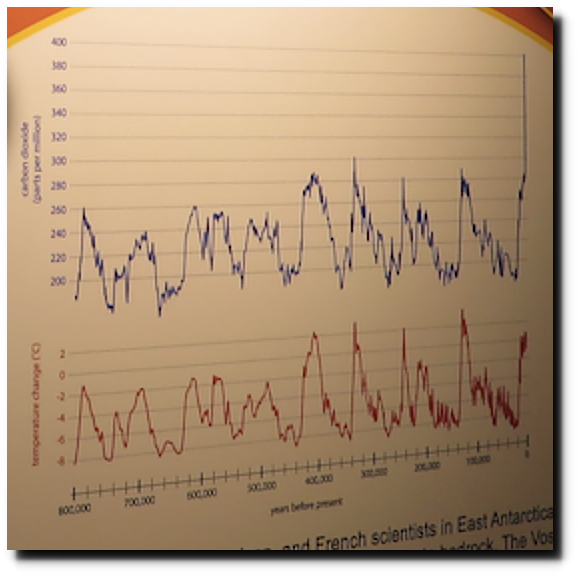
Next to that fake graph is this fake graph, designed to show that CO2 drives temperature. They forgot to mention that the relationship is the exact opposite – CO2 lags temperature, and is driven by decreasing solubility of carbonate ions as seawater temperature increases.
Is anyone at NCAR actually stupid enough to believe that a 100PPM swing in CO2 produces a 10C swing in temperature?
Today was a very clear day for climate fraud at Kevin Trenberth’s NCAR. This picture was taken from four miles away.
Democrats demanded that Comey be fired, and now say Trump should be impeached for firing Comey.
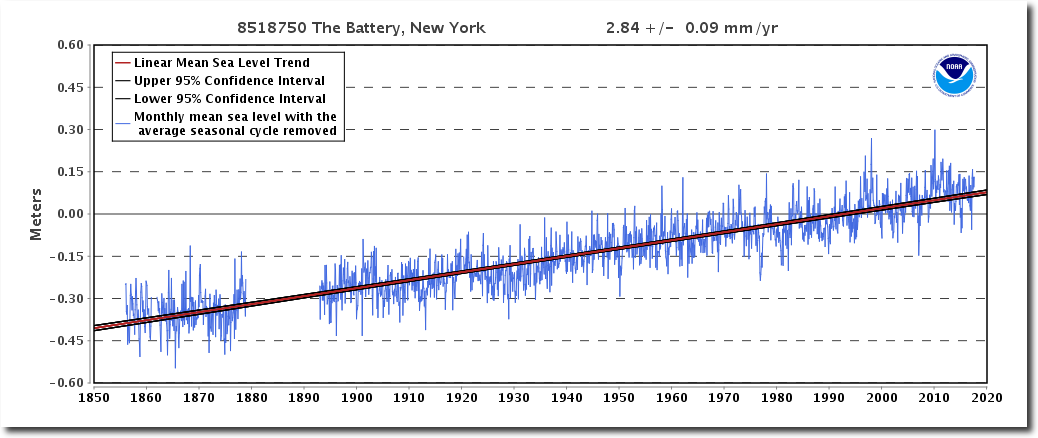
The long term rate of sea level rise at Manhattan has been a fairly constant 2.84 mm/year since Abraham Lincoln was president.
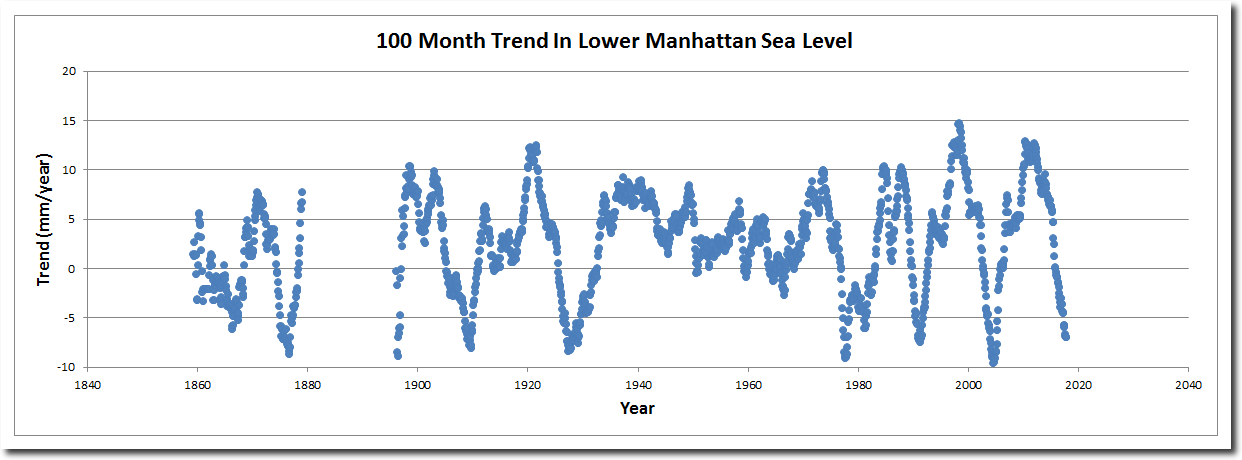
 Sea Level Trends – State Selection
The 100 month trend loosely tracks sunspot cycles, and Manhattan sea level is currently falling at about 6 mm/year.
Sea Level Trends – State Selection

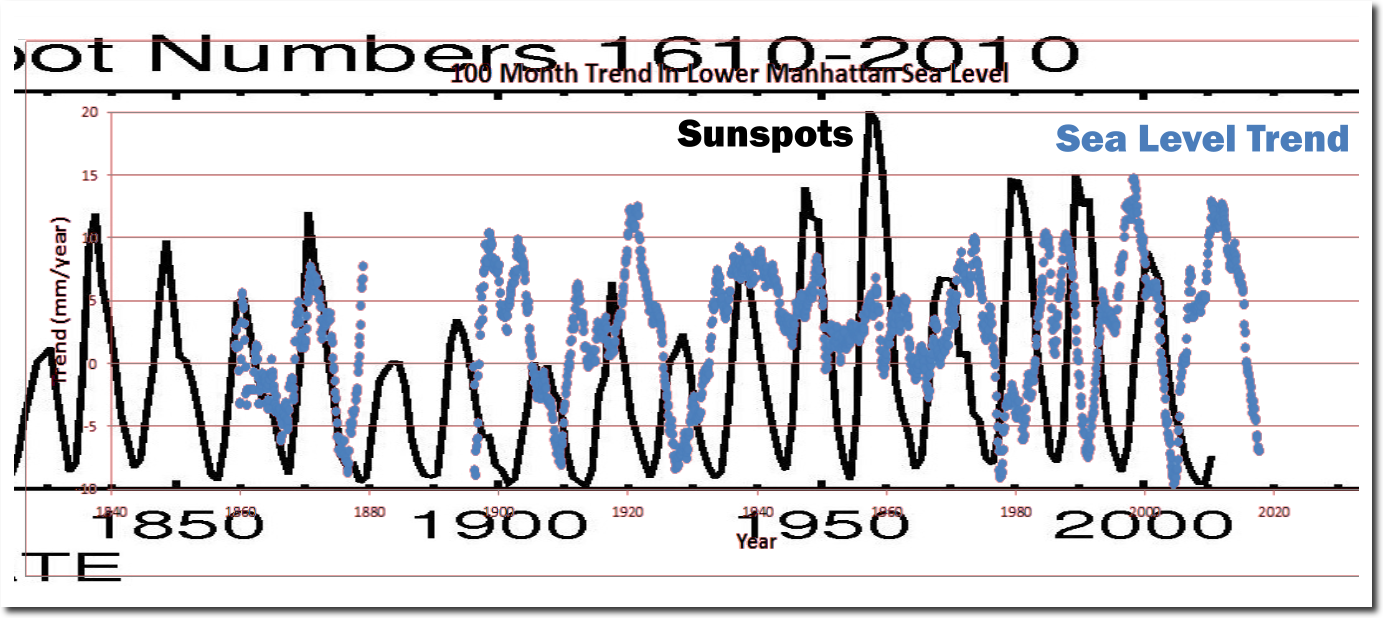
This next graph shows 1970 to the present, phase shifted to align the peaks
Facts make no difference to climate scientists. so they recycle the same baseless and brainless scares generation after generation.
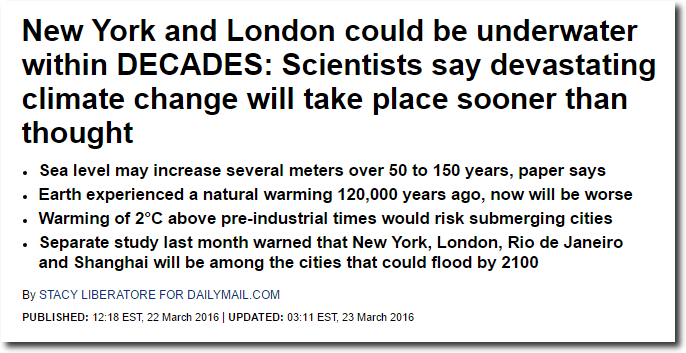
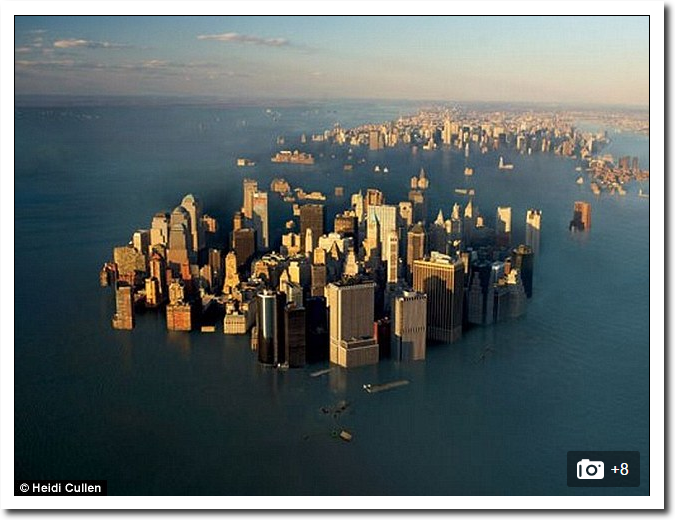
New York and London could be underwater within DECADES due to climate change |
Same story as 1934.
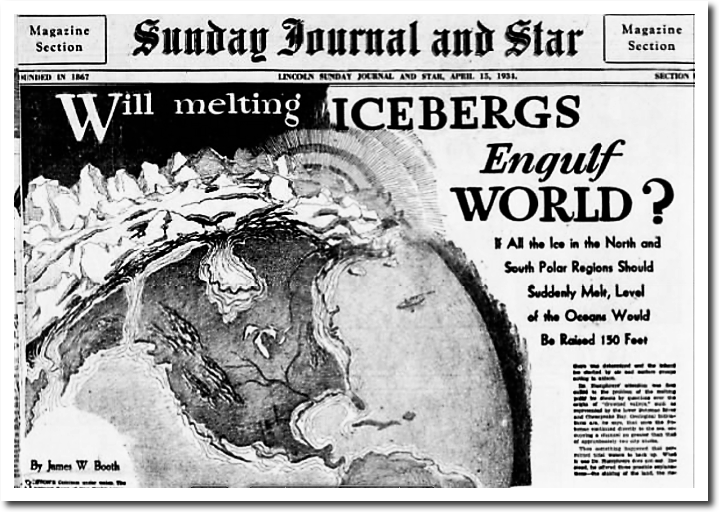

15 Apr 1934, Page 33 – The Lincoln Star
There is lots of evidence that sea level is controlled by the Sun, and zero evidence that man has any influence on it.