


Disrupting the Borg is expensive and time consuming!

Google Search
-
Recent Posts
- You Can’t Fool Mother Nature
- Cattle And The Climate
- One Atomic Bomb Per Hour
- New Video : Analyzing Oil And Gas
- Is Antarctica Melting?
- High Speed Analysis And Visualization
- El Nino To The Rescue?
- Fake News Update
- Growth Of Antarctic Sea Ice
- 65 Years Of Progress!
- El Nino To The Rescue?
- Worst March Drought On Record
- ChartGL Process Control Demo
- The Biggest Money Laundering Scam
- Drought In The Headwaters Of Lake Powell
- Unrealistic Expectations Of Water Availability
- Did Bill Gates Do This?
- Worst March Drought On Record In The US
- The Real Hockey Stick Graph
- Analyzing The Western Water Crisis
- Gaslighting 1924
- “Why Do You Resist?”
- Climate Attribution Model
- Fact Checking NASA
- Fact Checking Grok
Recent Comments
- conrad ziefle on You Can’t Fool Mother Nature
- Bob G on You Can’t Fool Mother Nature
- Gordon Vigurs on You Can’t Fool Mother Nature
- arn on Cattle And The Climate
- Bob G on Cattle And The Climate
- Robertvd on Cattle And The Climate
- Bob G on Cattle And The Climate
- Robertvd on Cattle And The Climate
- Billyjack on Cattle And The Climate
- Bob G on Cattle And The Climate
New Video : 100% Confidence Of Incompetence In The National Climate Assessment
Posted in Uncategorized
Leave a comment
Visualizing NOAA/NASA US Data Tampering
In 1991, NOAA showed little or no US warming and correctly showed the 1930’s as the hottest decade in the US. They showed the mean US temperature from 1901 to 1990 as 11.4C.
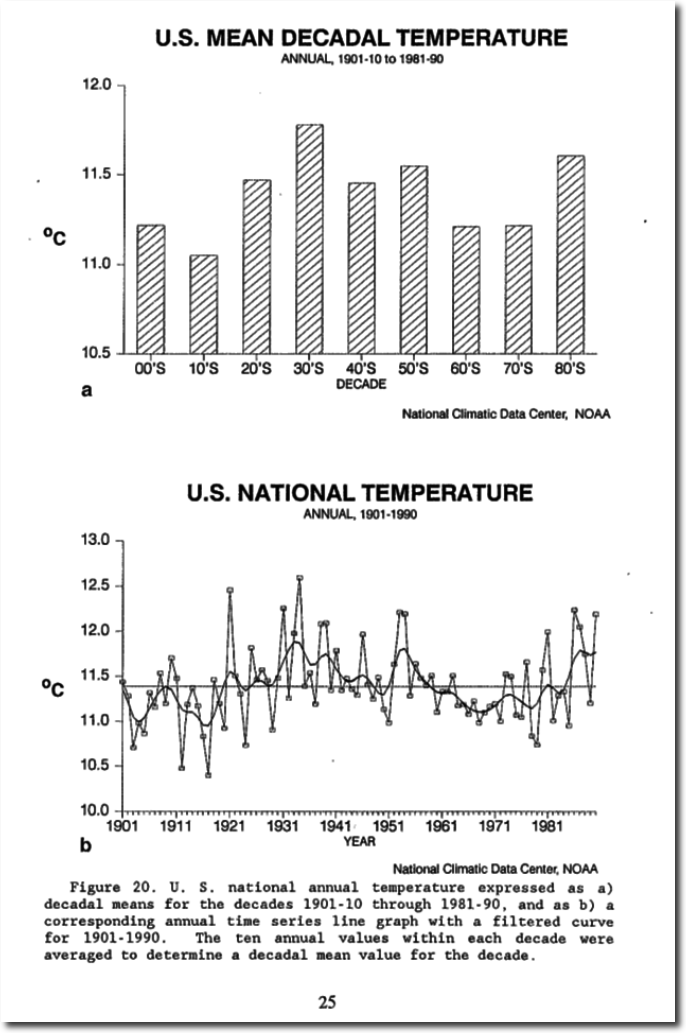
www1.ncdc.noaa.gov/pub/data/cmb/bams-sotc/climate-assessment-1981-1990.pdf
NOAA has since cooled the past, and now show the mean US temperature from 1901 to 1990 as 11.1C.
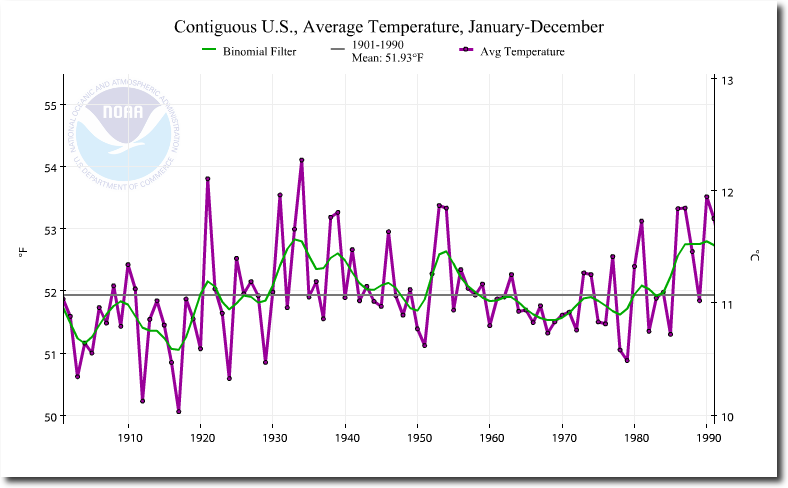
Climate at a Glance | National Centers for Environmental Information (NCEI)
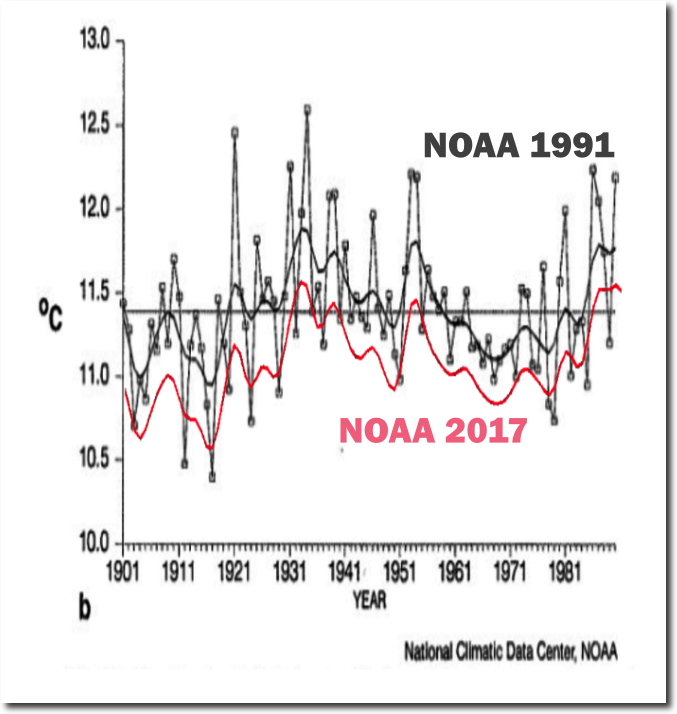
The next graph overlays the 2017 graph on the 1991 graph, at identical scales on both axes. NOAA creates US warming by cooling the past.
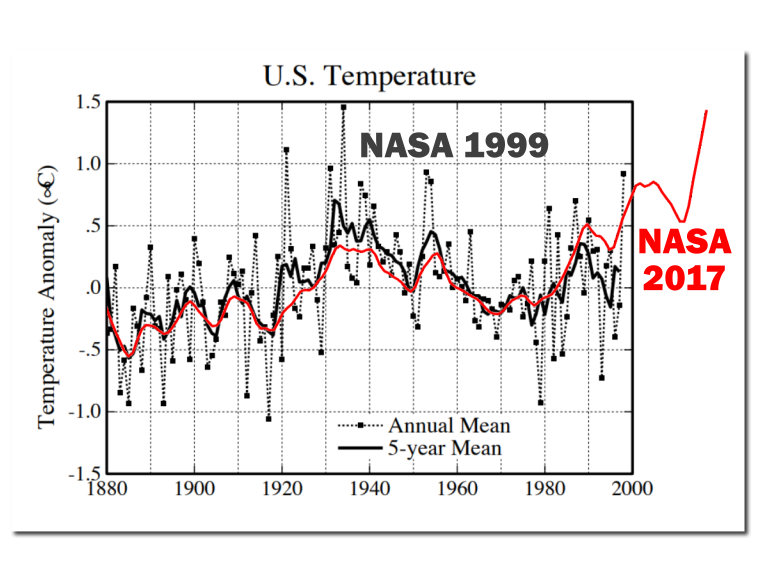
NASA does exactly the same thing. Their 1999 US temperature graph correctly showed the 1930’s as the hottest decade in the US, with subsequent cooling through the end of the century.

NASA has since cooled the period 1920-1950, and massively warmed post-1980 temperatures, to turn the cooling trend into a warming trend.
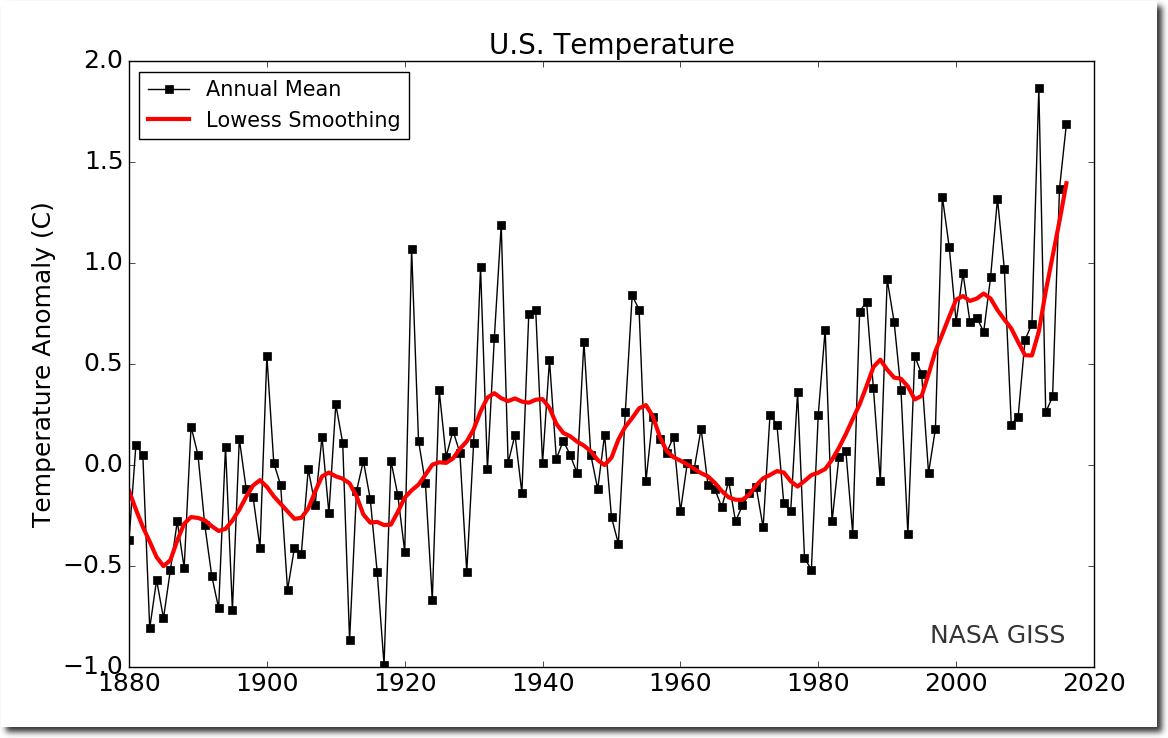
The next graph overlays the 2017 NASA graph on the 1999 NASA graph, with identical scales on both axes.
The US is the only place on Earth with reliable long term temperature data, and both NASA and NOAA have tampered with the data to turn post-1930 US cooling into warming.
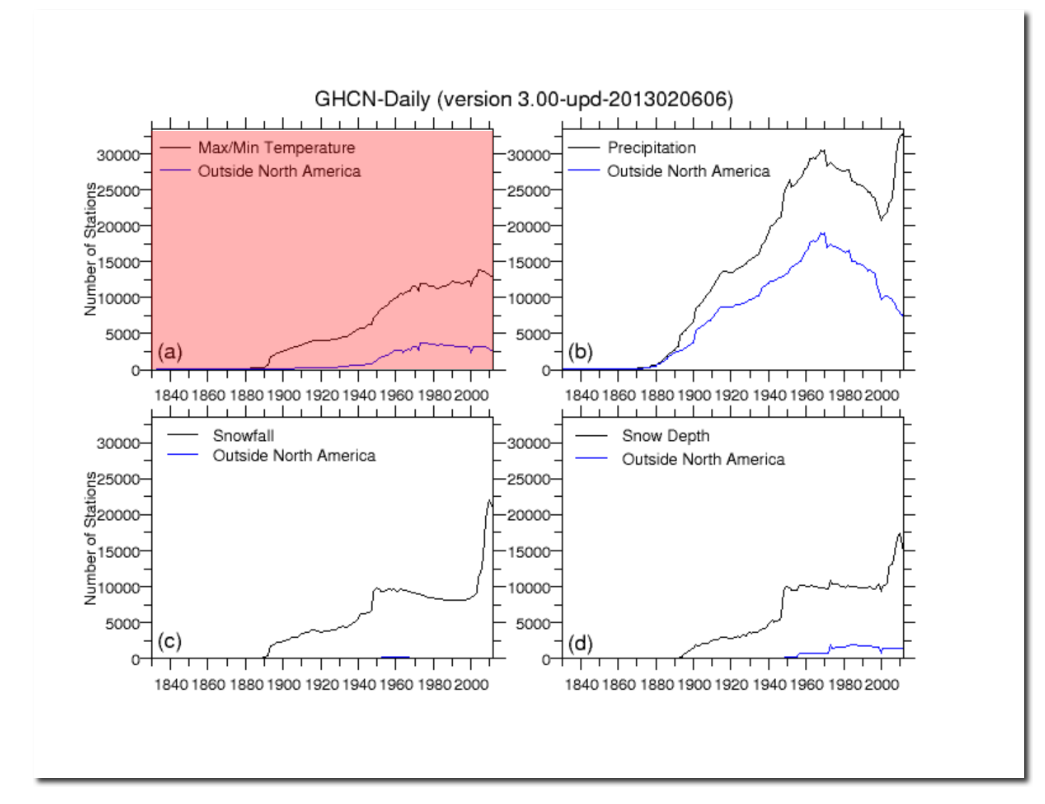
But it is much worse than it seems. NOAA has almost no daily temperature data outside of North America prior to 1930, and very little prior to 1950.
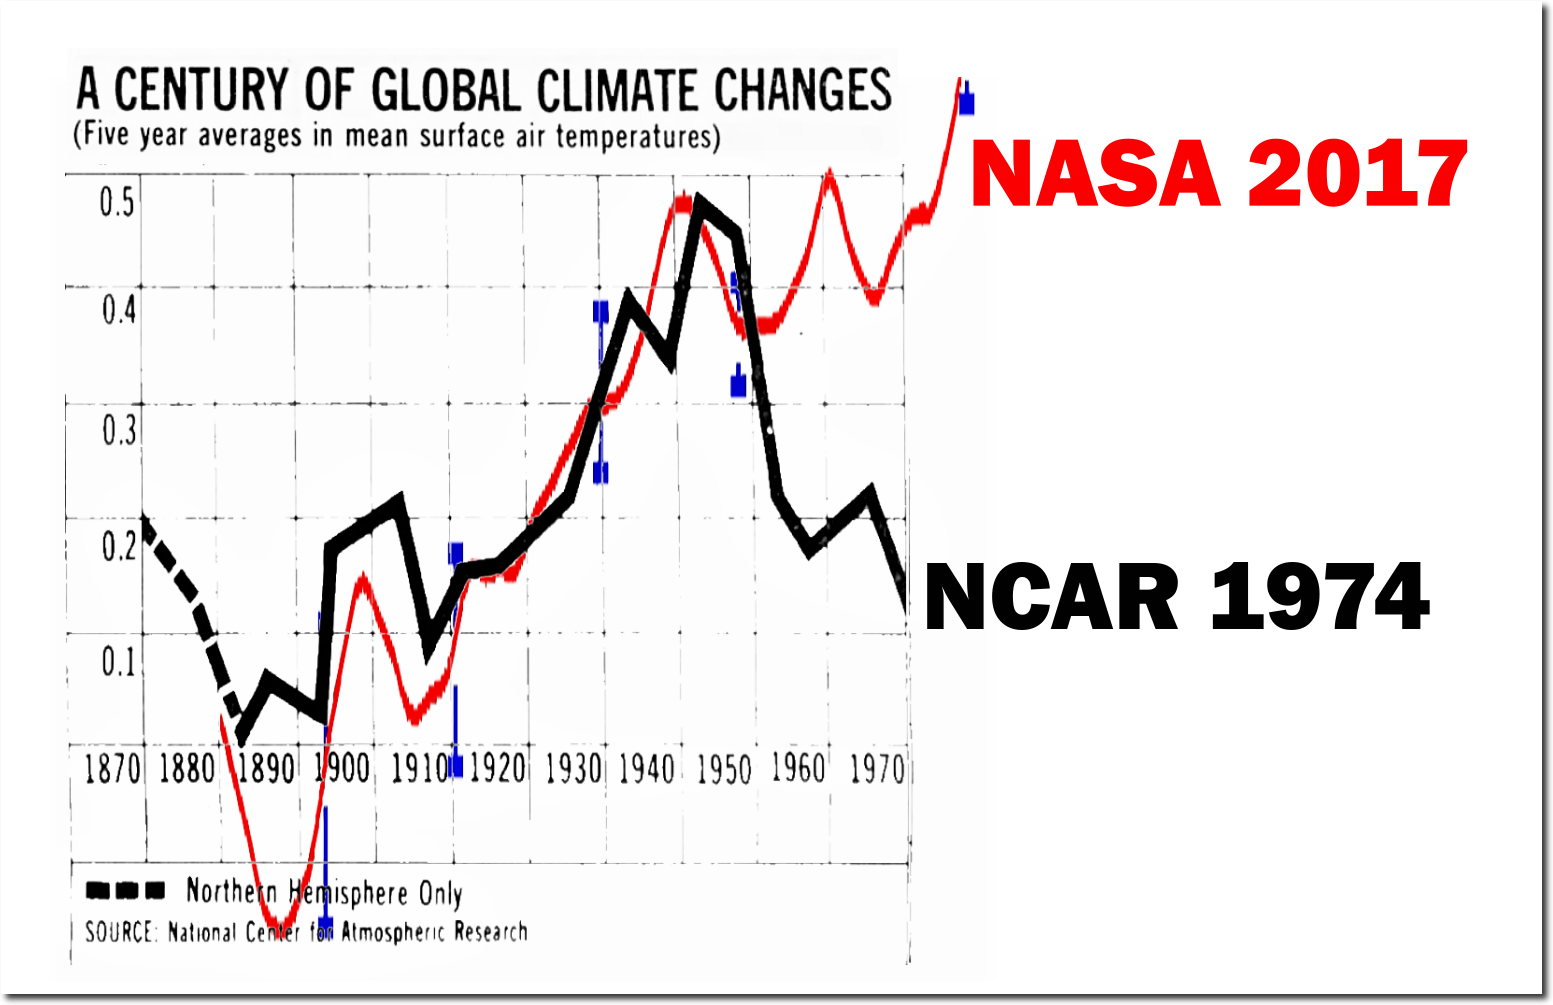
In 1974, the National Center for Atmospheric Research showed no net global warming prior to 1970, and a sharp cooling after 1945.
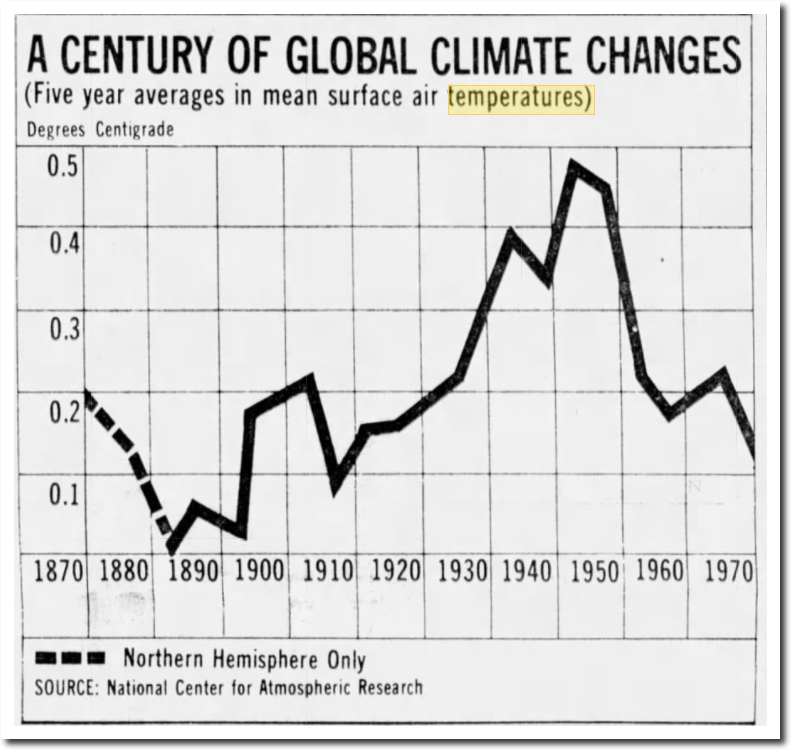
21 Jul 1974, 13 – The Des Moines Register at Newspapers.com
NASA has completely erased the post-1945 cooling, and created a large amount of warming prior to 1970.
The US temperature data has been tampered with to turn cooling into warming, and the global temperature data prior to 1950 is simply fake. It is time to put this global warming scam down once and for all.
Posted in Uncategorized
Leave a comment
New Video : Unambiguous Fraud In The National Climate Assessment
Posted in Uncategorized
Leave a comment
Left At War With America
- GOP senators gunned down playing baseball in Virginia
- Country and Western concert massacre in Las Vegas
- Baptist Church massacre in Texas
- Rand Paul attacked in his yard.
- Antifa violence to shut down free speech
The left has officially declared war on America. They dress like ISIS and use the same tactics.
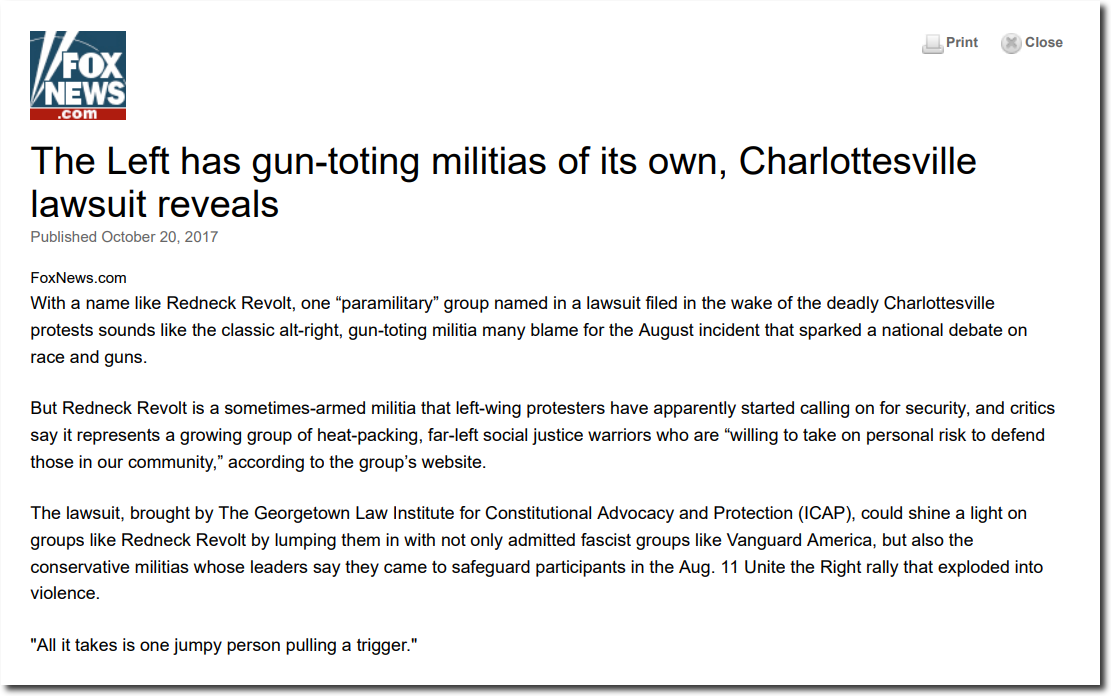
The Left has gun-toting militias of its own, Charlottesville lawsuit reveals | Fox News
Posted in Uncategorized
Leave a comment
Forget Hillary – Donna Brazille Has Unleashed Something Much More Important
The Deep State at work, once again. Like in 1963.


Posted in Uncategorized
Leave a comment
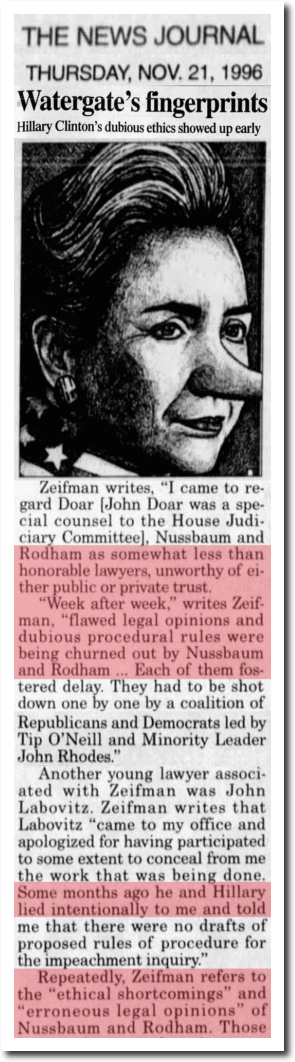
The Finest Of The DNC Women
The top two Democratic Party women achieved their positions through many decades of fraud, lies and malfeasance. That is what Democrats love and respect!
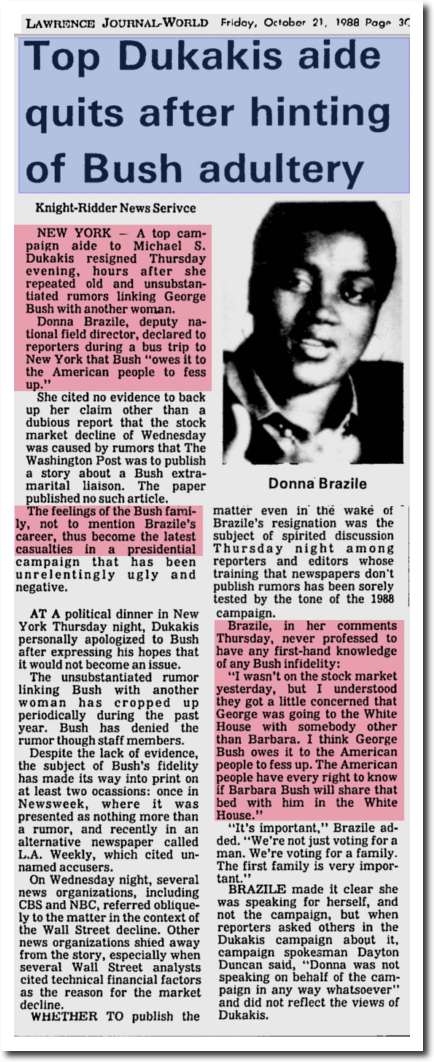
Lawrence Journal-World – Google News Archive Search
Posted in Uncategorized
Leave a comment
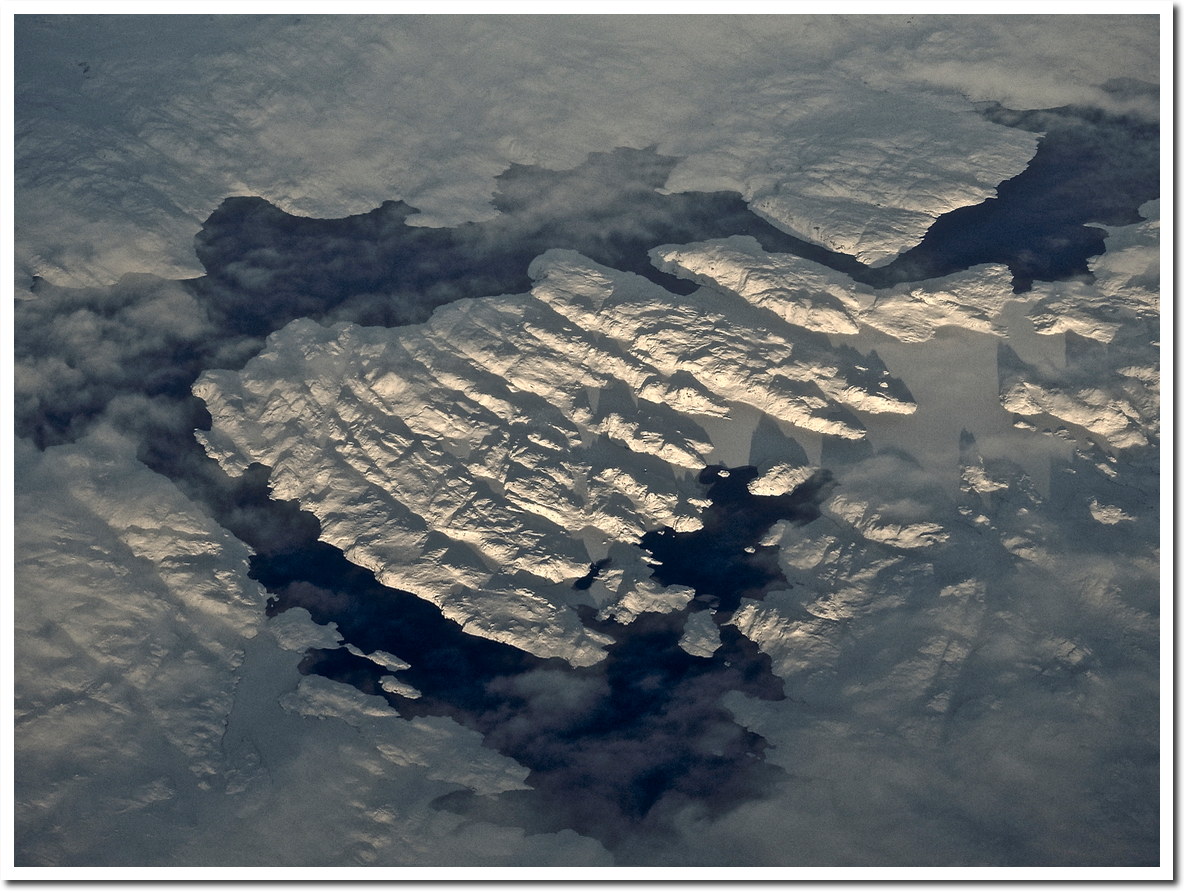
Photos Delivered
I just mailed all of the photo prints which were requested by donors (that I am aware of.) If you asked for or were expecting a print and I didn’t E-mail a confirmation to you today, please let me know.
It turns out that the whole process is quite expensive. A 13×19 print to the UK is about $50 cost for materials, mailing costs and time. I may have to rethink how I do this.
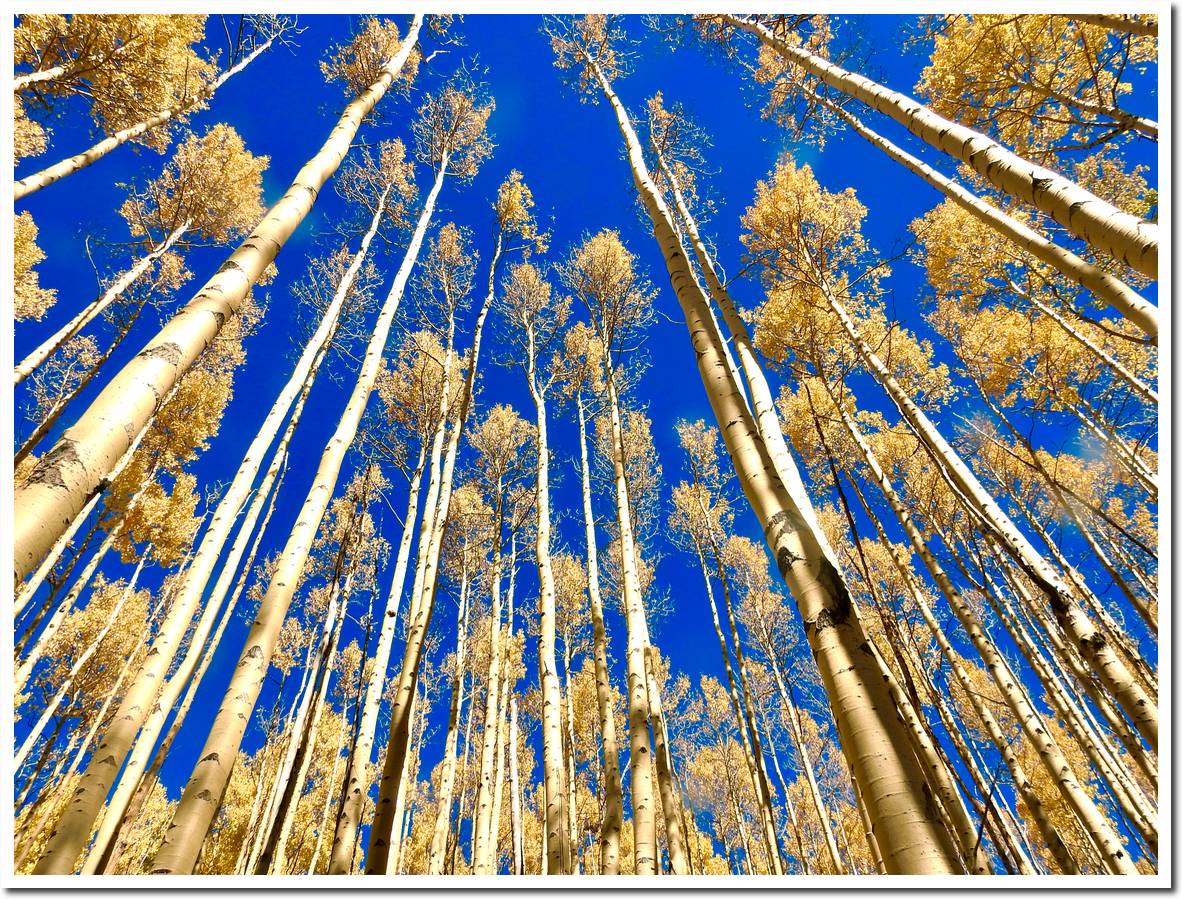
These photos were some of the favorites so far.
Western Greenland
Boulder
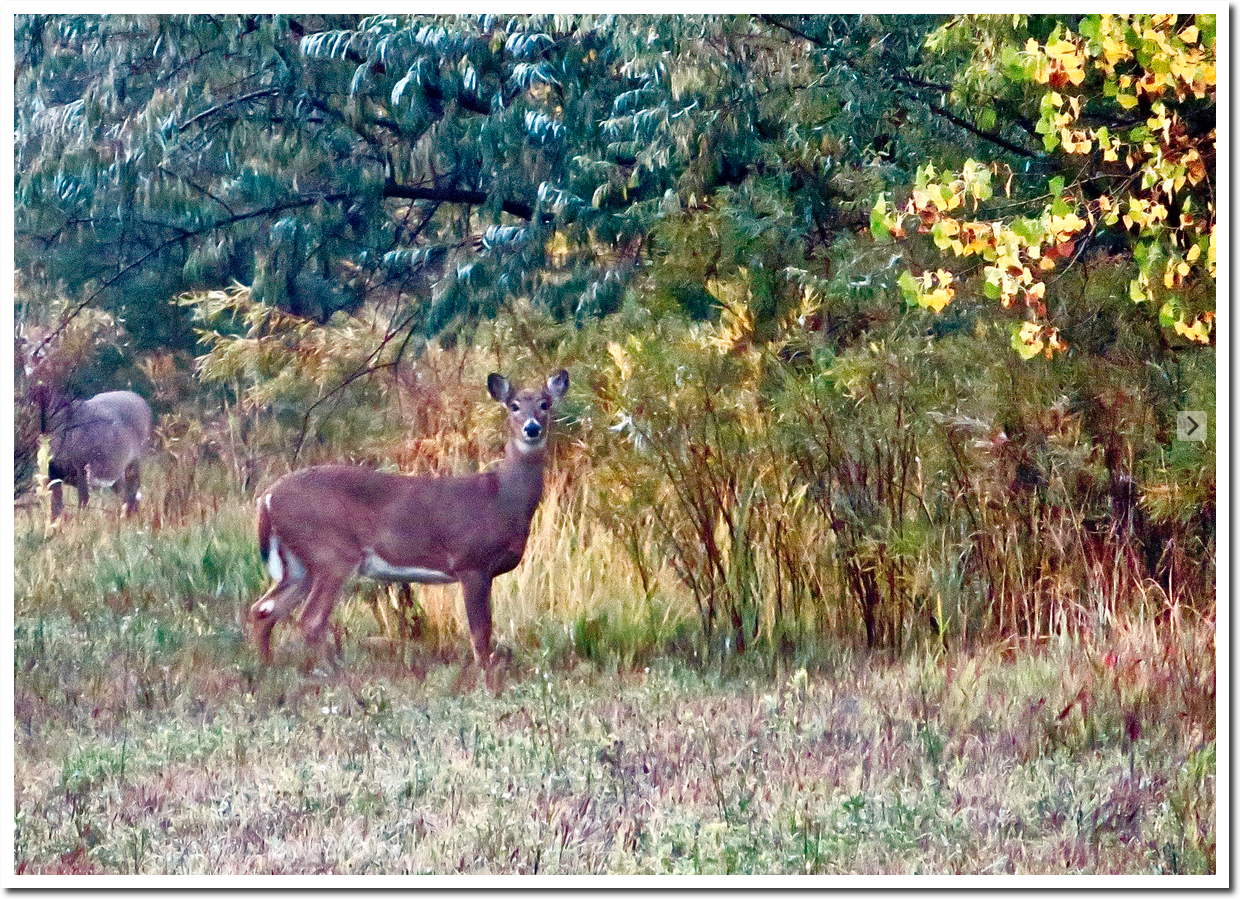
Santa Fe
Posted in Uncategorized
Leave a comment