Disrupting the Borg is expensive and time consuming!
Google Search
-
Recent Posts
- One Atomic Bomb Per Hour
- New Video : Analyzing Oil And Gas
- Is Antarctica Melting?
- High Speed Analysis And Visualization
- El Nino To The Rescue?
- Fake News Update
- Growth Of Antarctic Sea Ice
- 65 Years Of Progress!
- El Nino To The Rescue?
- Worst March Drought On Record
- ChartGL Process Control Demo
- The Biggest Money Laundering Scam
- Drought In The Headwaters Of Lake Powell
- Unrealistic Expectations Of Water Availability
- Did Bill Gates Do This?
- Worst March Drought On Record In The US
- The Real Hockey Stick Graph
- Analyzing The Western Water Crisis
- Gaslighting 1924
- “Why Do You Resist?”
- Climate Attribution Model
- Fact Checking NASA
- Fact Checking Grok
- Fact Checking The New York Times
- New Visitech Features
Recent Comments
- conrad ziefle on One Atomic Bomb Per Hour
- Timo, Not that one on One Atomic Bomb Per Hour
- Bob G on One Atomic Bomb Per Hour
- Crispin Pemberton-Pigott on One Atomic Bomb Per Hour
- william on 65 Years Of Progress!
- arn on One Atomic Bomb Per Hour
- Gordon Vigurs on One Atomic Bomb Per Hour
A Simple Solution To Controlling Global Warming
New Scientist asks “can we limit global warming to 2°C?”
Living with climate change: Can we limit global warming to 2°C? | New Scientist
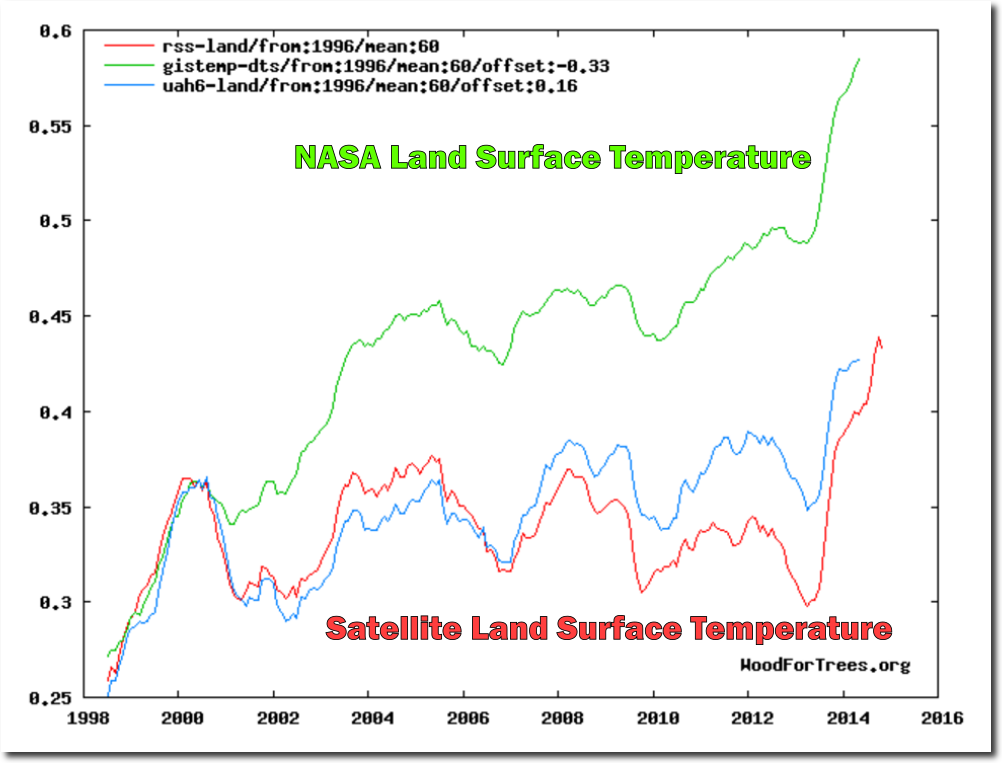
The answer is yes, and the cost is zero. Most man-made global warming is made by Gavin Schmidt and his friends tampering with data.
President Trump can control or eliminate man-made global warming by firing Gavin Schmidt at NASA, and replacing him with an honest person like John Christy. That would immediately lower 21st century warming to close to zero.
Posted in Uncategorized
Leave a comment
New Video : Roots Of The Global Warming Scam (Part 2)
The global warming scam began in earnest on this date in 1988.
Posted in Uncategorized
Leave a comment
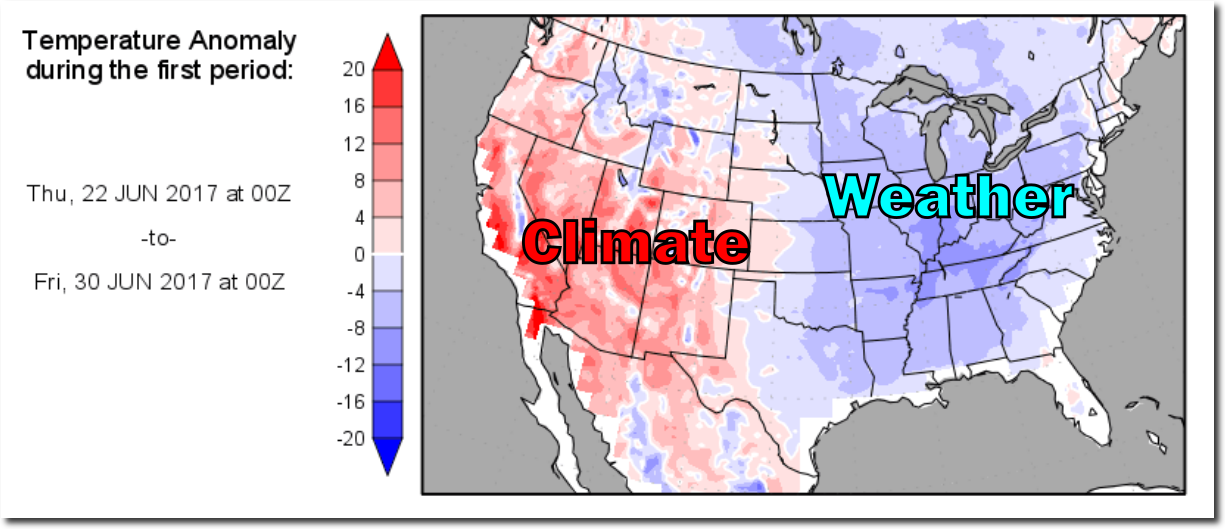
Distinguishing Between Climate And Weather
Climatologists maintain a highly rigorous distinction between weather and climate, shown in the map below.
Posted in Uncategorized
Leave a comment
1896 : Worst Heatwaves In History
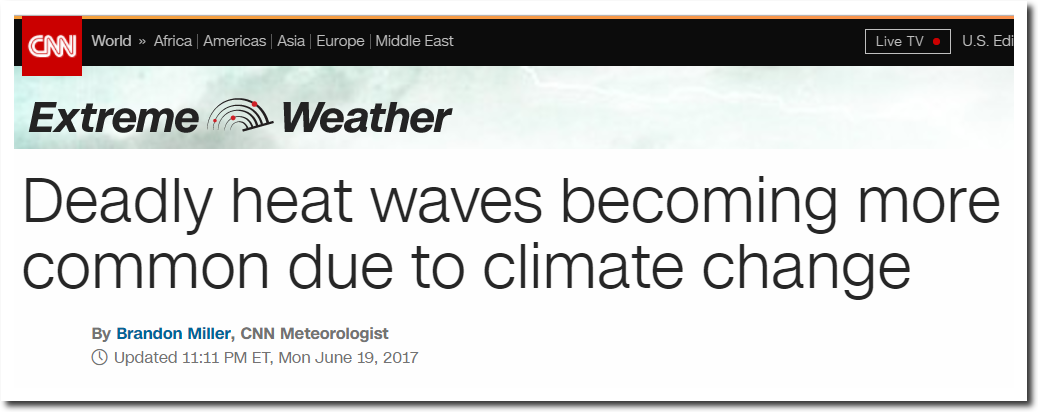
The fake news press is full of hysterical stories about heat in Arizona, and fake news CNN claims that heatwaves are getting worse.
Deadly heat waves to become more common – CNN.com
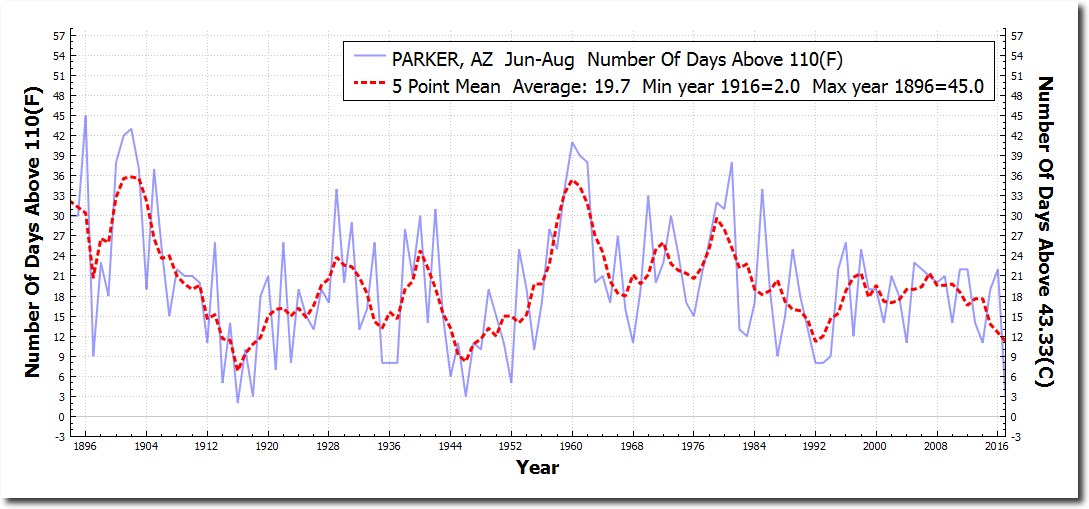
Actual data shows the exact opposite.
Every year around June 16, the press starts calling the heat in Arizona “historic.” Here is the identical story from last year. Climate criminals lie about the heat, and then call anyone who tells the truth a liar.
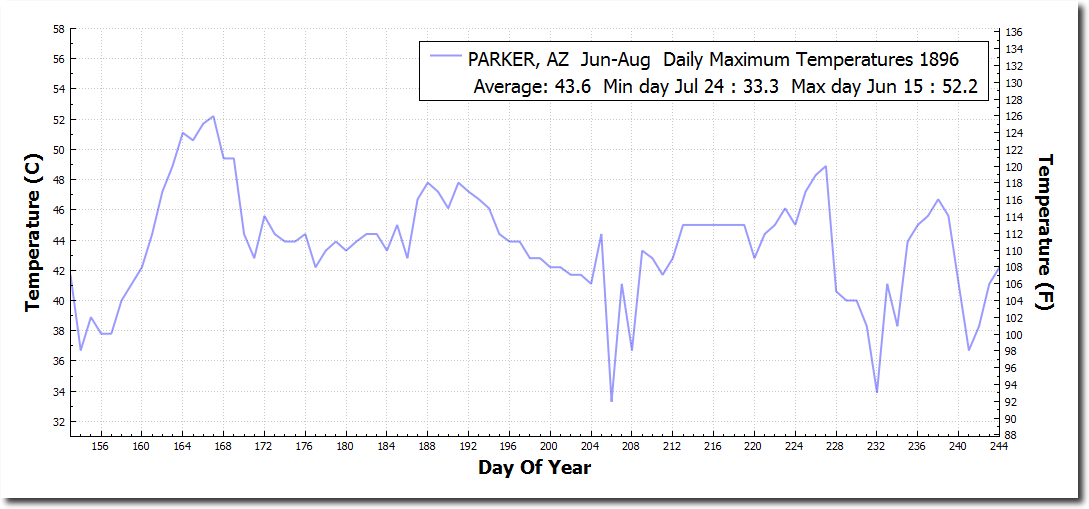
Arizona’s worst heatwaves actually occurred in 1896, when Parker, Az had 45 days over 110 degrees.
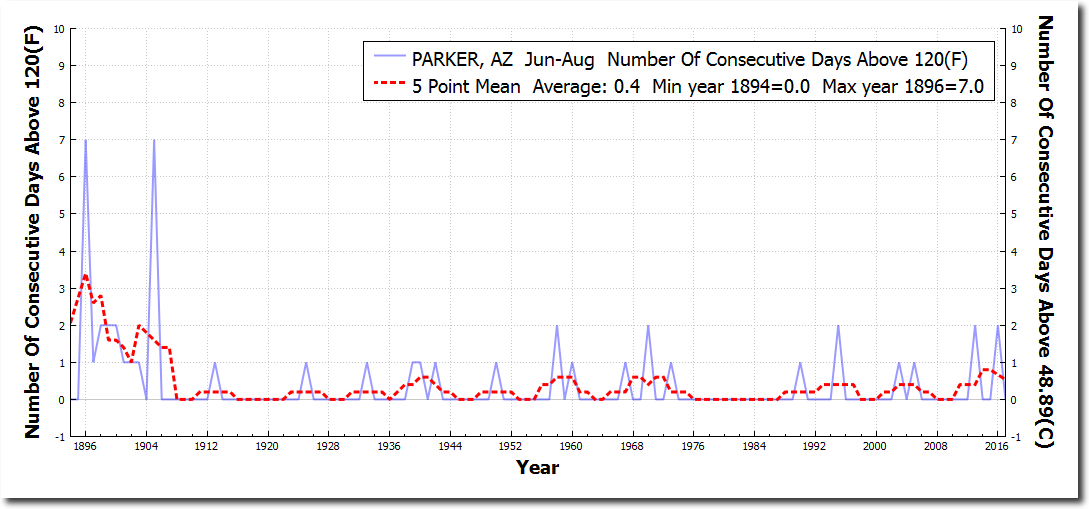
Parker had seven consecutive days over 120 degrees during June of 1896. This undoubtedly grounded all jet aircraft at the time..
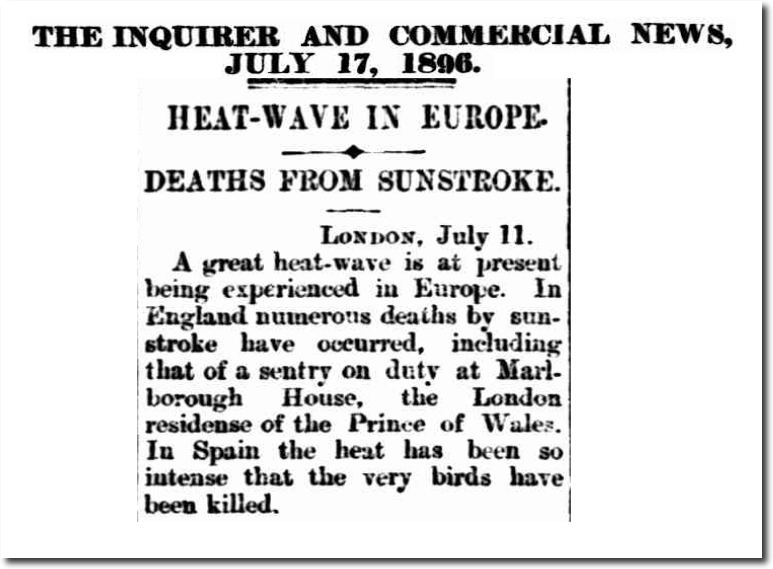
People in England were dropping dead from the heat that summer, as were birds in Spain. (Disclaimer : After NOAA adjustments, the birds were just fine.)
17 Jul 1896 – HEAT-WAVE IN EUROPE.
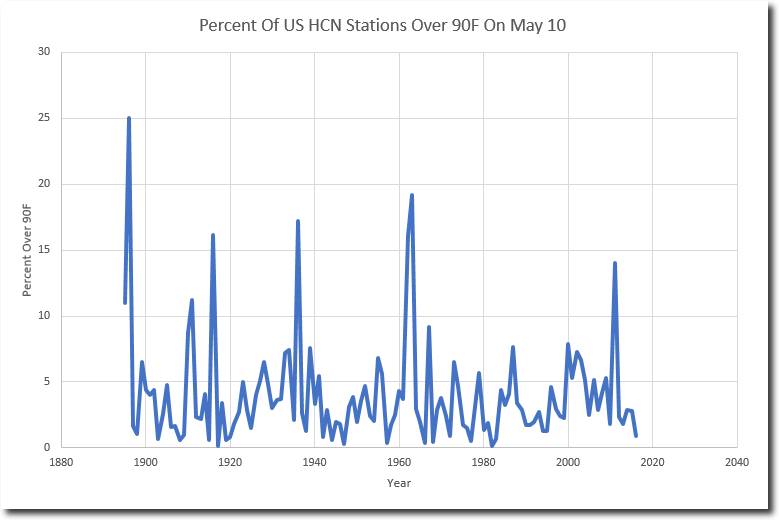
The Eastern US had an unprecedented heatwave during early May of 1896, with 90 degree temperatures extending up into Maine.
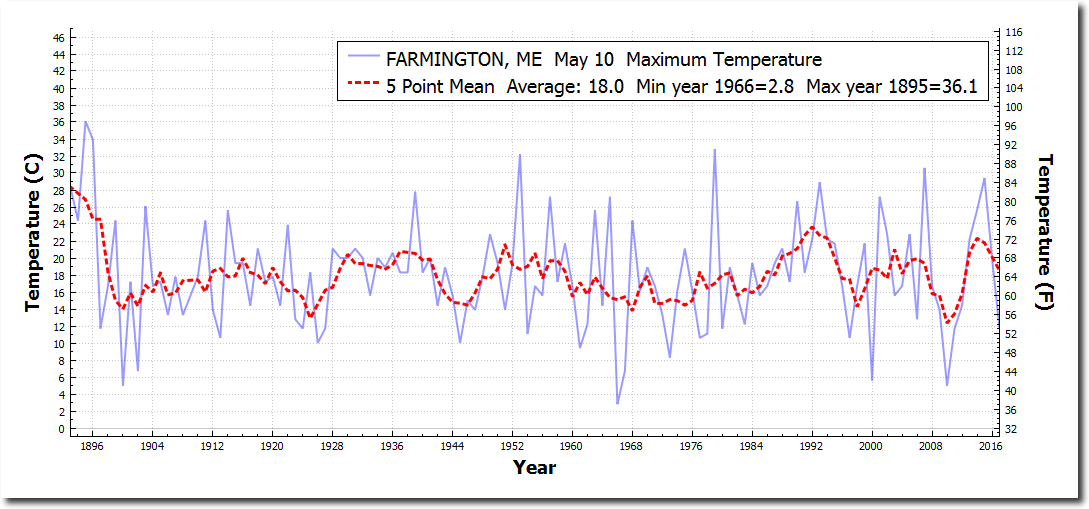
Farmington, Maine was 93 degrees on May 10 that year, after being 97 degrees on May 10, 1895. This year’s May 10 maximum at Farmington was 52 degrees.
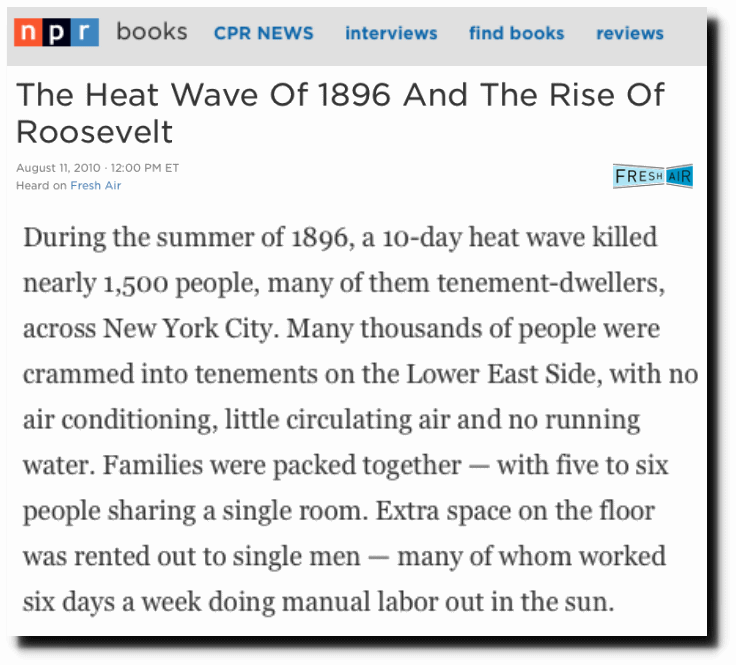
A ten day heatwave during August 1896 killed thousands of people in the US, many of them in New York.
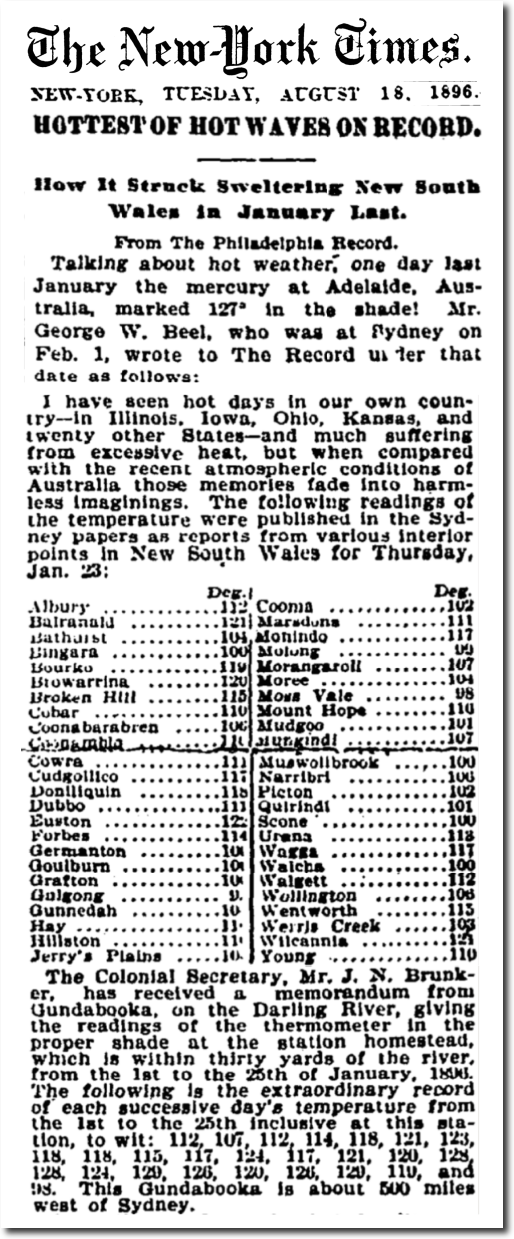
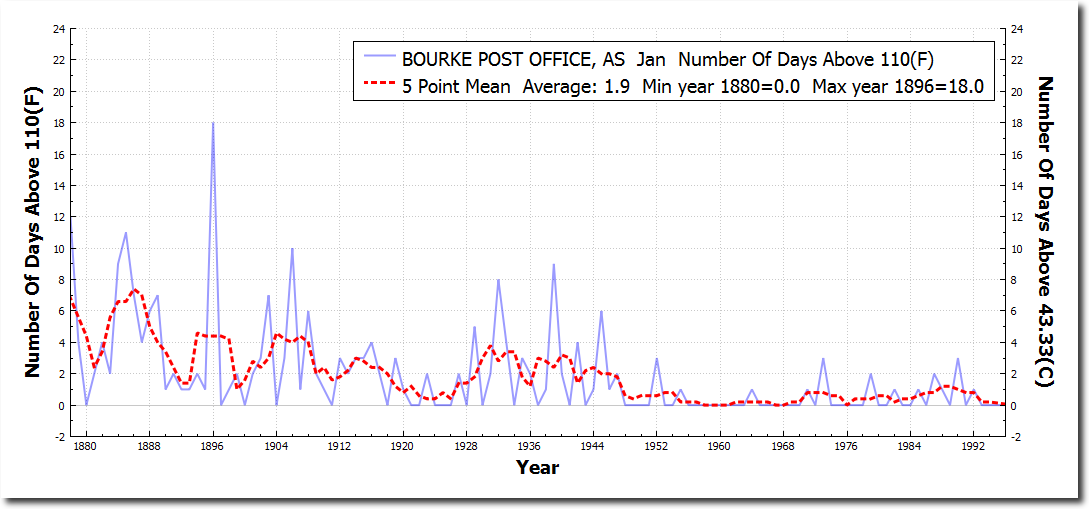
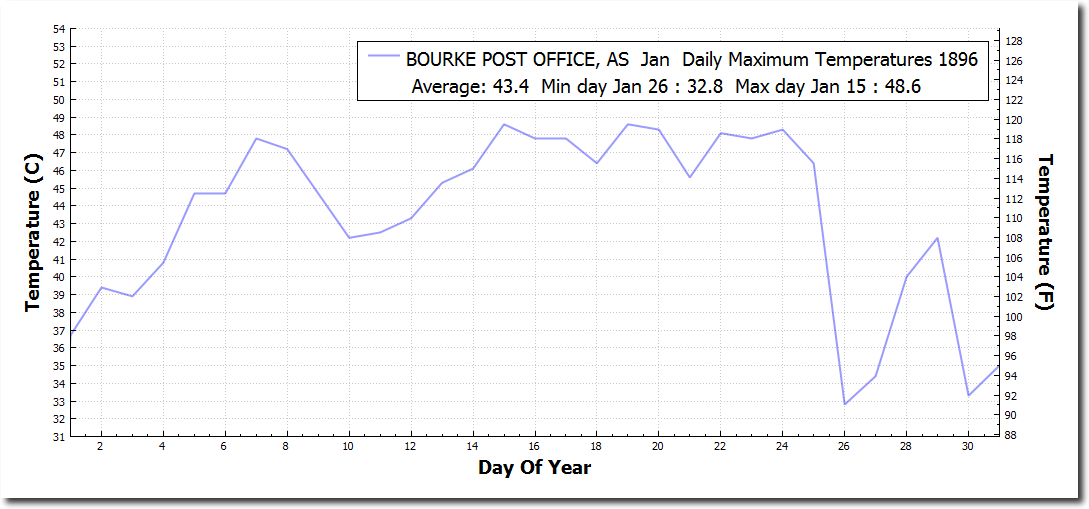
Australia had their worst heatwaves on record during January of 1896.
Bourke had 18 days over 110 degrees that month.
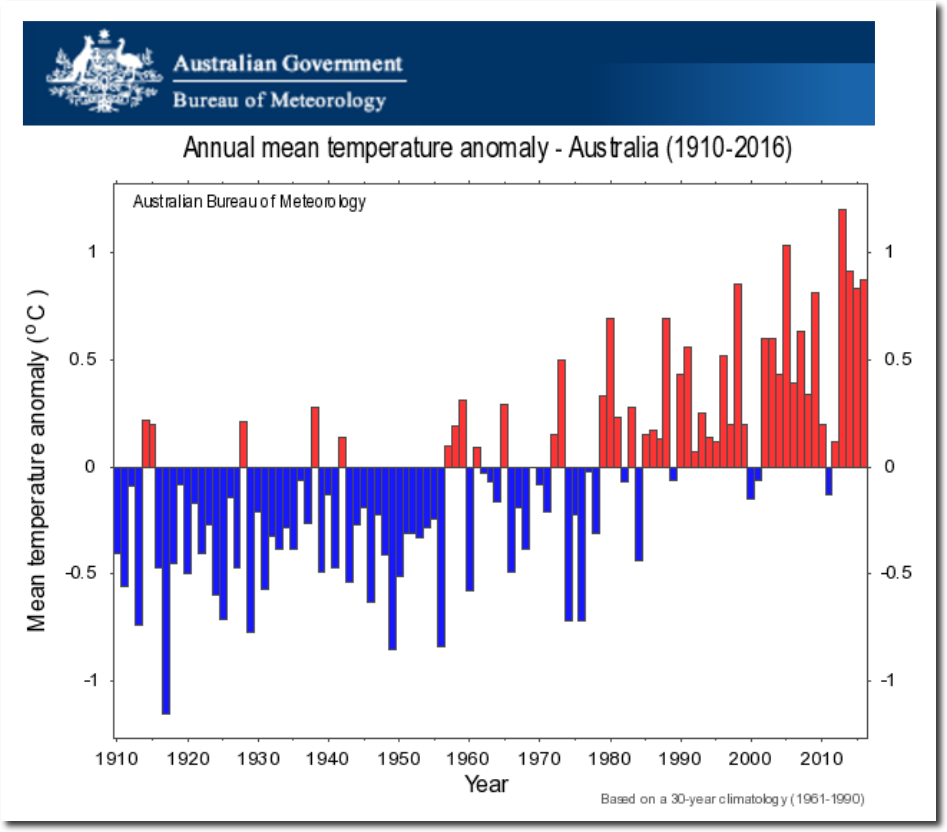
If climate scientists were actual scientists, they would want to know what 1896 was so hot. But they take a different approach. NOAA tampers with the data to cool the past, and Australia’s BOM simply pretends they don’t have data prior to 1910.
Climate change and variability: Tracker: Australian timeseries graphs
Climate science has nothing to do with science. It is about money and politics.
Posted in Uncategorized
Leave a comment
1988 : Spectacular Fraud From The World’s Top Climate Scientist
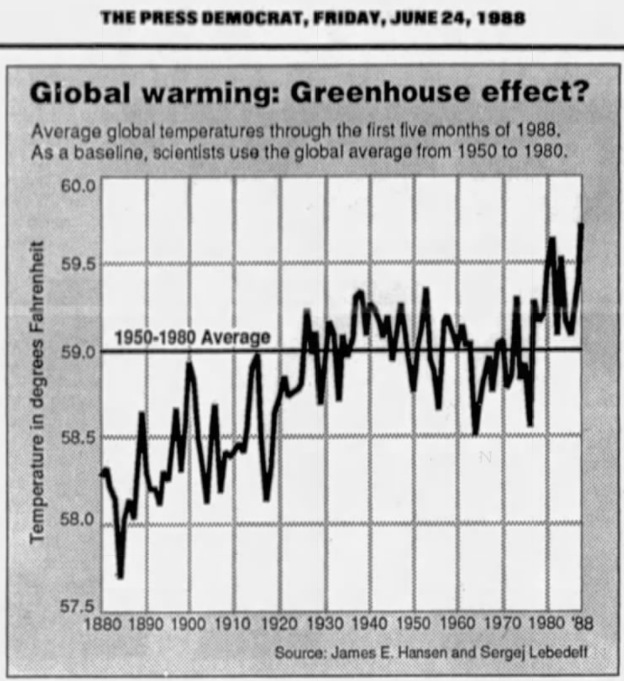
This week in 1988, with CO2 just below 350 PPM, the US blew away all records for heat, and NASA’s James Hansen told Congress that heat waves were due to human emissions of CO2.
24 Jun 1988, Page 17 – Santa Cruz Sentinel
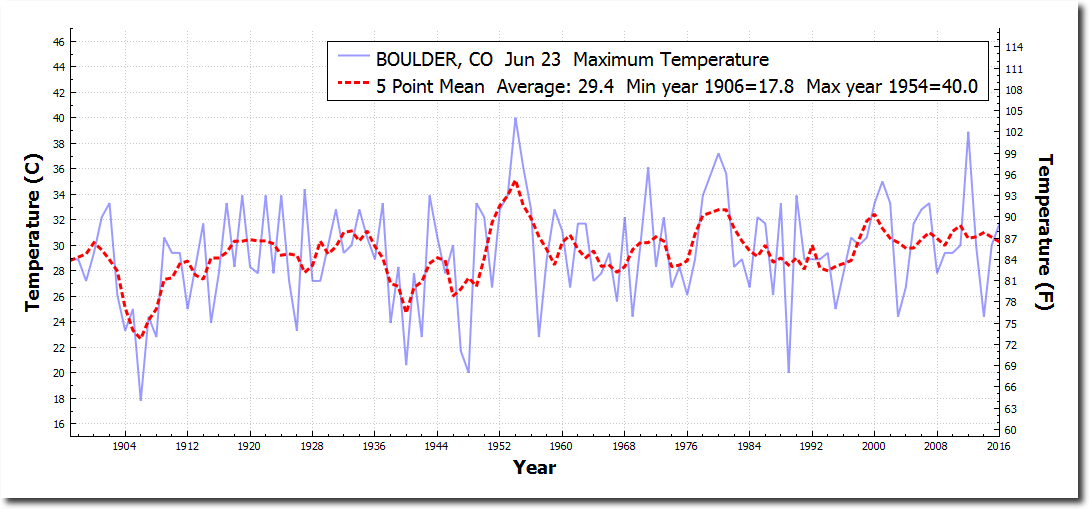
June 21 temperatures have plummeted in the US over the past century, with 1988 and 1933 being the only years with an average temperature above 90F. The heat of 1988 was an outlier, was against the trend, and had nothing to do with CO2.
Almost the entire US was over 90F on June 21, 1988, and much was over 100F. It was completely unprecedented.
The heat during Hansen’s testimony shows zero correlation with CO2.
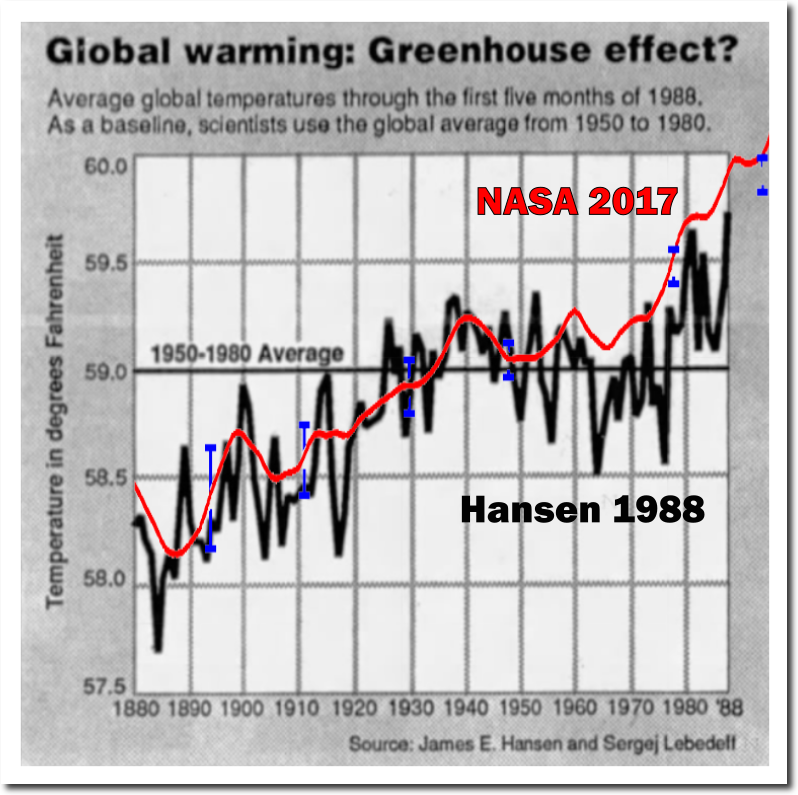
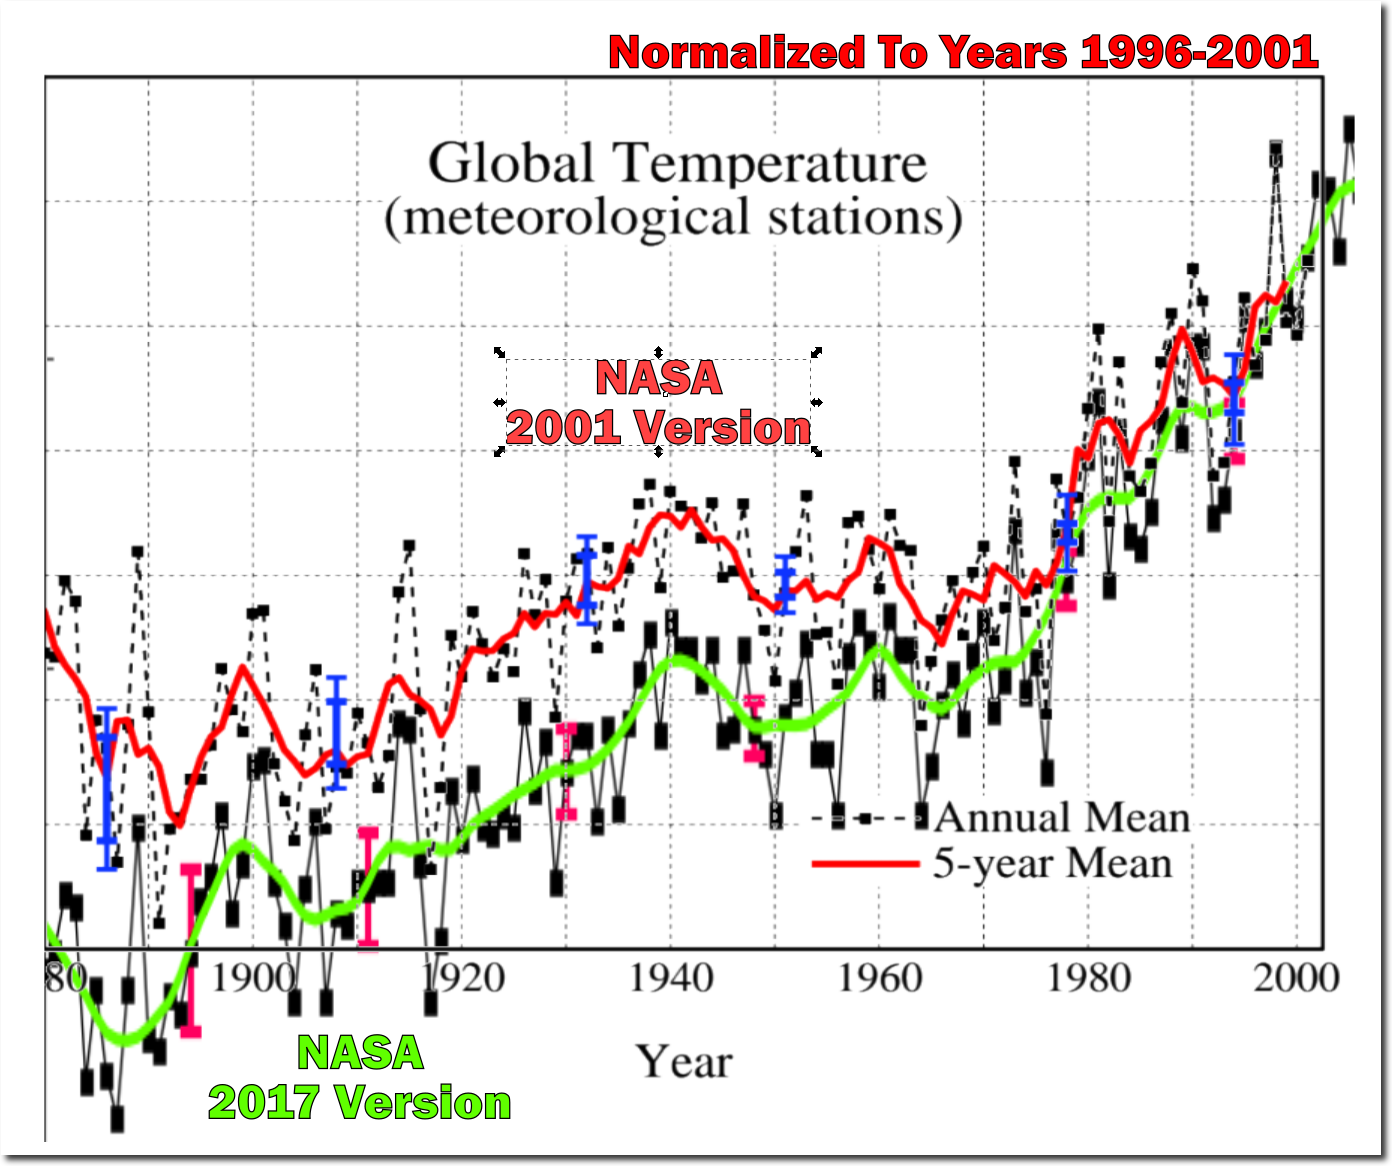
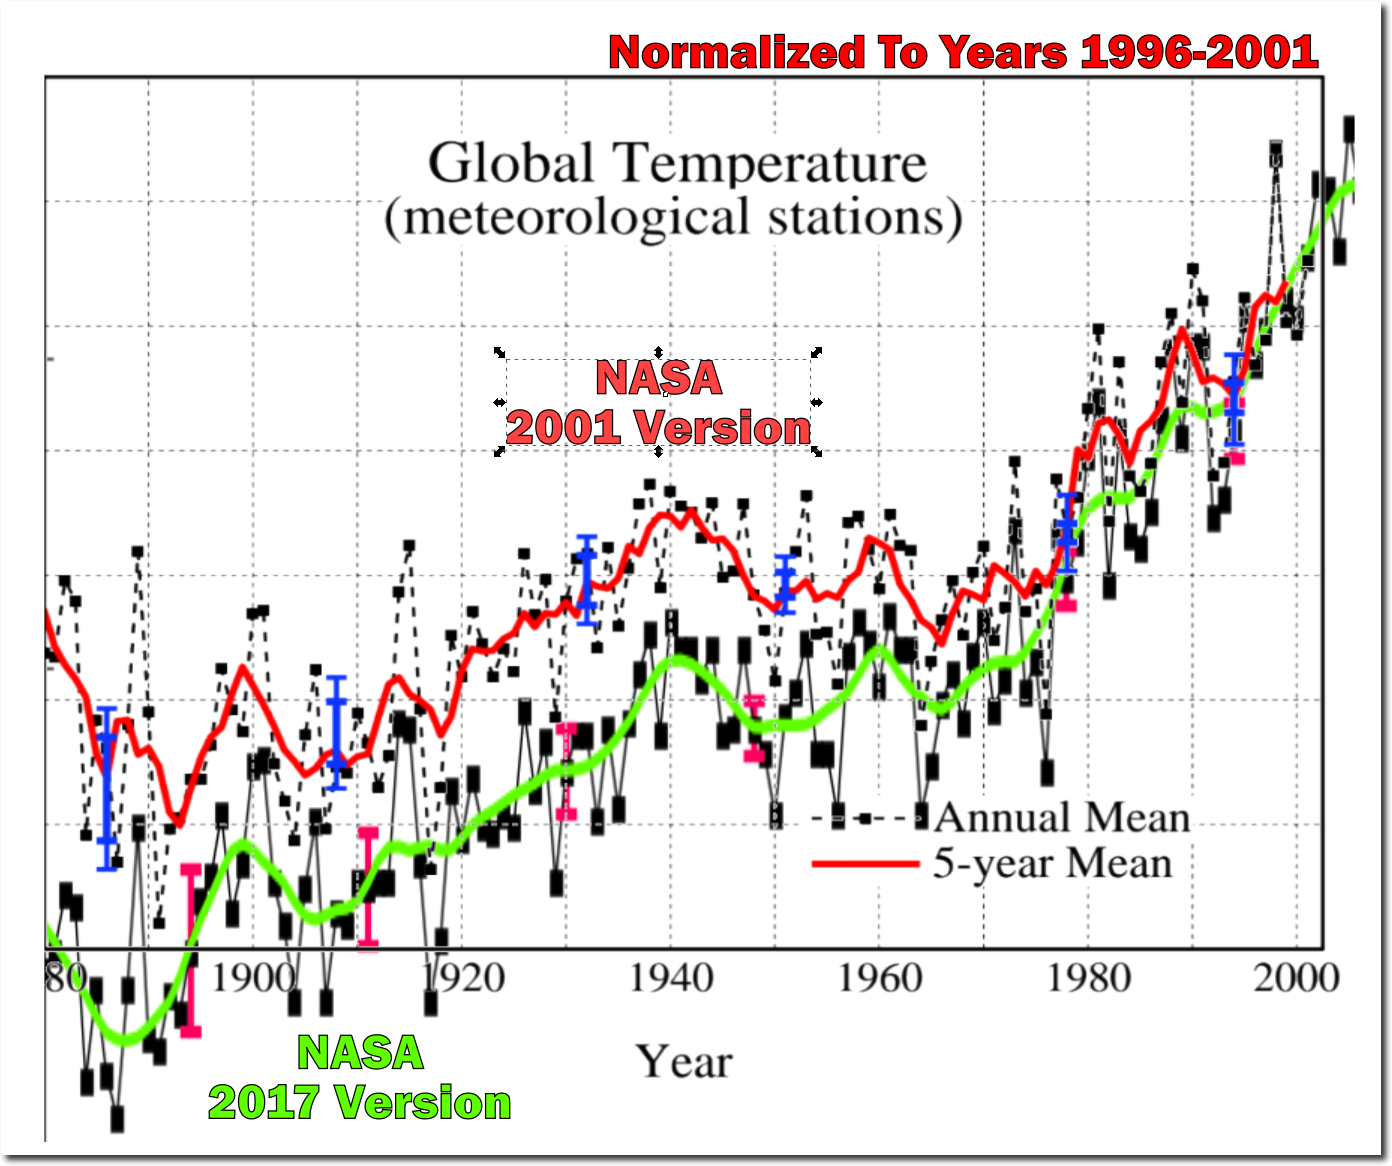
As is almost always the case with prominent climate scientists, there is zero science behind their claims, and they are simply committing fraud to obtain money and attention. But the fraud didn’t stop there. NASA has continued to tamper with historical temperature data, to erase the 1940’s to 1970’s cooling and increase all recent temperatures.
Posted in Uncategorized
Leave a comment
Putting The Heat In Perspective
Tempe, Arizona is forecast to reach 117F today.
During 1936, 117F temperatures were common from Texas to North Dakota. South Dakota was over 120F. North Dakota was over 119F. Nebraska was 118F. Iowa was 117F. Missouri was 118F. Oklahoma was 120F. Texas was 119F. Arkansas was 117F.
People who blame the current heat in Arizona on CO2 are crooks, idiots, liars and frauds.
Posted in Uncategorized
Leave a comment
Fake News – All The Time
The press and pollsters lie every single election, yet some people continue to pay attention to them. Why?
Posted in Uncategorized
Leave a comment