
On election night, The New York Times said Hillary had an 85% chance of winning. They also say they want to ban fake news.

2016 Election Forecast: Who Will Be President? – The New York Times
On election night, The New York Times said Hillary had an 85% chance of winning. They also say they want to ban fake news.
2016 Election Forecast: Who Will Be President? – The New York Times
I’ve already had the pleasure of taking down one fake climate news article from Brian Kahn today, and he has returned for round two – claiming that Antarctica is heating up and melting down, due to “carbon pollution.” He says it could raise sea level ten feet.
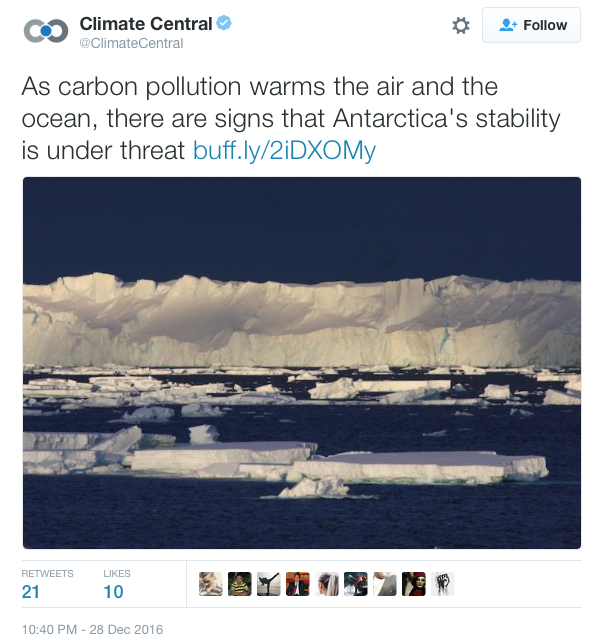
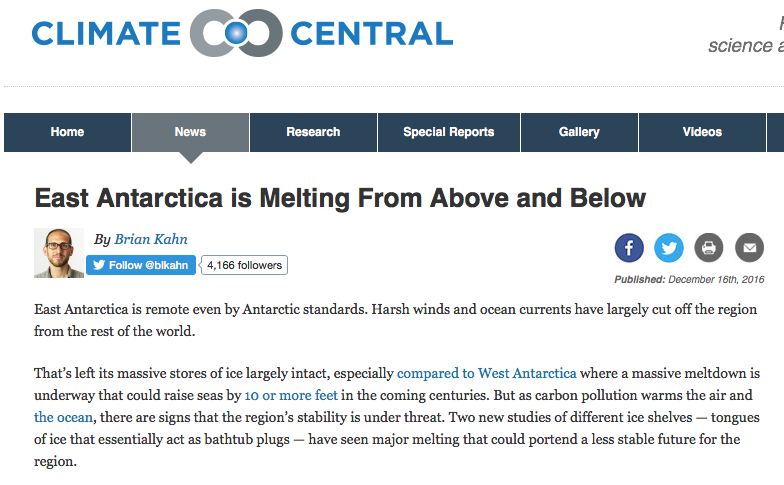
East Antarctica is Melting From Above and Below | Climate Central
Only problem is, the article is fake news. NASA’s top climate expert said in 2004 that Antarctica had cooled significantly in recent decades.
Pubs.GISS: Abstract of Shindell and Schmidt 2004
Satellites show that Antarctica has been cooling for almost 40 years.
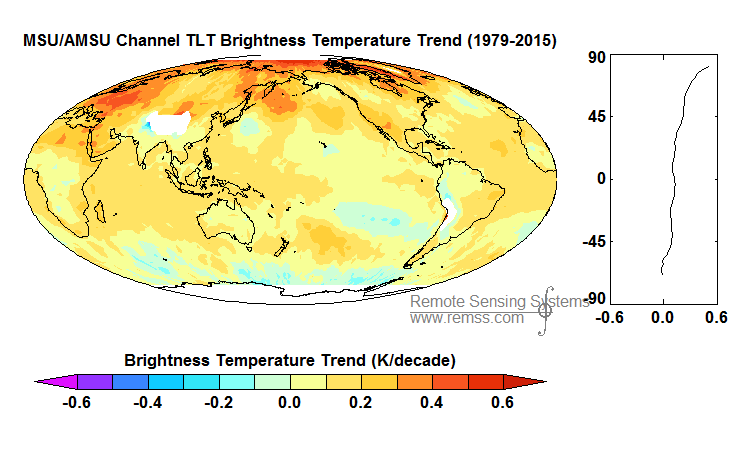
RSS / MSU Data Images / Monthly
NASA says Antarctica is gaining ice.
NASA Study: Mass Gains of Antarctic Ice Sheet Greater than Losses | NASA
West Antarctica has been losing ice for centuries. The Ross Ice Shelf retreated 30 miles before 1932.
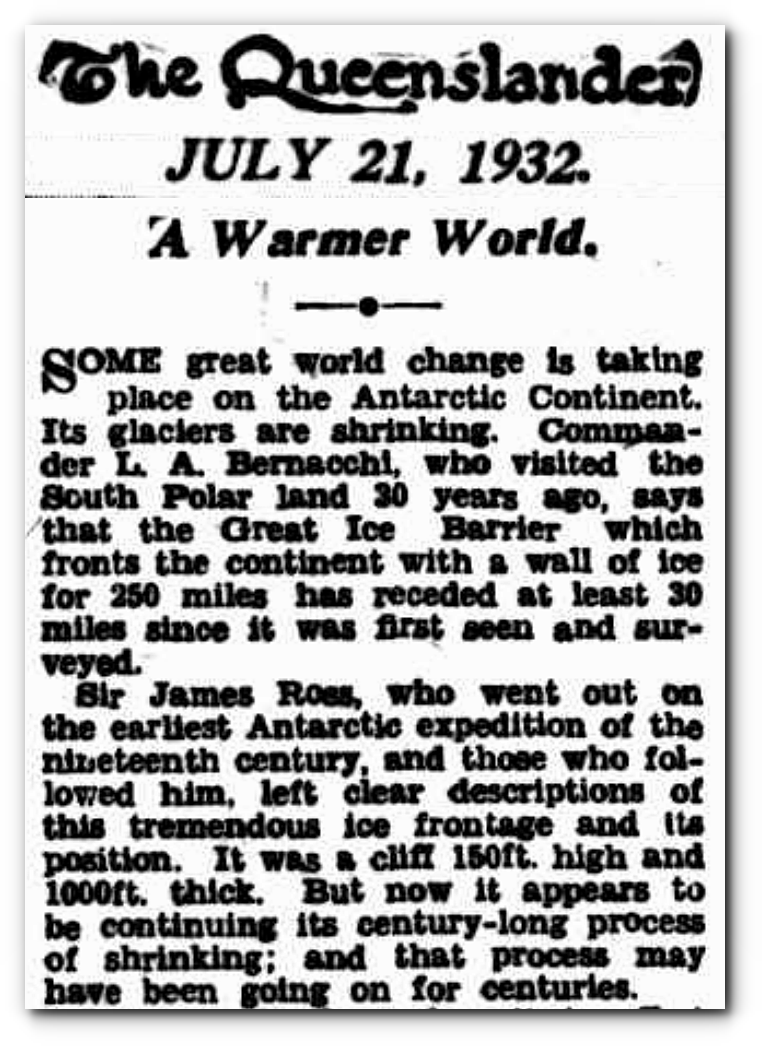
21 Jul 1932 – A Warmer World. – Trove
During the global cooling scare 40 years ago, the National Science Foundation program manager for glaciology (Richard Cameron) said :
We’re seeing the west ice sheet on its way out. …. It has nothing to do with climate, just the dynamics of unstable ice.
Experts warned of 20 feet of sea level rise.
23 Jan 1977, Page 13 – Independent Press-Telegram at Newspapers.com
In summary, Antarctica is cooling and gaining ice. The loss of ice in West Antarctica has been going on for centuries, and “has nothing to do with climate.“
Brian Kahn propagates misinformation out of context, draws unsupportable conclusions from it, and boldly passes his nonsense on to the public.
An appeaser is one who feeds a crocodile, hoping it will eat him last.
- Winston Churchill
European countries believe that throwing Israel to the wolves will save them. They have a rather poor track record with appeasement.
On December 21, Peter Hannam and the Sydney Morning Herald printed some spectacular misinformation about the climate.

Weird weather 2016: Year of melting ice, monster storms and Australia’s big wet
Since he wrote that article one week ago, Arctic sea ice has grown 500,000 km² and is very close to where it has been in all recent years. Arctic sea ice has grown rapidly and is 250% of what it was three months ago. There is no absolutely way of knowing what extent will be at its peak in three months, and anyone who claims they know is a fraud.

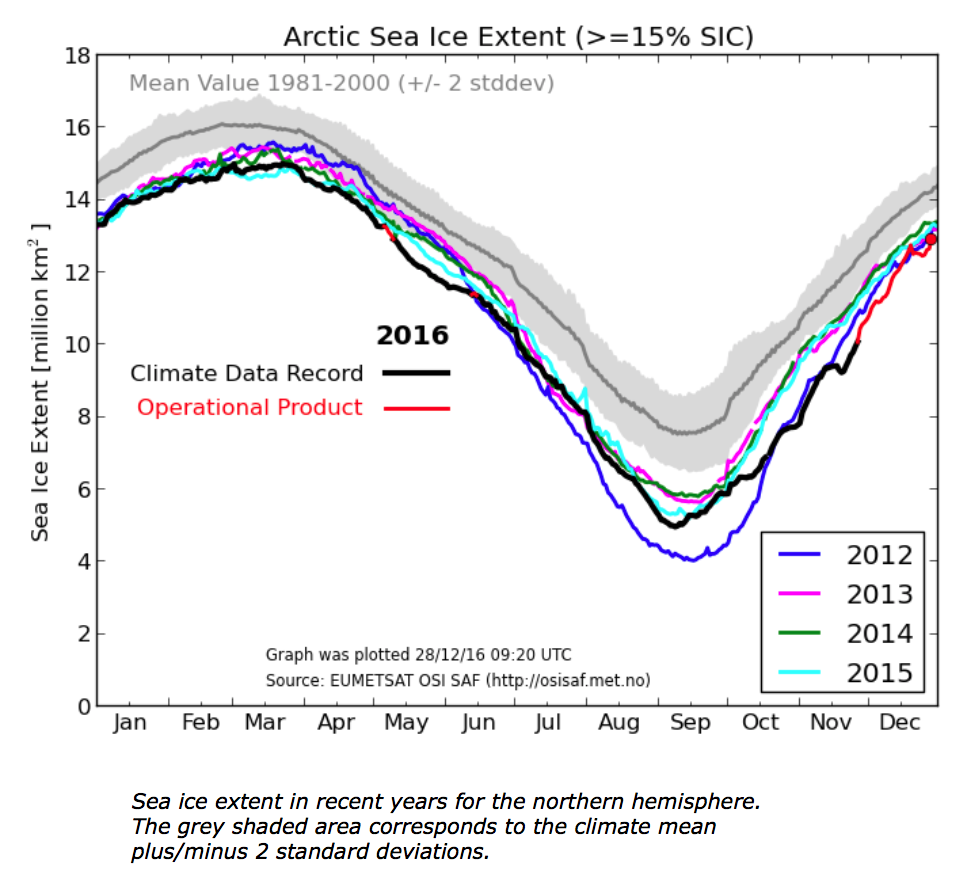
Ocean and Ice Services | Danmarks Meteorologiske Institut
NOAA sea ice satellite records go back to 1973, not 1979. This is important because 1979 was right at the peak, and sea ice extent was nearly two million km² lower in 1974. Ignoring the years before 1979 is extremely dishonest.
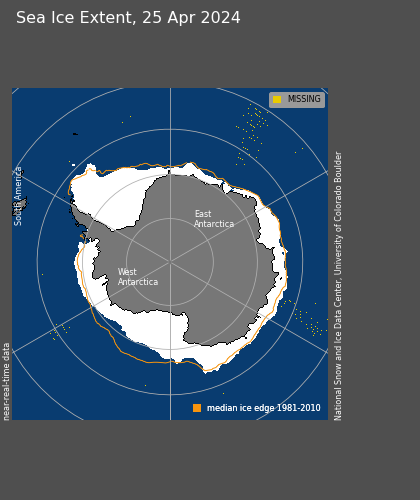
As far as Hannam’s claims about Antarctica go, they are equally as wrong. Satellites showed that Antarctic sea ice was nearly gone in January, 1976 – much less than the amount of ice currently in Antarctica. (Again note the pre-1979 satellite imagery, disproving Hannam’s claim the satellite record began in 1979.)

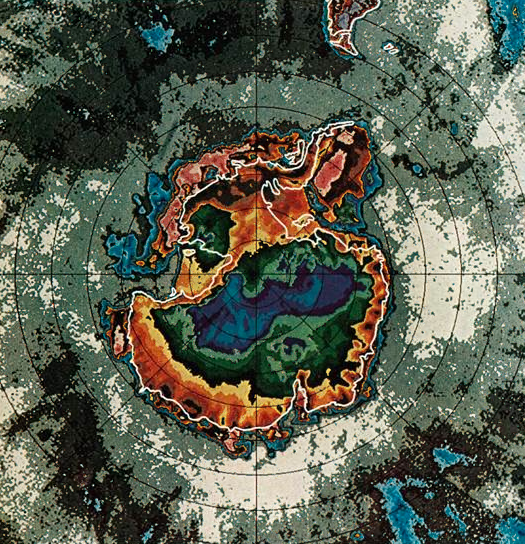
National Geographic : 1976 Nov, Page 578
Around most of Antarctica, sea ice extent is normal or above normal. The only deficiency is in the Weddell Sea.
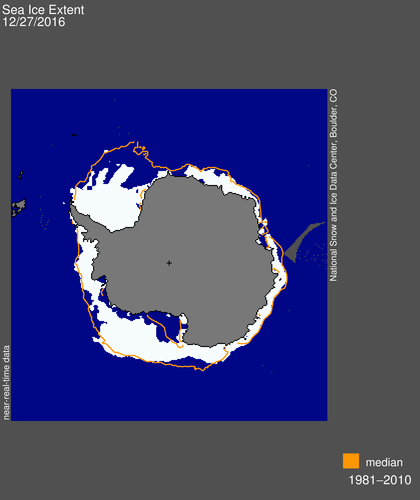
?nsidc.org/data/seaice_index/images/daily_images/S_daily_extent.png
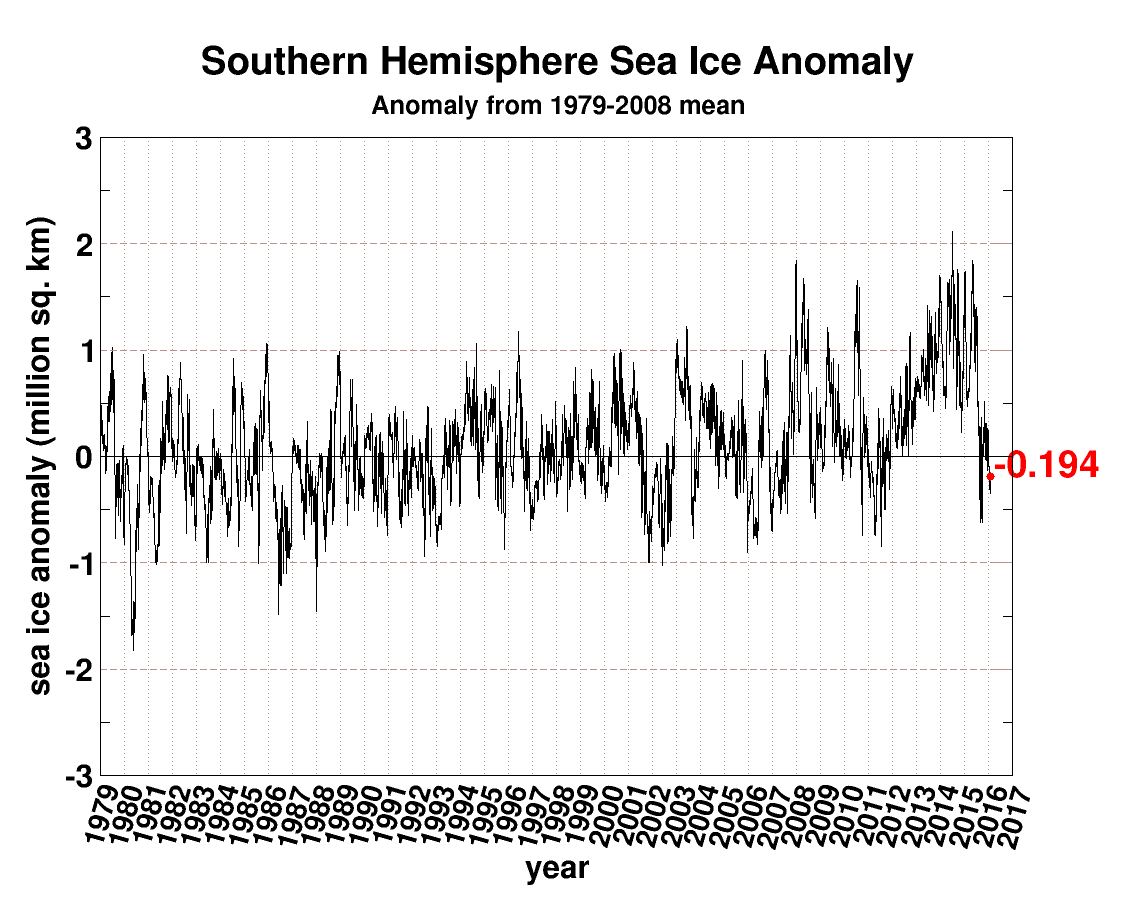
Antarctic sea ice has been growing for decades, and was recently at a record high. This year is an outlier, not a trend.
As far as the wet weather in southeast Australia goes, nine years ago The Sydney Morning herald said southeast Australia was in a permanent drought. They have no clue what they are talking about.
This drought may never break – Environment – smh.com.au
Australia has always had alternating droughts and floods.

13 Oct 1868 – THE CLIMATE OF AUSTRALIA
Journalists have been blaming white men for climate change in Australia for 170 years.
11 Mar 1846 – ON THE CHANGE OF CLIMATE. – Trove
Australian journalists have been imagining climate change for hundreds of years, and using incorrect statistics for at least 145 years to justify their claims.
IMAGINARY CHANGES OF CLIMATE.
THREE consecutive years of drought, while they have stimulated the inventive resources of practical agriculturists, have had the natural effect of calling forth a plentiful crop of speculation from weather prophets and projectors, and half-instructed meteorologists, and all the philosophic tribe of Laputa in general, to whom the periodical press now affords such fatal facilities. We have often noticed that in the tabular statements of those compilers of weather records who write to the Times, useful and welcome as their communications are, every season is sure to be “extraordinary,” almost every month one of the driest or wettest, or windiest, coldest or hottest, ever known. Much observation, which ought to correct a tendency to exaggerate, seems in some minds to have rather a tendency to increase it.

10 Jan 1871 – IMAGINARY CHANGES OF CLIMATE.
I have examined several Peter Hannam articles about climate, and they are pretty close to 100% incorrect. Peter can kiss the climate scam goodbye on January 20, 2017.
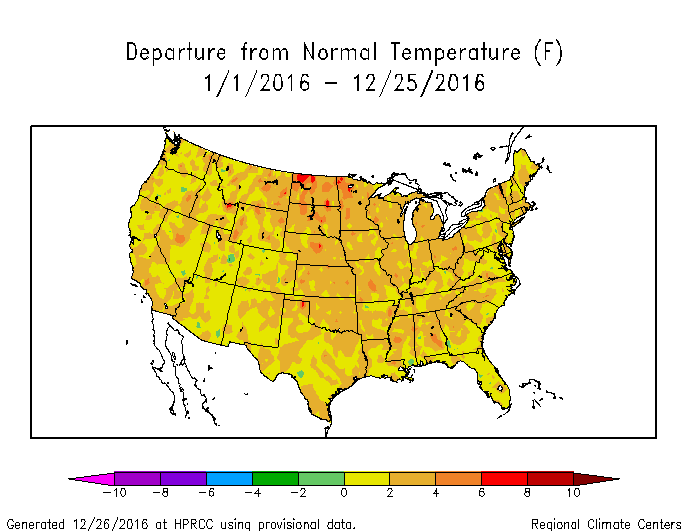
Climate Central just ran this piece, which the Washington Post picked up on. They claimed the US was “overwhelmingly hot” in 2016, and temperatures have risen 1,5°F since the 19th century.
The U.S. Has Been Overwhelmingly Hot This Year | Climate Central
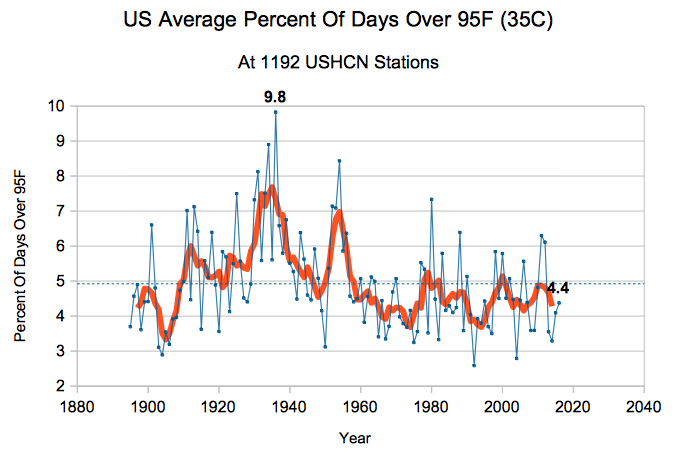
The first problem with their analysis is that the US had very little hot weather in 2016. The percentage of hot days was below average, and ranked 80th since 1895. Only 4.4% of days were over 95°F, compared with the long term average of 4.9%. Climate Central is conflating mild temperatures with hot ones.
They also claim US temperatures rose 1.5°F since the 19th century, which is what NOAA shows.
Climate at a Glance | National Centers for Environmental Information (NCEI)
The problem with the NOAA graph is that it is fake data. NOAA creates the warming trend by altering the data. The NOAA raw data shows no warming over the past century
The adjustments being made are almost exactly 1.5°F, which is the claimed warming in the article.
The adjustments correlate almost perfectly with atmospheric CO2. NOAA is adjusting the data to match global warming theory. This is known as PBEM (Policy Based Evidence Making.)
The hockey stick of adjustments since 1970 is due almost entirely to NOAA fabricating missing station data. In 2016, more than 42% of their monthly station data was missing, so they simply made it up. This is easy to identify because they mark fabricated temperatures with an “E” in their database.
When presented with my claims of fraud, NOAA typically tries to arm wave it away with these two complaints.
Both claims are easily debunked. The only effect that gridding has is to lower temperatures slightly. The trend of gridded data is almost identical to the trend of un-gridded data.
Time of Observation Bias (TOBS) is a real problem, but is very small. TOBS is based on the idea that if you reset a min/max thermometer too close to the afternoon maximum, you will double count warm temperatures (and vice-versa if thermometer is reset in the morning.) Their claim is that during the hot 1930’s most stations reset their thermometers in the afternoon.
This is easy to test by using only the stations which did not reset their thermometers in the afternoon during the 1930’s. The pattern is almost identical to that of all stations. No warming over the past century. Note that the graph below tends to show too much warming due to morning TOBS.
NOAA’s own documents show that the TOBS adjustment is small (0.3°F) and goes flat after 1990.
https://www.ncdc.noaa.gov/img/climate/research/ushcn/ts.ushcn_anom25_diffs_pg.gif
Gavin Schmidt at NASA explains very clearly why the US temperature record does not need to be adjusted.
You could throw out 50 percent of the station data or more, and you’d get basically the same answers.
One recent innovation is the set up of a climate reference network alongside the current stations so that they can look for potentially serious issues at the large scale – and they haven’t found any yet.
NASA – NASA Climatologist Gavin Schmidt Discusses the Surface Temperature Record
NOAA has always known that the US is not warming.
U.S. Data Since 1895 Fail To Show Warming Trend – NYTimes.com
All of the claims in the Climate Central article are bogus. The US is not warming and 2016 was not a hot year in the US. It was a very mild year.
The Washington Post Capital Weather Gang has yet another wildly misleading climate article out again today.
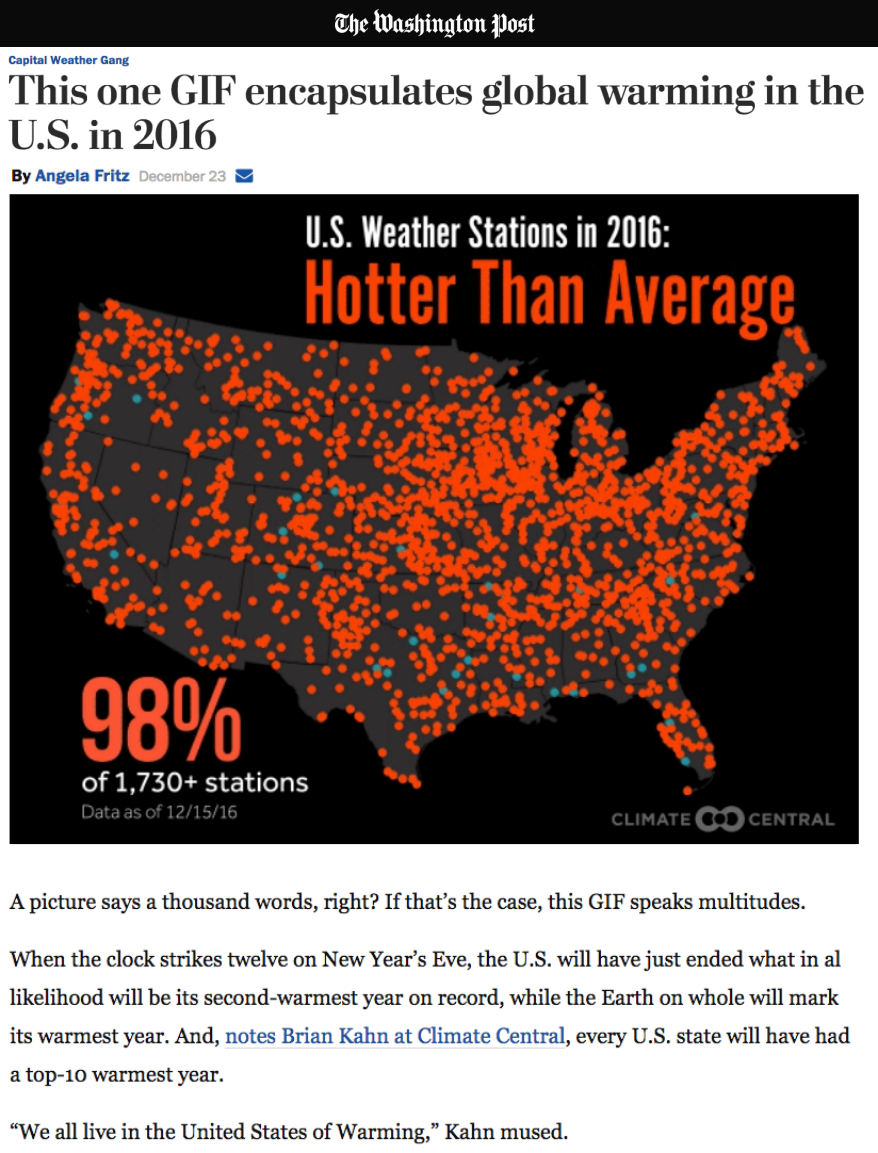
This one GIF encapsulates global warming in the U.S. in 2016 – The Washington Post
2016 was not a hot year in the US. The number of hot days was below average, and ranked 80th hottest since 1895. Only 4.4% of days were over 95F (35C) – compared to 9.8% in 1936.
Relying on “one GIF” of one year in the US to “encapsulate global warming” is utter nonsense. It was an El Nino year, which brings warm weather to the US. The entire country averaged above normal.
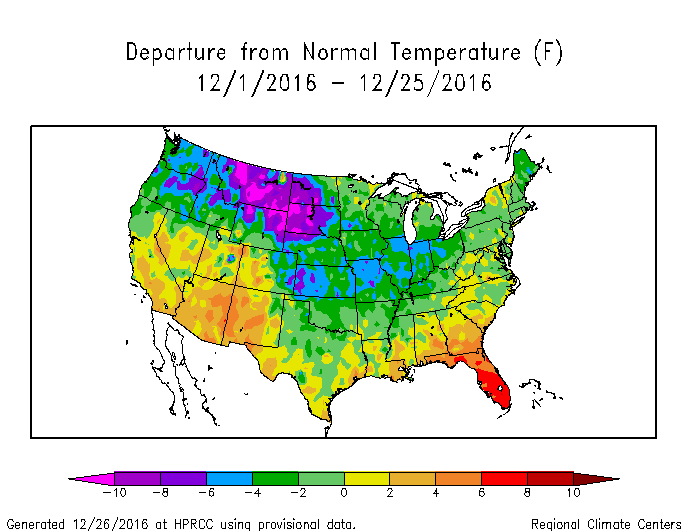
The year is finishing with a near record cold December in much of the US.
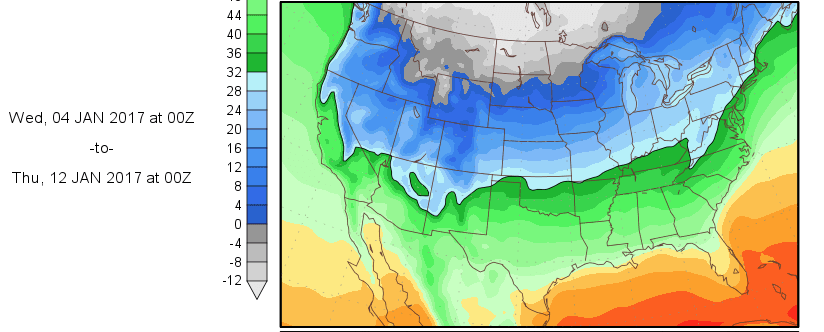
Next year is looking even colder.
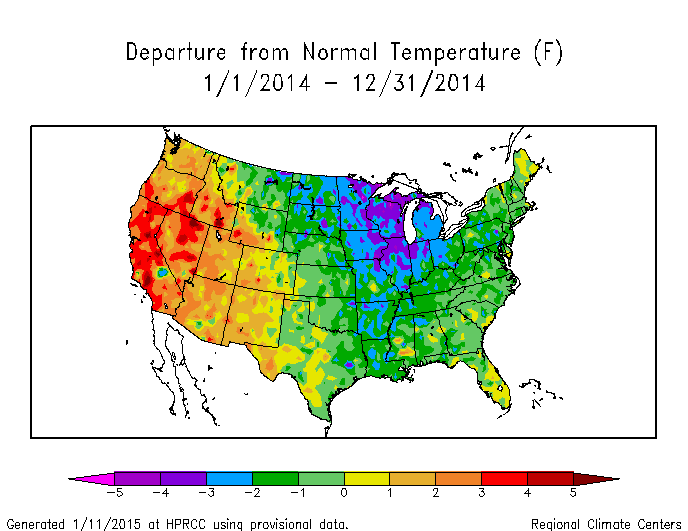
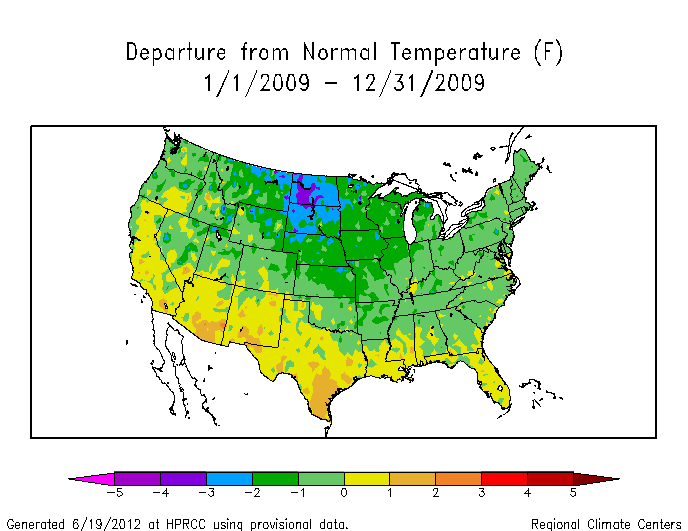
During cold years like 2014 and 2009, they say “the US is only 2% of the planet.” But during warm years the US proves global warming.
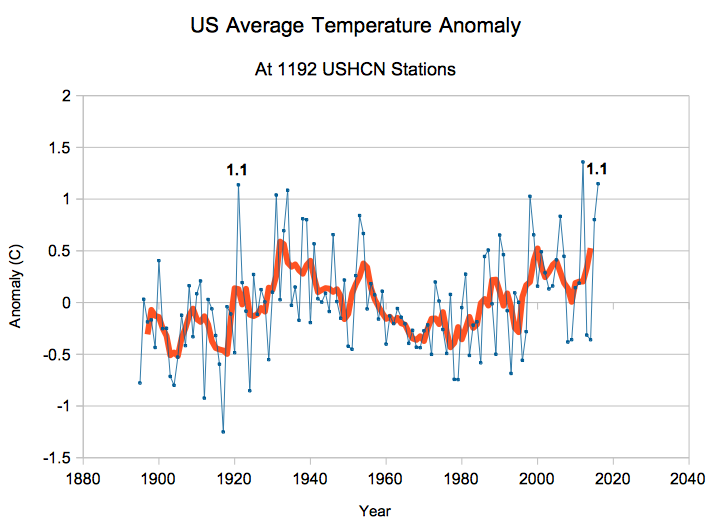
The raw thermometer data shows that the US is no warmer than the 1930’s. 2016 is tied with 1921 as second warmest.
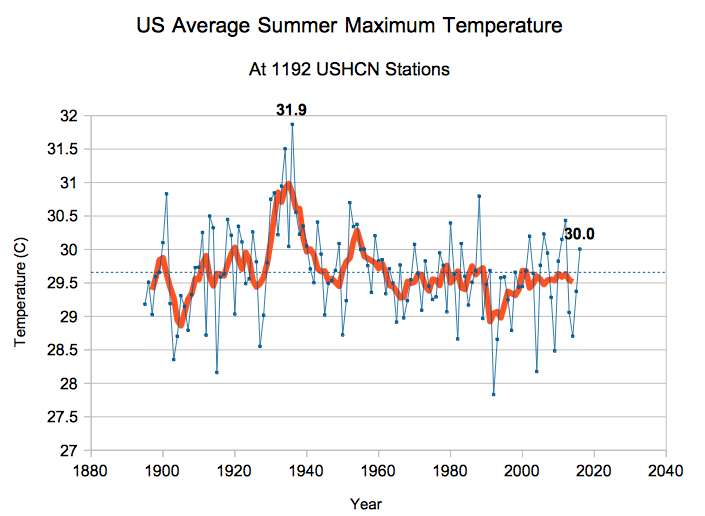
Maximum temperatures show a cooling trend since the 1930’s.
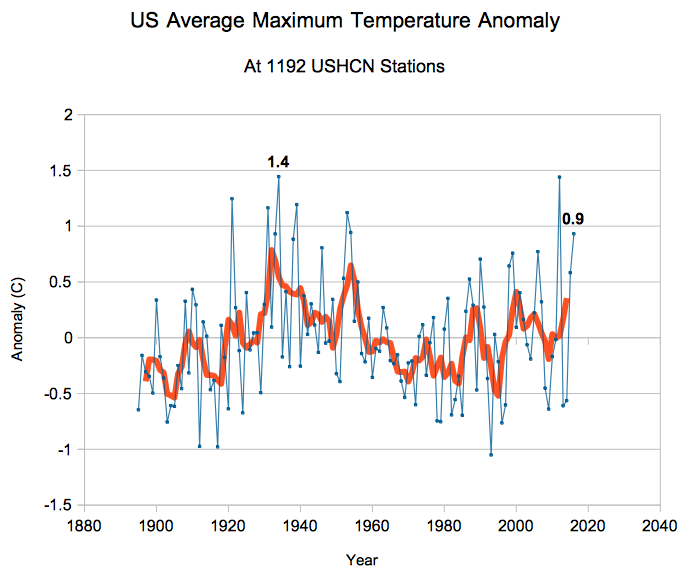
Summer maximum temperatures plummeted in the US from the 1930’s to the 1950’s, and never recovered. Summer 2016 was not a hot summer in the US.
 The “one GIF” used by the Washington Post tells us nothing about climate. All it tells us is that El Nino brought a very mild year to the US, with a record low number of tornadoes and the longest stretch on record without a major hurricane.
All hope is gone!
Hope is our secret weapon!


Progressive thinking is form of a mental illness, closely associated with bi-coastal disorder.
Not wanting to be beaten out by the fake news Washington Post, fake news CTV says the Arctic is having a “major heat wave”
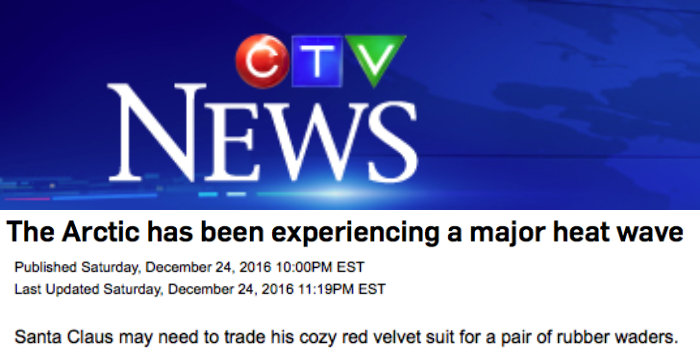
The Arctic has been experiencing a major heat wave | CTV News
I’m not sure which Canada they are from, because the Canadian Arctic is extremely cold.
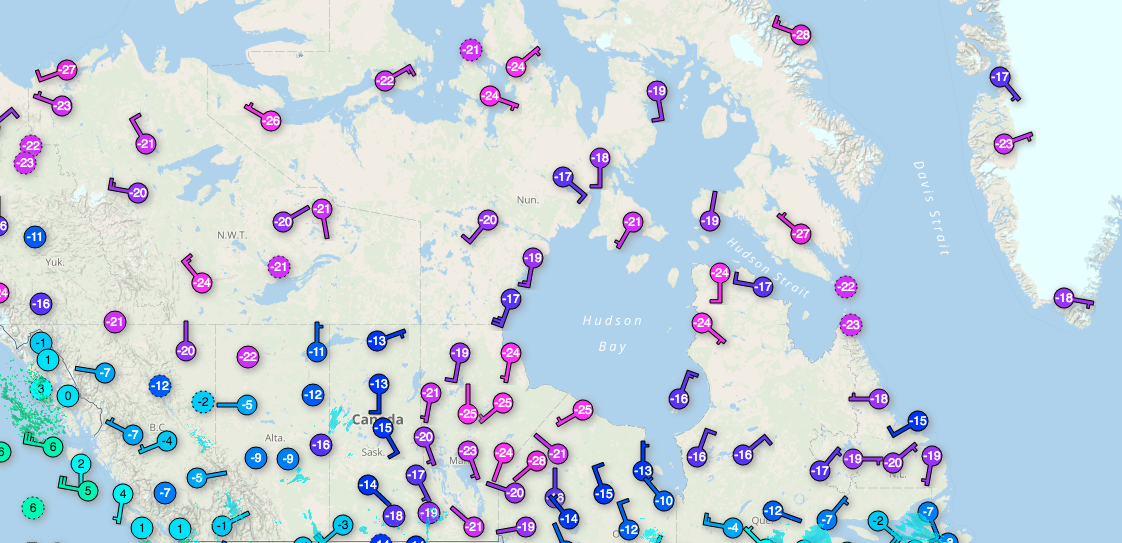
Everything is frozen solid from Arizona to India.
https://www.esrl.noaa.gov/psd/map/images/fnl/sfctmp_01.fnl.gif
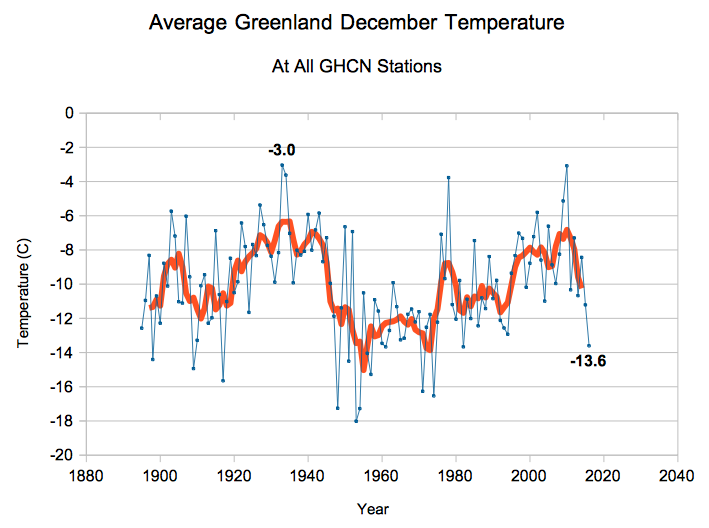
Greenland is having their coldest December since 1982. Greenland temperatures are almost 20F colder this month than 1932.
Greenland has gained a record amount of ice this autumn/winter, by a wide margin.
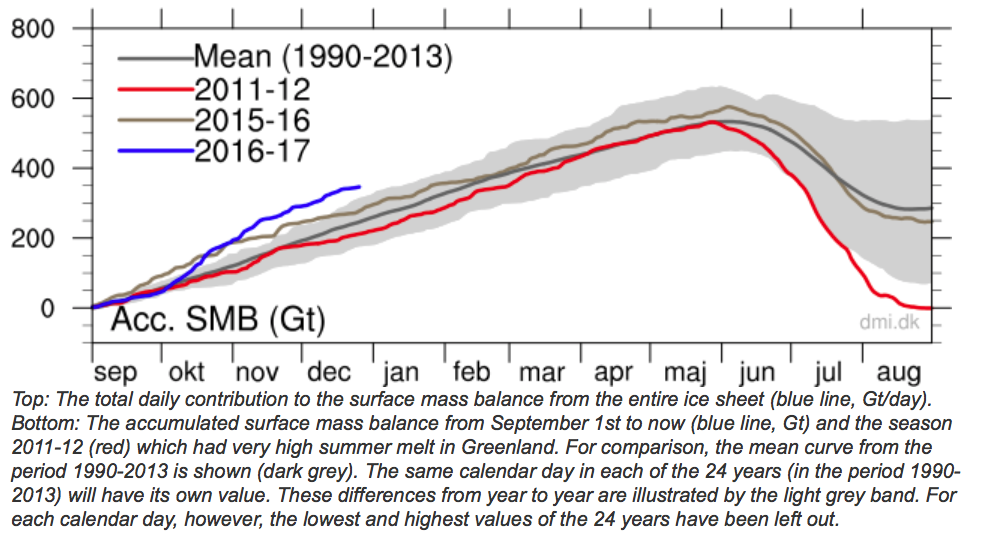
Greenland Ice Sheet Surface Mass Budget: DMI
Melt on Greenland was below normal almost every day this summer.
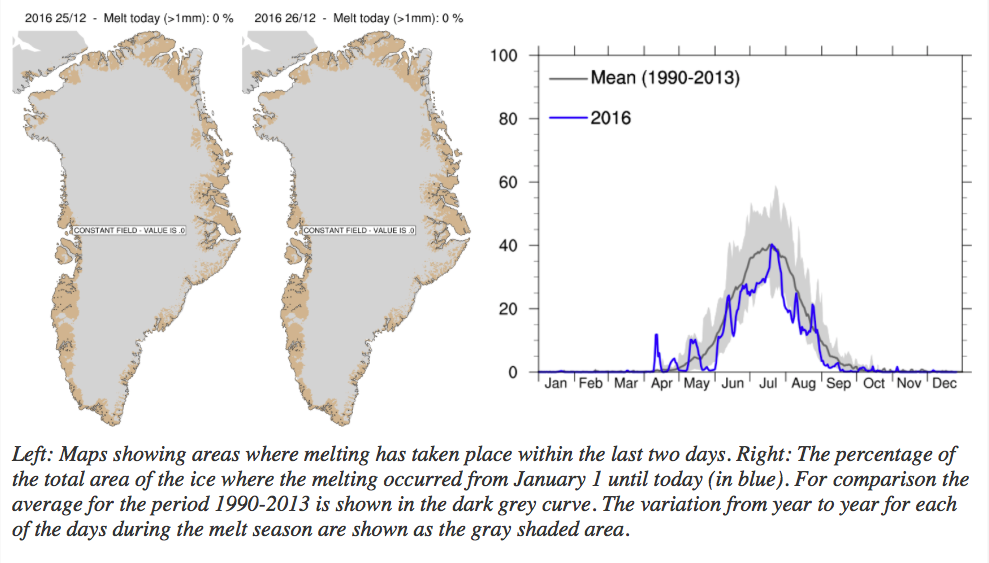
Greenland Ice Sheet Surface Mass Budget: DMI
The official government fake news sources are ramping up the fraud ahead of January 20, 2017 – when their scam ends.


