The White House says that global warming is increasing heatwaves and killing people.
Increasing concentrations of greenhouse gases lead to an increase of both average and extreme temperatures. This is expected to lead to an increase in deaths and illness from heat
Obama probably should have asked his EPA – who say the exact opposite. Heatwaves are way down from the 1930’s. Hardly anybody dies in the US from heatwaves any more.
The White House simply makes facts up, in order to scare people into following their political agenda. It has nothing to do with climate science, or acceptable human values.
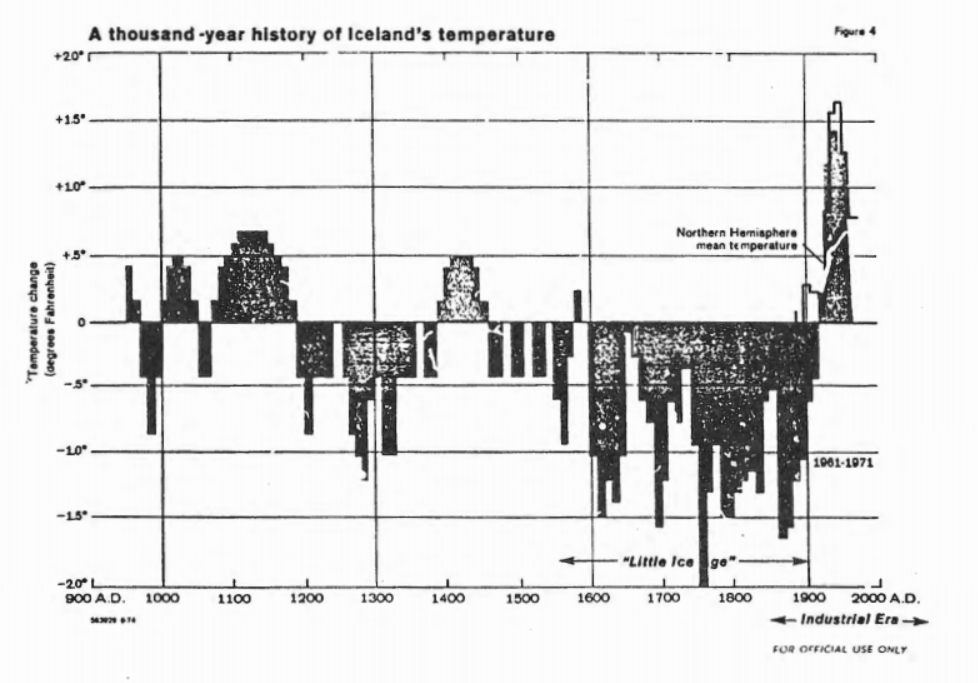
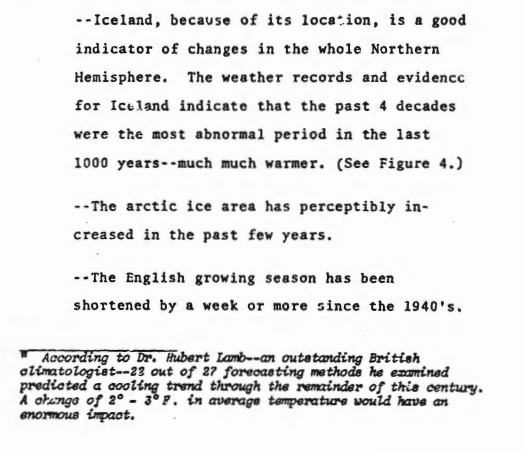
This didn’t suit Obama White House political requirements, so NOAA and NASA altered the data a few years ago to make the 1940’s warmth in Iceland disappear.
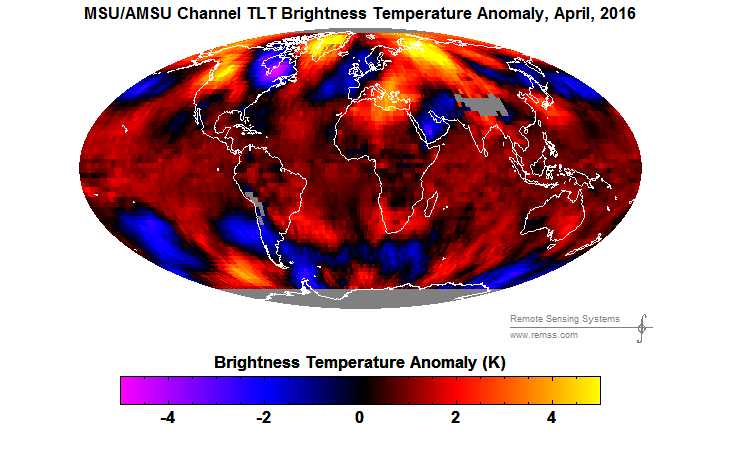
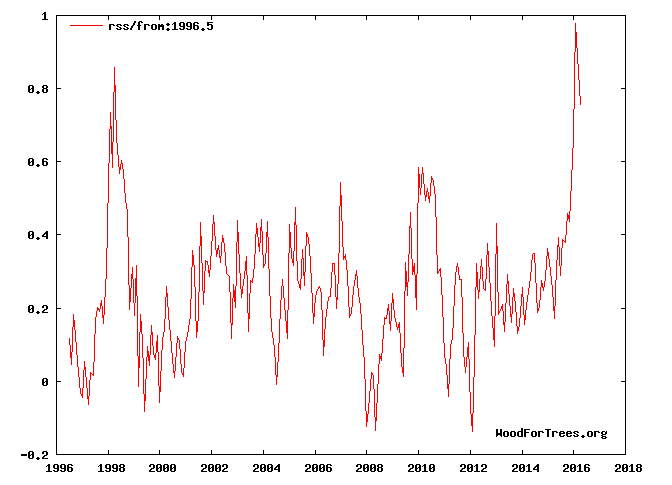
The lower troposphere is still warm from the El Nino.
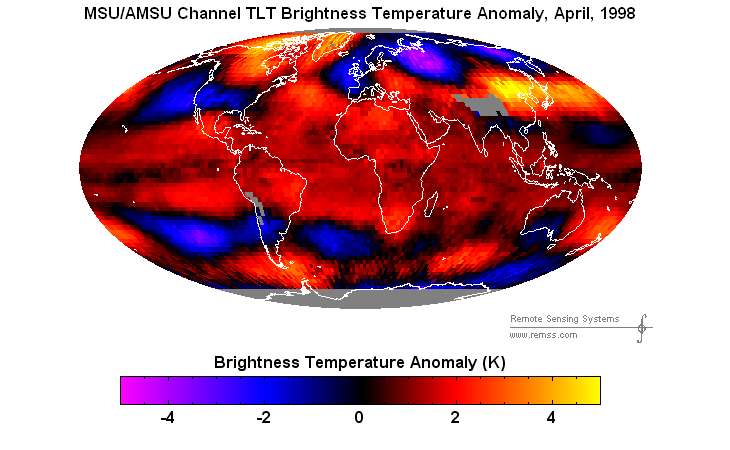
But not as warm as it was in April 1998, when CO2 was much lower.
From April to November 1998, troposphere temperatures plummeted, as seen in this animation.
It appears we may be doing a repeat of 1998. But I am not a forecaster, and climate experts say that CO2 is the thermostat control knob. So temperatures can only go up.
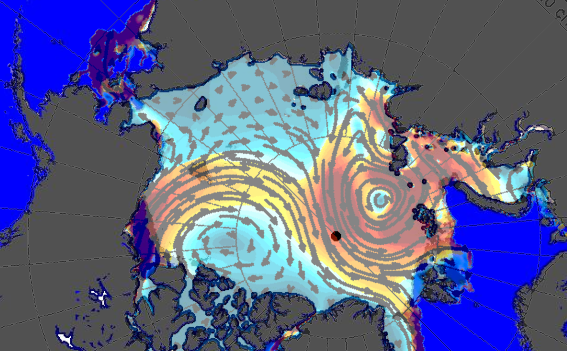
Alarmists are currently hysterical about ice melting in the Beaufort Sea. Only problem is that it isn’t melting. A high pressure system created winds which blew the ice offshore – but facts don’t matter to alarmists.
The satellite animation shows what happened. Note that the satellites are pretty messed up right now, and the images are losing some colors – but it is still easy to see what happened to the ice.
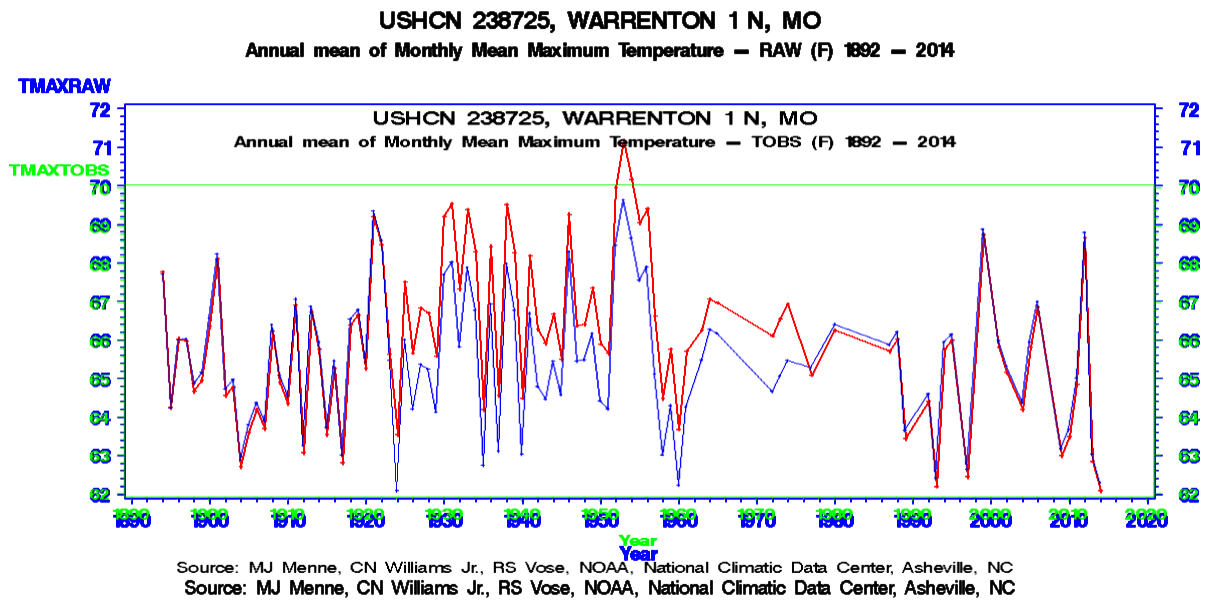
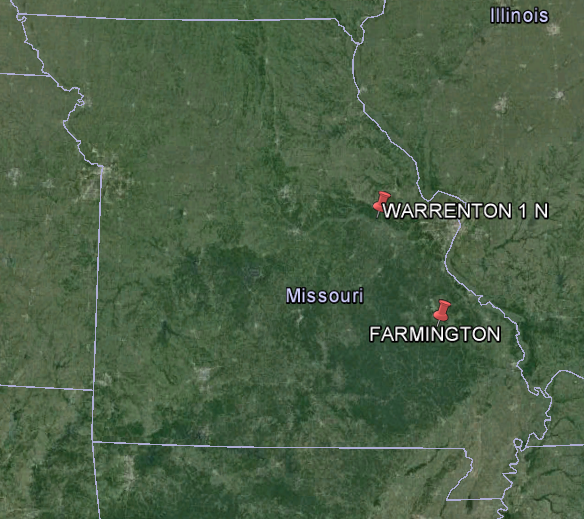
The USHCN Time Of Observation BIAS (TOBS) adjustment is based on the idea that thermometers reset in the afternoon tend to double count hot days and thus produce a warm bias. For example, Warrenton, MO reset their thermometer at 5PM from 1923 to 1976, so NOAA deducted about 1.5 degrees to compensate.
This theory is easy to test by comparing vs. a nearby morning station. According to theory, the morning station should be cooler. Farmington, MO is close to Warrenton and reset their thermometer at 7 AM from 1931 to 1950, so they should be cooler than Warrenton during that period.
The theory doesn’t work. Farmington summer maximum temperatures (red below) are nearly identical to Warrenton temperatures (blue below.) Only exception is 1935, which is missing data at Warrenton.
Likewise, the number of hot afternoons is nearly identical at the two stations – again Farmington in red and Warrenton in blue. If double counting was occurring, Warrenton would have more hot afternoons than Farmington during the 1930’s – but it doesn’t.
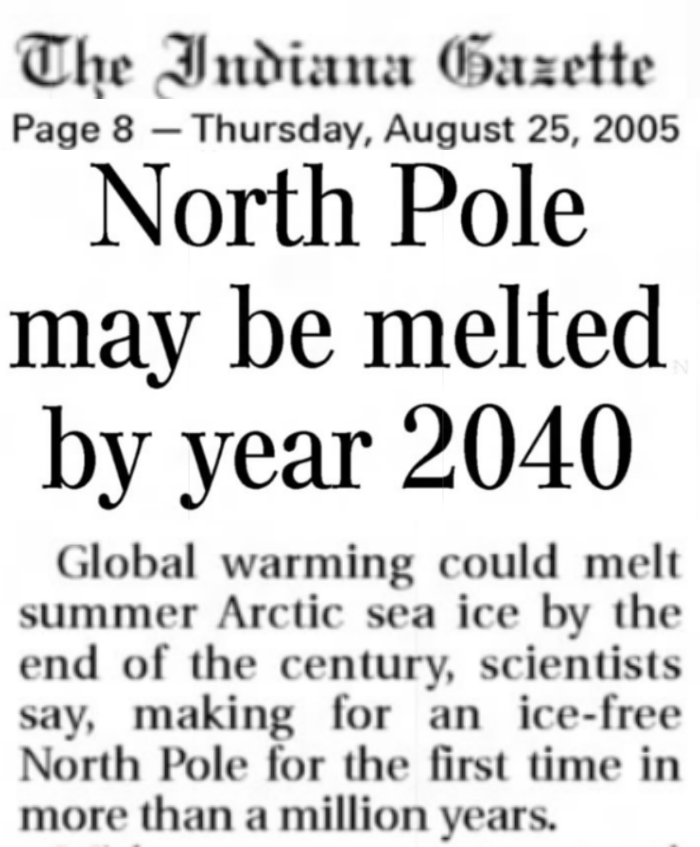
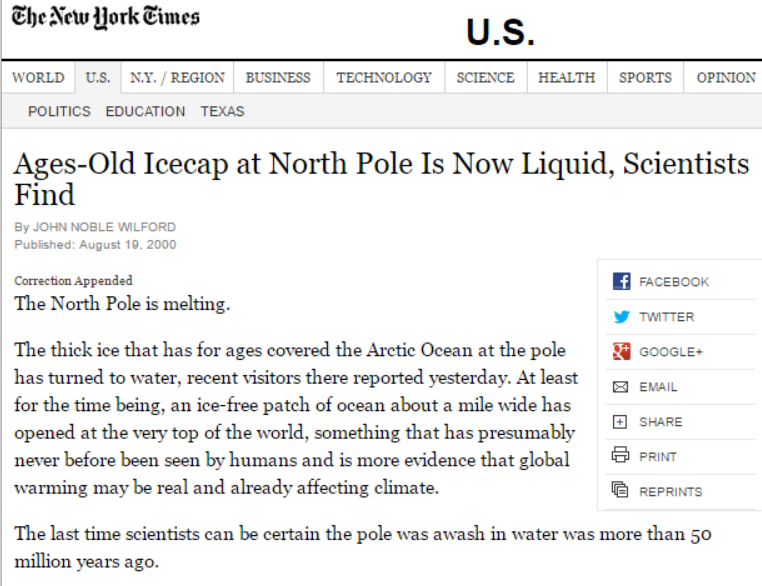
In 2005, our crack scientists Hillary and John announced that the North Pole will be ice-free by the end of the century “for the first time in more than a million years.”
This is surprising, because the New York Times announced at the end of the 20th century, that the North Pole had already melted for the first time in more than 50 million years.
Scientists further clarified by explaining that 50 million years ago was actually only 5,000 years ago.
“Examination of several proxy records (e.g., sediment cores) of sea ice indicate ice-free or near ice-free summer conditions for at least some time during the period of 15,000 to 5,000 years ago”
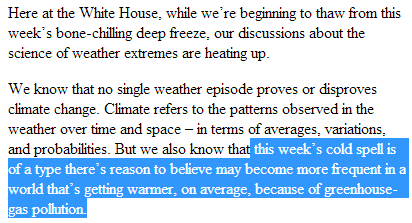
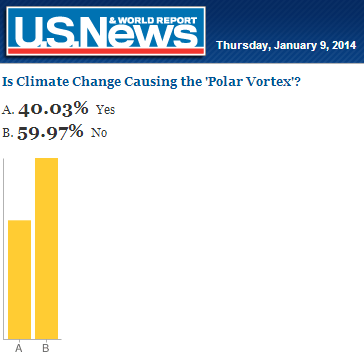
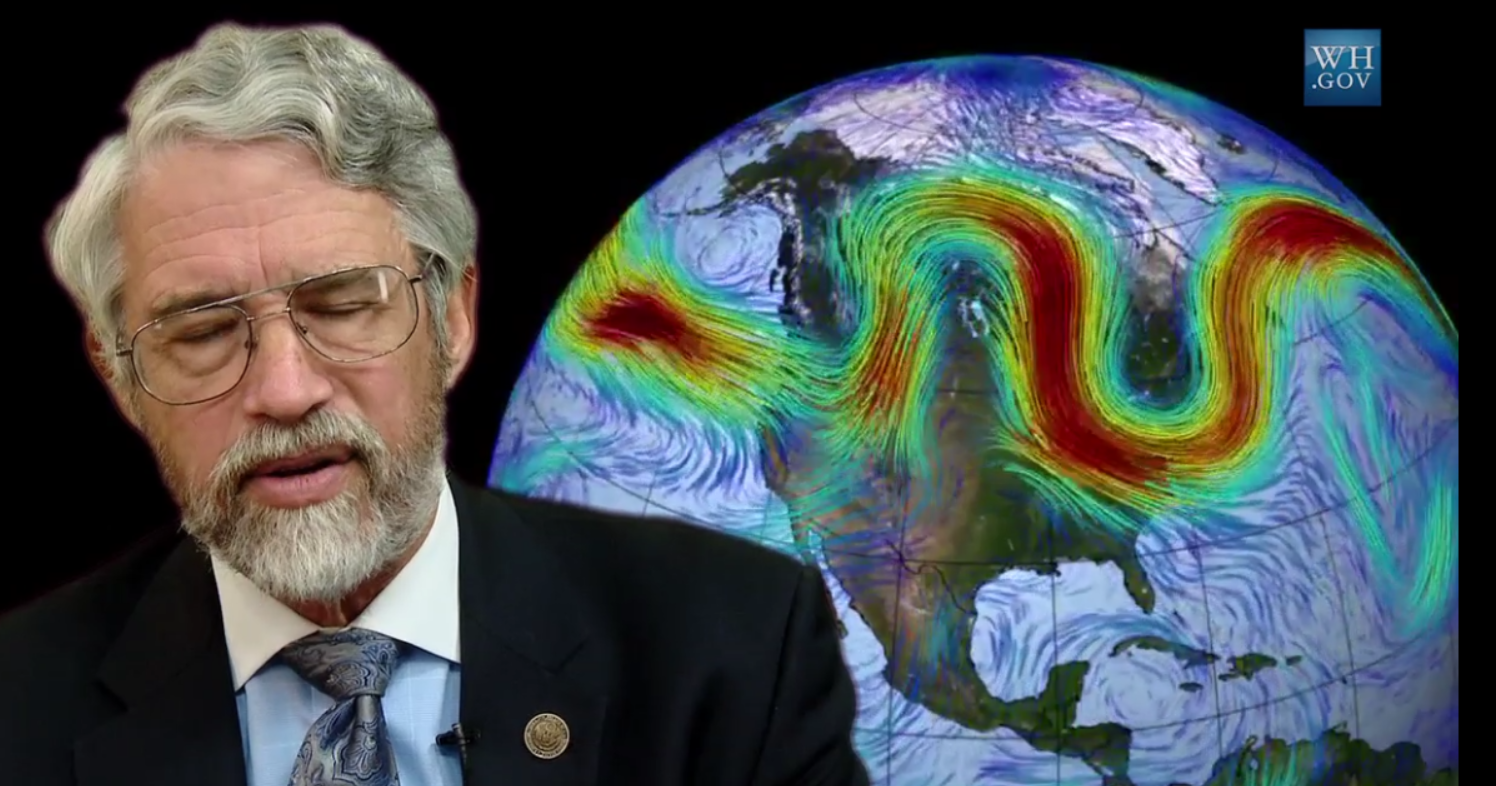
The winter of 2011-2012 was warm in the US. Climate alarmists blamed it on global warming, and said it was the new normal. So during the cold winter of 2013-2014 the White House had to come up with some new BS, and claimed that a warming Arctic and shrinking ice cap were the cause of the cold.
Two days later, they had fooled 40% of the public.
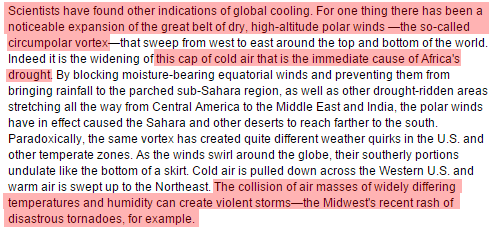
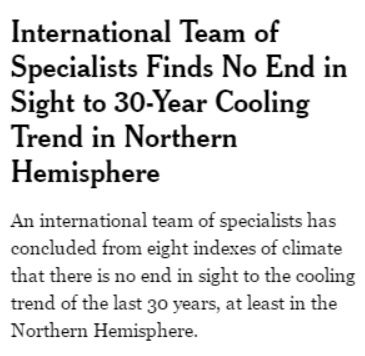
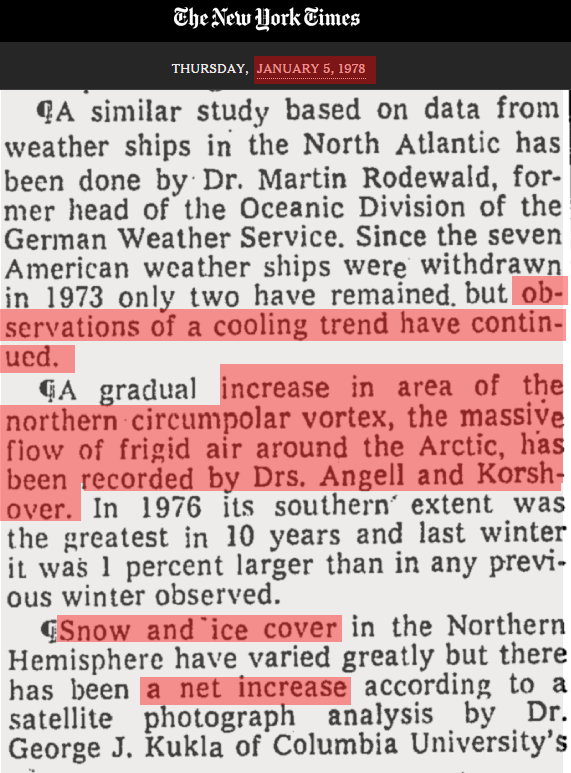
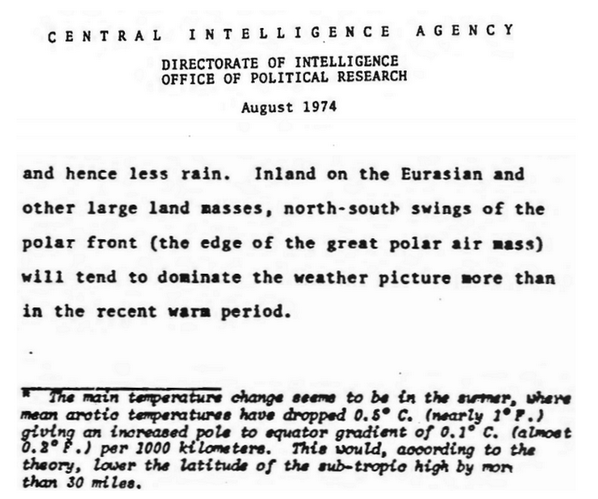
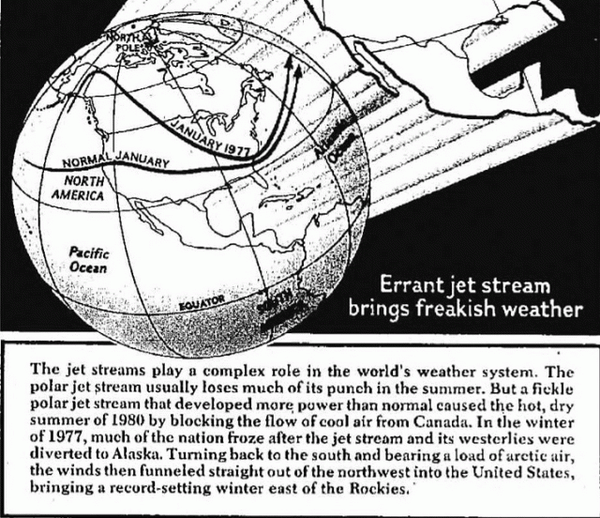
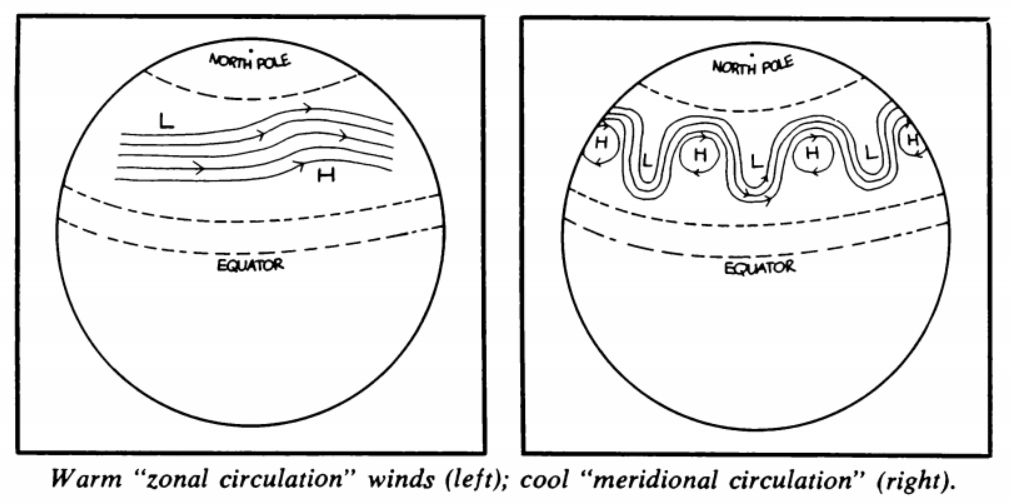
This is the exact opposite of what scientists said 40 years ago, when they blamed the same weather pattern on a cooling Arctic and an expanding Arctic ice cap.
Compare that picture with Holdren’s picture. Almost identical – except that Holdren blamed Arctic warming and a shrinking ice cap..
CEI is suing the White House over release of the documents behind this fraud, and of course there aren’t any because Holdren just made the whole thing up.
By Stephen Dinan – The Washington Times – Monday, May 9, 2016
The White House showed “bad faith” in how it handled an open records request for global warming data, a federal court ruled Monday, issuing yet another stinging rebuke to the administration for showing a lack of transparency.
For President Obama, who vowed to run the most transparent government in U.S. history, Judge Amit P. Mehta’s ruling granting legal discovery in an open records case — the third time this year a judge has ordered discovery — is an embarrassing black eye.
In this most recent case, the Competitive Enterprise Institute was trying to force the White House office of science and technology policy to release documents backing up Director John C. Holdren’s finding that global warming was making winters colder — a claim disputed by climate scientists.
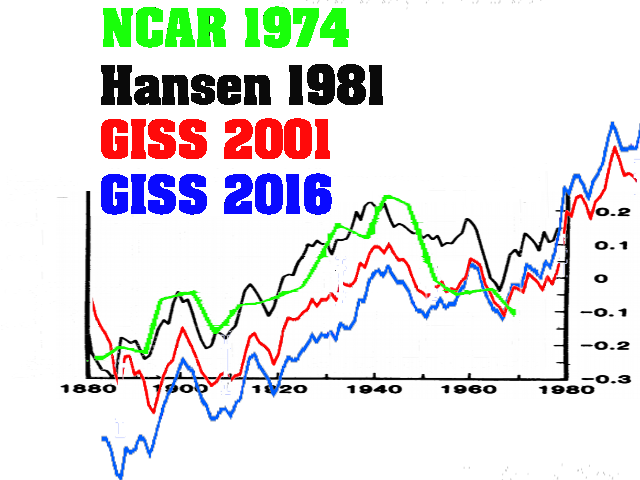
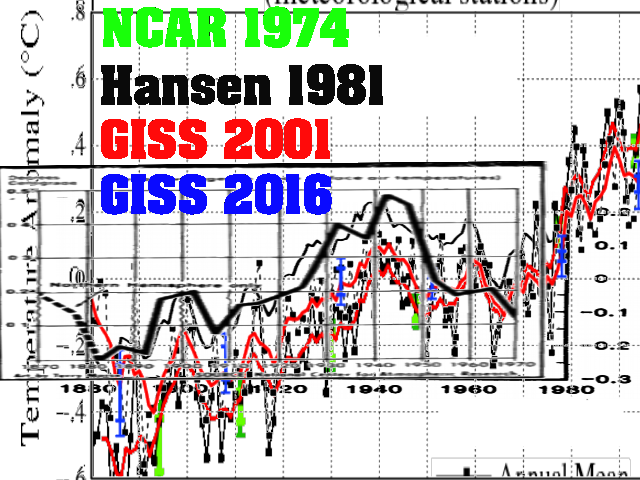
I frequently use overlays like the one below, showing how NASA has successively altered global temperature data to make the 1940’s warmth and the 1940s-1970’s global cooling disappear.
However, when I start, the overlay is not very readable and I do a lot of image processing (chroma keying and color correction) – to make the image more intelligible.
The animation below shows before and after.
I do this using proprietary software I wrote about 10 years ago for a startup I founded in London. I’m thinking about making a simpler version for public release.
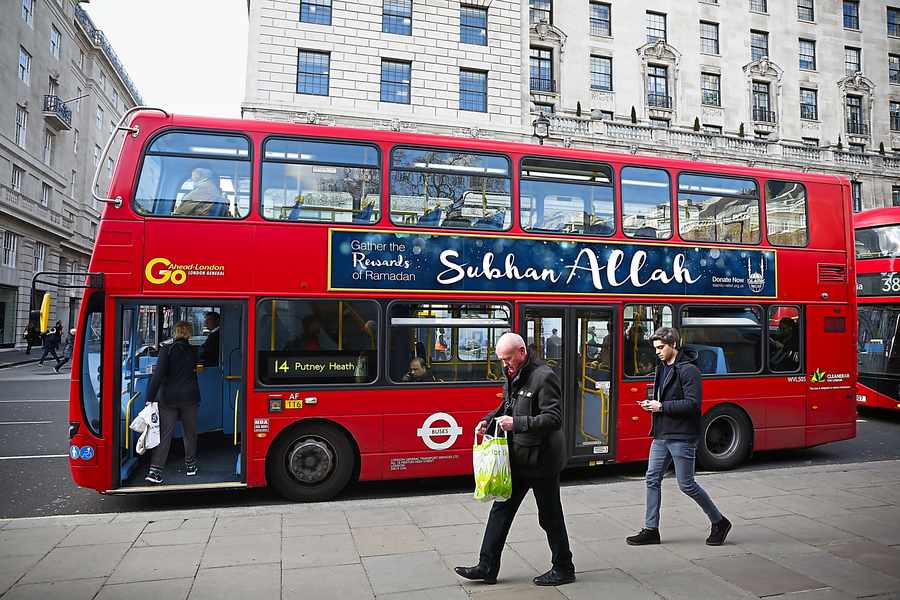
Speaking of which, I had just left London on the Underground on July 21, 2005 – when the Religion of Peace did this:
This was two weeks after the July 7 “Rivers of Blood” bombings.
This week London elected an Islamic mayor, and now they have “glory be to Allah” written on London buses.
NOAA has done some spectacular data tampering with the Boulder, Colorado temperature record, knocking as much as 7.8 degrees off the older measured temperatures, to turn a cooling trend into a warming trend.
A good example of this was May, 1980 – from which NOAA has knocked 7.3F off the measured minimum temperatures. The adjusted mean temperature is very close to the coldest daily temperature that month, and colder than every day but six.
The adjustments are clearly bogus and without any scientific basis, but this is standard practice at the US Government.

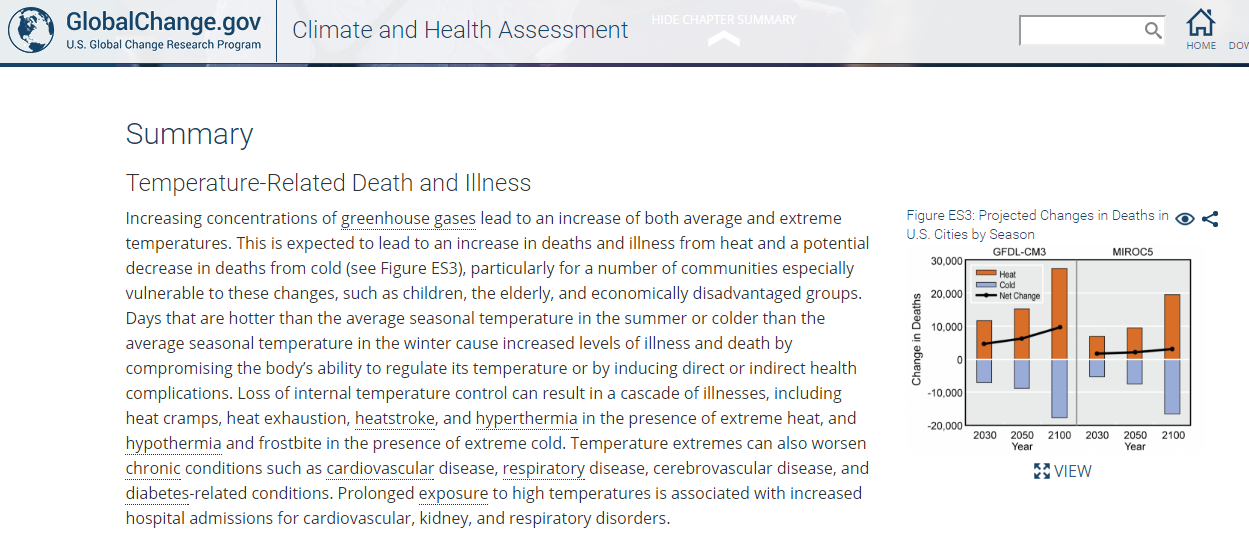 The Impacts of Climate Change on Human Health in the United States: A Scientific Assessment
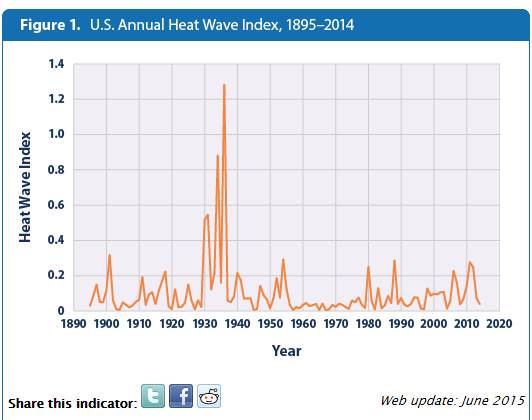


