Smoking Gun Of Fraud And Collusion Between Government Agencies

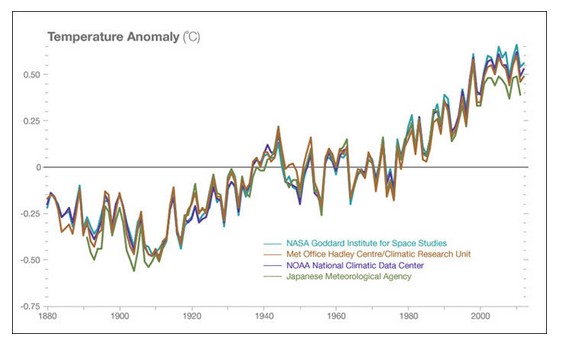
NASA uses this graph to “prove” that global warming is real. It shows the close agreement between NASA, NOAA, CRU and the Japan Space Agency.
ScreenHunter_13 Oct. 14 06.09

Climate Change: Vital Signs of the Planet: Consensus

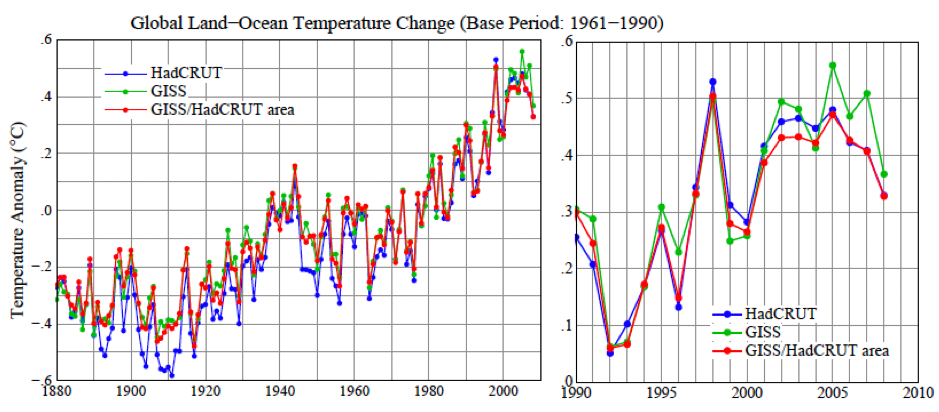
But six years ago, James Hansen was upset that they didn’t agree, and that there was no warming after the hottest year of 1998. Trenberth was also upset about the lack of warming. He called it a travesty.

If It’s That Warm, How Come It’s So Damned Cold?
by James Hansen, Reto Ruedy, Makiko Sato, and Ken Lo

Hansen09_fig4

Figure 4. Global surface temperature anomalies relative to 1961?1990 base period
RealClimate: 2009 temperatures by Jim Hansen

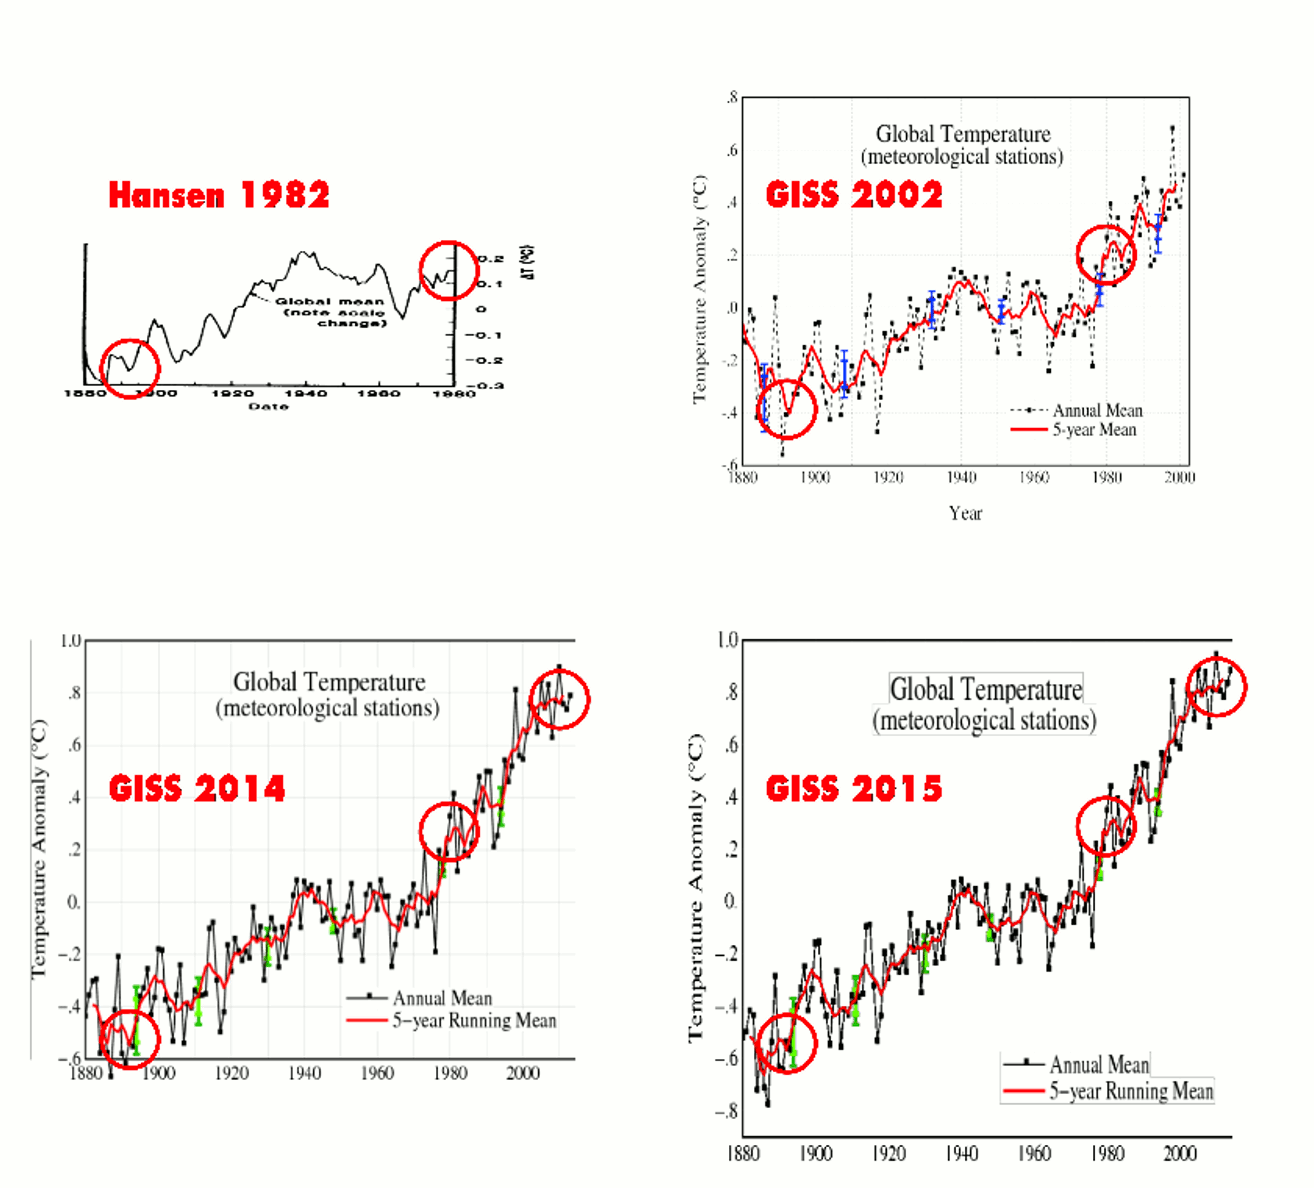
So what did these government criminals do? They all changed their data in unison, and simultaneously made the post 1998 hiatus disappear.
GISS1982_2002_2014_2015

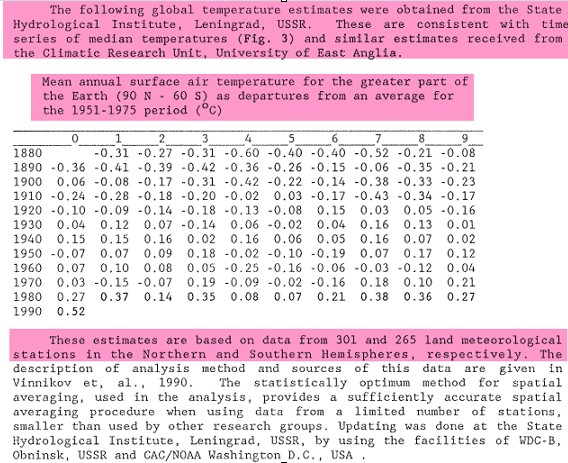
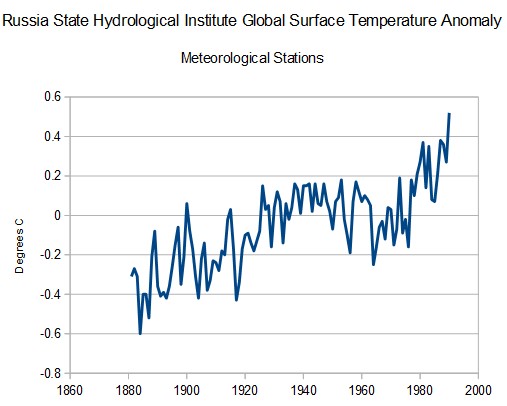
In 1990, NOAA published these global temperature numbers from the Russia State Hydrological Institute, and said they were consistent with CRU.
ScreenHunter_11 Oct. 14 02.43ScreenHunter_10 Oct. 14 02.39

climate-assessment-1981-1990.pdf

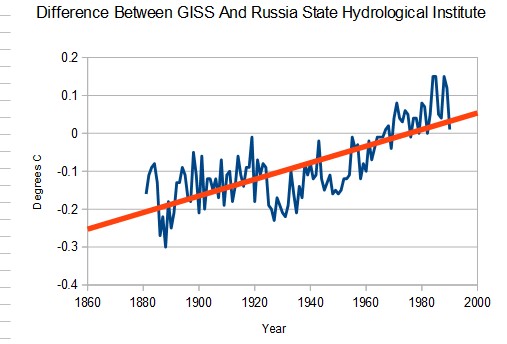
The numbers showed about 0.6°C warming from 1880 to 1980, and 0.2°C cooling from 1940 to 1970.
ScreenHunter_12 Oct. 14 02.49

NASA now shows about 0.9°C warning from 1880 to 1980, and no cooling after 1940.
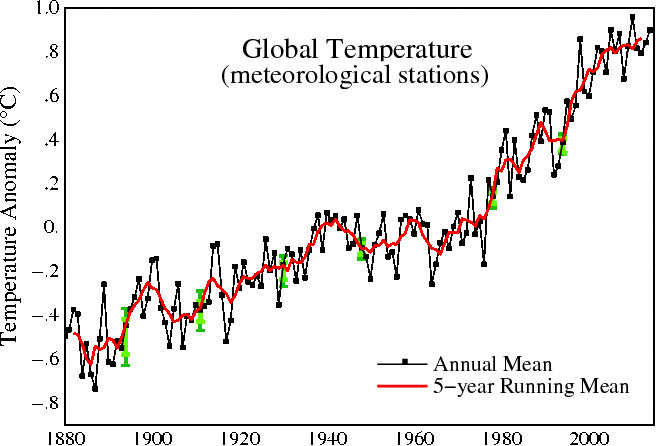
Fig.A

The graph below shows the difference between the NASA data and the Russian data.
ScreenHunter_07 Oct. 14 02.01

These government agencies are blatantly colluding and data tampering in unison, and then claiming to be independent after they do their dirty deeds.
Posted in Uncategorized | 12 Comments

The Key Criminals Behind The Climate Scam

  1. Barack Obama (being severely mentally ill) is determined to convince people that he saved the planet, and no fraud, lie or abuse of power is too great towards that end.
  2. John Cook. After losing the science debate, John Cook was commissioned by the White House to produce a fake 97% number. This allows people like the Sierra Club to ignore all data, and simply chant over and over again that 97% of imaginary scientists agree with their bullshit.
  3. Naomi Oreskes. Naomi’s job was to create an imaginary conspiracy of skeptics being funded by big oil. Her fraud forms the basis for the lunacy of scientists asking to have skeptics prosecuted.
  4. Gavin Schmidt/Tom Karl. Their job was to tamper with data, make the hiatus disappear, and declare 2015 to be the hottest year ever – ahead of Paris.
  5. Michael Mann. No BS is too big for Mikey to tell the press. He is the go to man for spreading the latest fraud.
  6. Katherine Hayhoe. Katherine may actually believe her own BS, and is simply stupid.
Posted in Uncategorized | 28 Comments

All US Warming, And Almost Half Of The Data, Is Fake

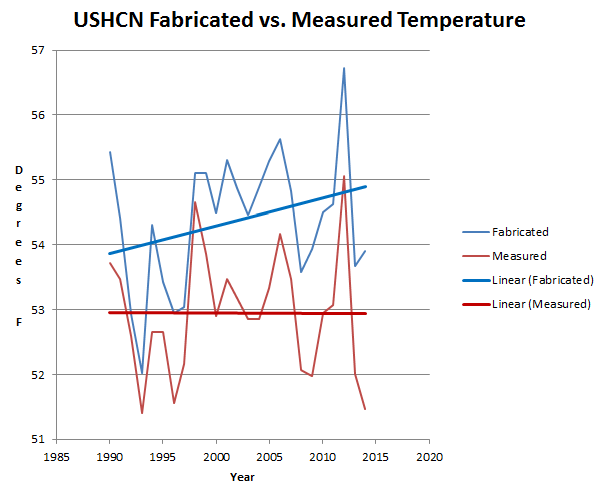
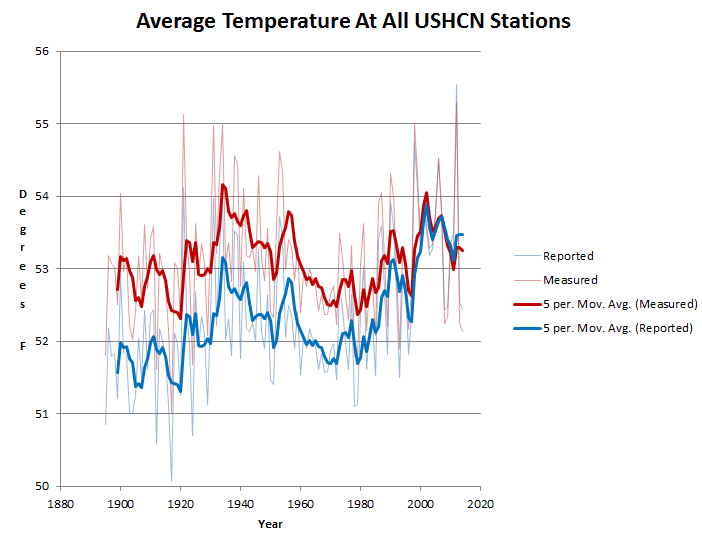
NOAA reports almost two degrees warming in the US, almost all of which is fake, and is derived from fake data. The red line below is the average of all of the measured station data, and the blue line is the average of all of reported station data. The US government has created a completely fake US warming trend, which the thermometers did not measure.

ScreenHunter_10807 Oct. 13 09.21

Reported: ushcn.tavg.latest.FLs.52j.tar.gz
Measured: ushcn.tavg.latest.raw.tar.gz

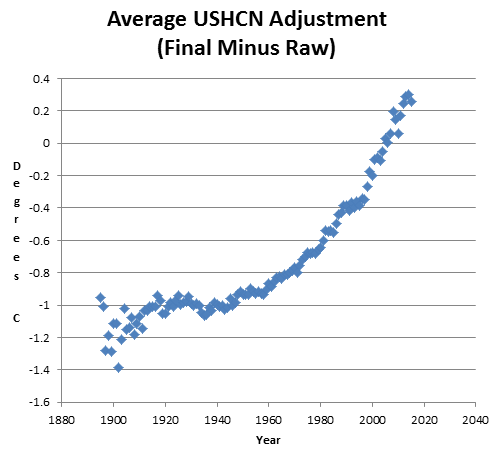
The graph below shows the spectacular hockey stick of data tampering NOAA is doing to the US data set.

ScreenHunter_10798 Oct. 13 04.09

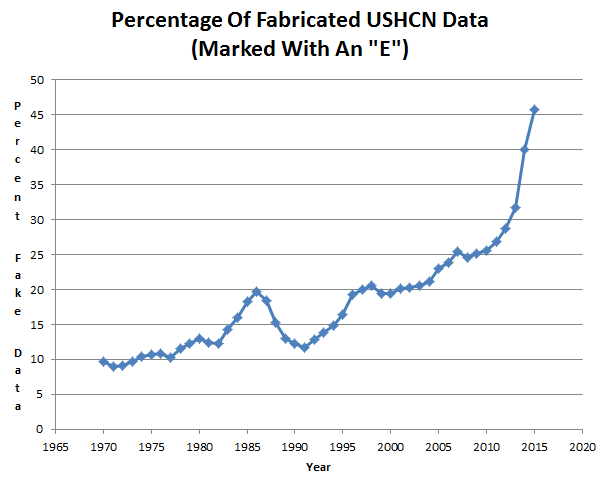
The primary mechanism they use for this data tampering, is to simply fabricate data. Fake data is marked with an ‘E’ like this data for Baudette, MN. It means they have no underlying data for that station during that month.

ScreenHunter_10802 Oct. 13 04.11

Almost half of their reported data is now fake.

ScreenHunter_10797 Oct. 13 04.08

In 1989, NOAA reported that there had been no warming in the US.

U.S. Data Since 1895 Fail To Show Warming Trend

By PHILIP SHABECOFF, Special to the New York Times Published: January 26, 1989

After examining climate data extending back nearly 100 years, a team of Government scientists has concluded that there has been no significant change in average temperatures or rainfall in the United States over that entire period.

The study, made by scientists for the National Oceanic and Atmospheric Administration was published in the current issue of Geophysical Research Letters. It is based on temperature and precipitation readings taken at weather stations around the country from 1895 to 1987.

U.S. Data Since 1895 Fail To Show Warming Trend – New York Times

In 1999, NASA’s James Hansen reported that much of the US was cooling.

in the U.S. there has been little temperature change in the past 50 years, the time of rapidly increasing greenhouse gases — in fact, there was a slight cooling throughout much of the country

NASA GISS: Science Briefs: Whither U.S. Climate?

But the fraud is vastly worse than it seems. Since NOAA reported no US warming in 1989, thermometers have continued to show no US warming. One hundred percent of US 1990-2014 warming is due to fake data.

ScreenHunter_10804 Oct. 13 04.48

This is the biggest fraud in history, and more than 97% of climate scientists base their work on completely fraudulent data from NOAA and NASA. The “consensus” is based on sham data.

Posted in Uncategorized | 40 Comments

NASA Goes Double Or Nothing On Their Data Tampering

Yesterday I showed how NASA has doubled their own reported global warming since 1999

ScreenHunter_10782 Oct. 11 08.56

1999 Figure 1: Global annual-mean surface air temperature change based on the meteorological station network.

2015 Versiontraditional analysis using only meteorological station data

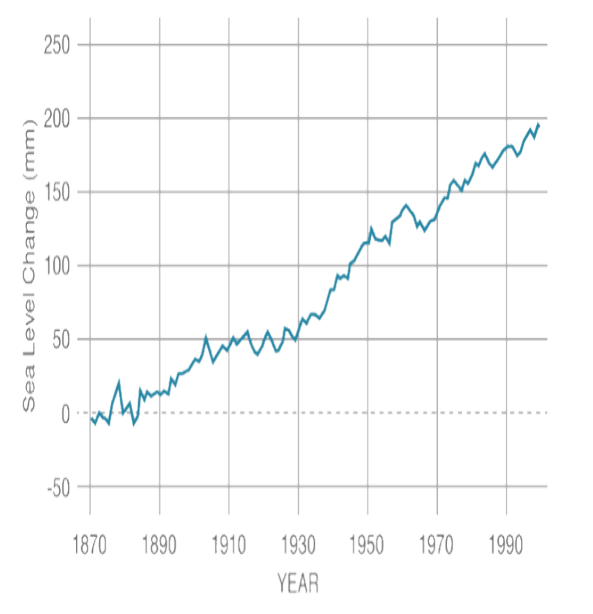
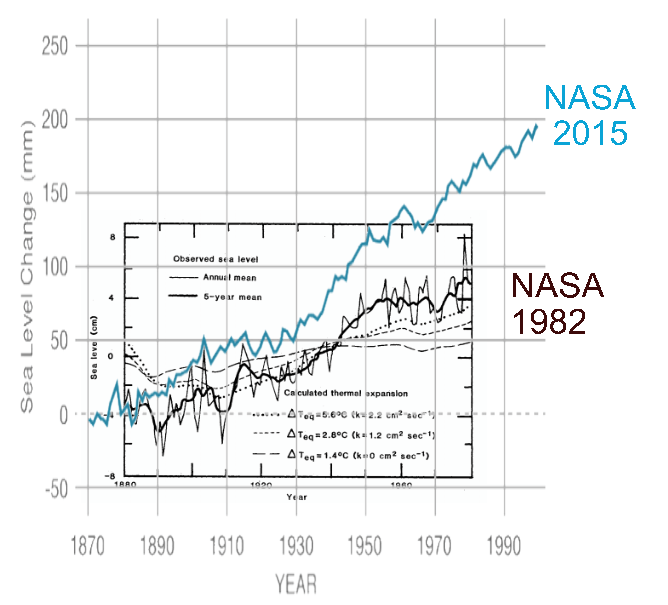
That is pretty spectacular fraud, and they have done exactly the same thing with their sea level data since 1982. NASA currently shows 16 cm of sea level rise from 1880 to 1980, and no change in rates over time

ScreenHunter_3443 Oct. 12 11.34Climate Change: Vital Signs of the Planet: Sea Level

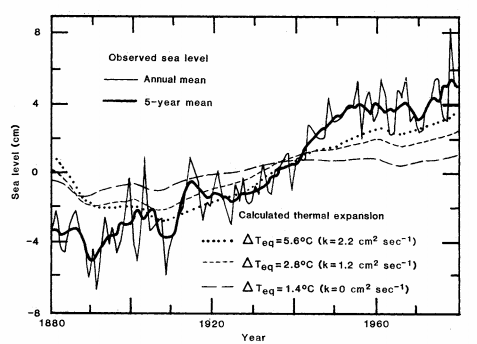
But in 1982, NASA only showed 8 cm of sea level rise from 1880 to 1980, and a sharp flattening to almost zero after 1950.

ScreenHunter_3441 Oct. 12 11.22

pubs.giss.nasa.gov/docs/1982/1982_Gornitz_etal_1.pdf

The next graph is an overlay of the two above, normalized to 1880.

ScreenHunter_3444 Oct. 12 11.56

NASA’s current graph looks nothing like their 1982 graph, doubling sea level rise. Exactly the same thing they have done with temperature rise.

Posted in Uncategorized | 18 Comments

Living The Green Dream In Boulder

We are having 70 MPH wind gusts and the electricity is out. Greens must be thrilled to be living like cavemen without the necessary survival skill set.

I had completely forgotten what the Milky Way looks like.

Posted in Uncategorized | 13 Comments

It Only Takes One Progressive To Destroy A Community

ScreenHunter_10787 Oct. 11 13.00

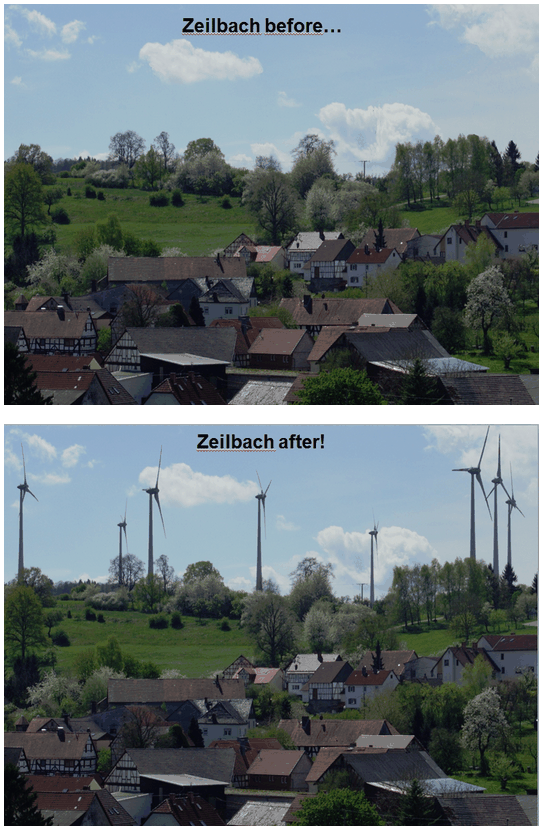
Shocking Before-And-After Photos: How Wind Parks Are Devastating Idyllic German Countryside!

Posted in Uncategorized | 16 Comments

Reader Quiz : Which Way Is My Train Moving?

Posted in Uncategorized | 19 Comments

50% Of Reported Global Warming Is Due To Post 1999 Data Tampering

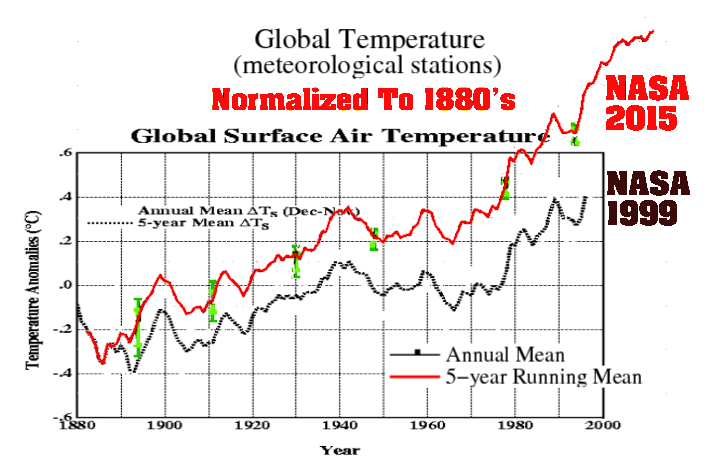
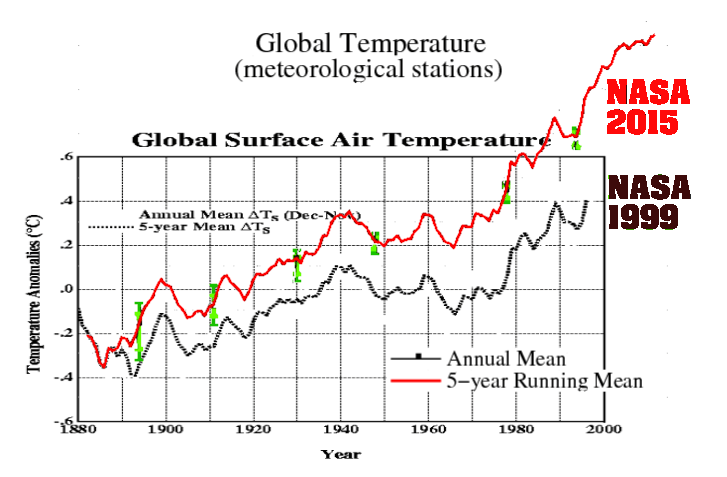
In 1999, NASA reported 0.6C warming from 1882 to 1996. Now they report almost twice that much warming from 1882 to 1996. Note that the alterations have been far outside of the green error bars, indicating incompetence, fraud, or both.

ScreenHunter_10779 Oct. 11 08.37

1999 Figure 1: Global annual-mean surface air temperature change based on the meteorological station network.

2015 Versiontraditional analysis using only meteorological station data

The next graph shows the same thing, normalized to 1880’s temperatures.

ScreenHunter_10782 Oct. 11 08.56

This is the biggest fraud in science history, and needs to be investigated by Congress immediately.

Posted in Uncategorized | 6 Comments

Gavin Takes Climate Cynicism To An Entirely New Level

Gavin just bumped recent global temperatures up so much that he had to add a new Y-axis grid line at 0.8°C.

GISSFigA2Changes-March-Sept2015

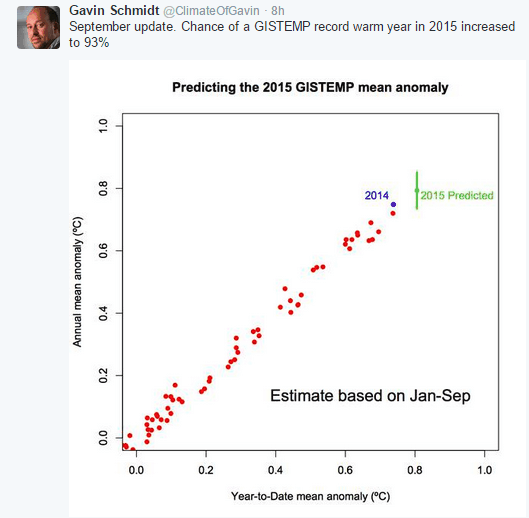
Shortly after doing this, he announced that the odds of a record warm year had increased.

ScreenHunter_10775 Oct. 11 05.40

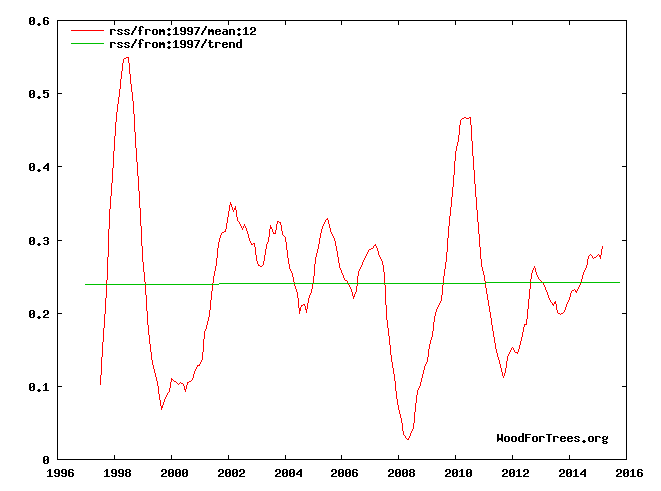
No mention from Gavin of course that satellite data shows a 0% probability of 2015 being a record warm year.

ScreenHunter_10776 Oct. 11 05.56

Wood for Trees: Interactive Graphs

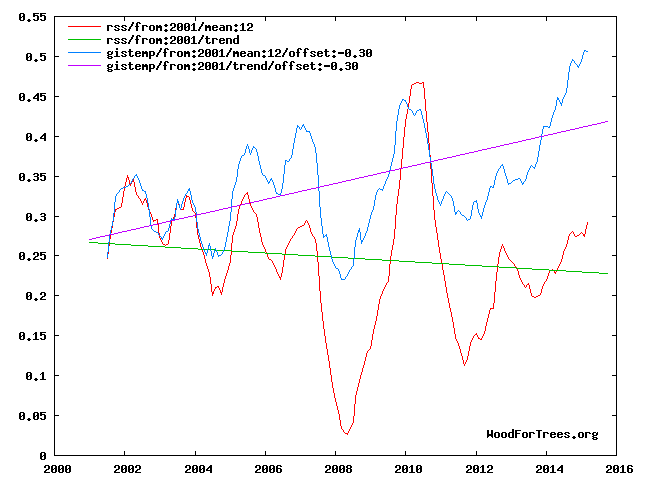
If Gavin was an actual scientist, he would mention that his data is diverging from satellite data at a rate of 1.27°C per century since the beginning of this century.

ScreenHunter_10777 Oct. 11 07.06

Wood for Trees: Interactive Graphs

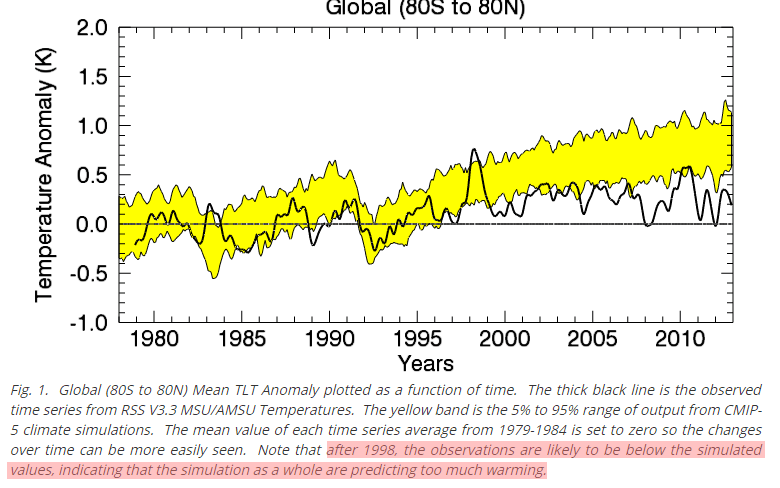
If Gavin was an actual scientist, he might also mention that warming has been much slower than forecast by climate models.

PaintImage467

Climate Analysis | Remote Sensing Systems

Posted in Uncategorized | 8 Comments

Saving Manhattan!

ScreenHunter_10774 Oct. 11 05.18

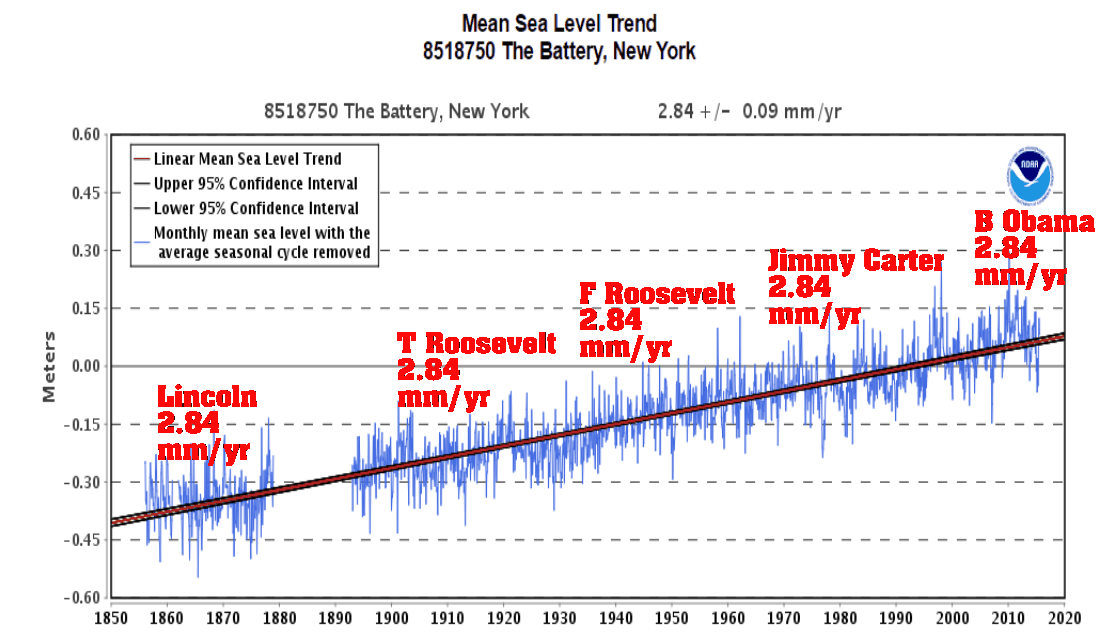
Sea level at Manhattan has been steadily rising about 2.84 mm/year since Abraham Lincoln was president, mainly due to land subsidence. President Obama believes that he can slow the rate of sea level rise at Manhattan, by making electricity prices skyrocket.

https://www.youtube.com/watch?v=HlTxGHn4sH4

Posted in Uncategorized | 15 Comments