Lies, Damned Lies And Thousand Year Rainfalls

USGS has made the press hysterical with their fake “thousand year rain” claim in South Carolina, which is now “biblical.” They pulled exactly the same nonsense here in Colorado two years ago.

ScreenHunter_10695 Oct. 06 06.23

Note the small region in NE South Carolina which received 16 inches of rain, and that Texas got more rain this week than South Carolina.

usa (4)

Intellicast – Weekly Precipitation in United States

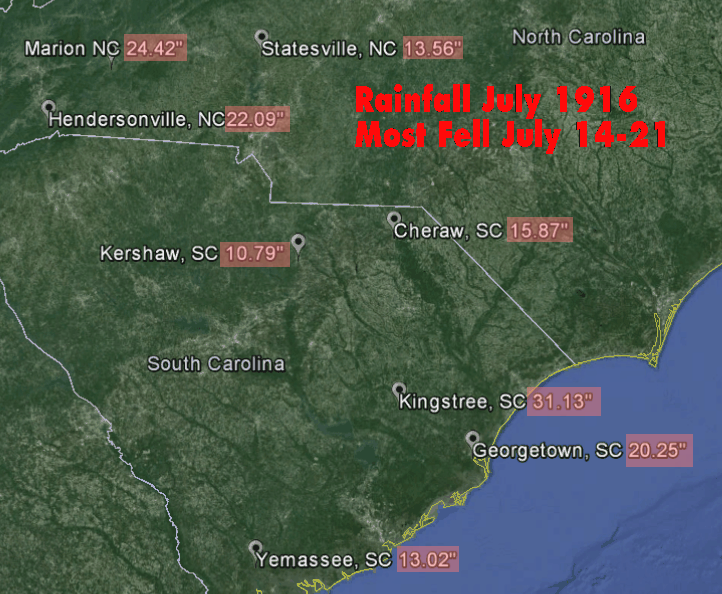
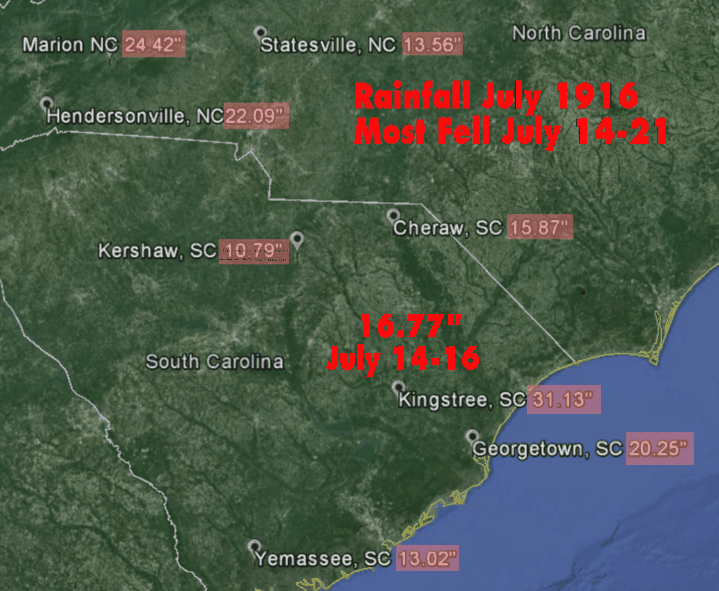
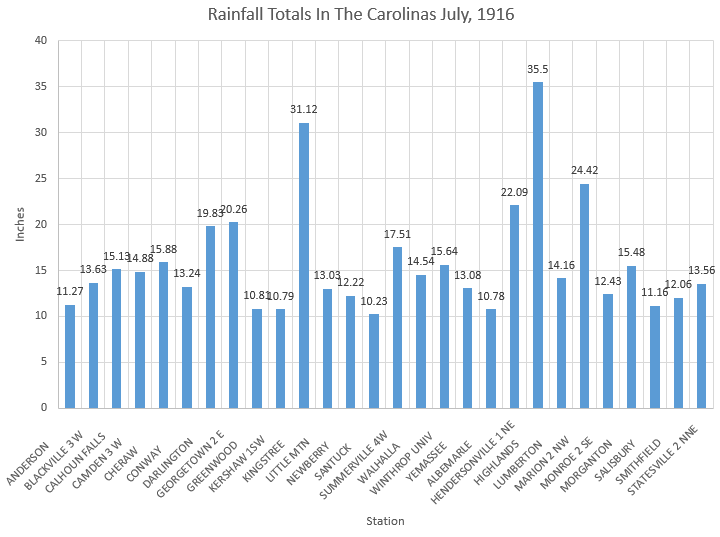
Apparently 1916 was more than one thousand years ago, because they had very similar rainfall during July, 1916. The same region received more than 16″ of rain from July 14-16. For the month of July 1916, almost the entire region was over 10″ with totals as high as 35″ in North Carolina

ScreenHunter_10694 Oct. 06 06.19

ScreenHunter_3404 Oct. 06 12.42

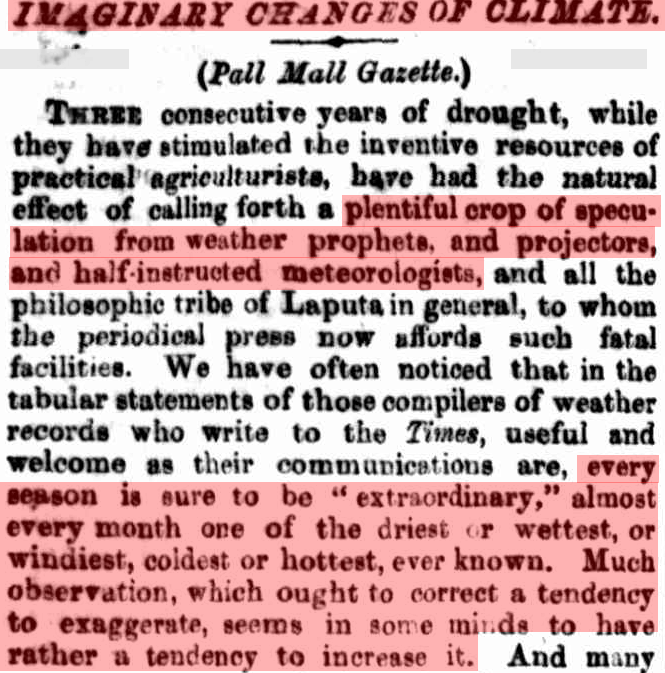
It is all propaganda, all the time. Just like it was in 1871.

ScreenHunter_1858 Jan. 15 22.36

10 Jan 1871 – IMAGINARY CHANGES OF CLIMATE. (Pall Mall Gazette.)

Posted in Uncategorized | 10 Comments

The Thousand Year Rainfall Fallacy

Every time we get a big rain in the US, climate morons start claiming it was a 1,000 year event

So what are they doing wrong?

Your odds of winning the lottery are very small, but the odds of someone winning the lottery are quite high. What these geniuses are doing is conflating the odds of one individual station getting a 20 inch rain, with the odds of any station getting a 20 inch rain.

Big rains are not rare in the US. Alvin, Texas got 43 inches of rain in one day in 1979.

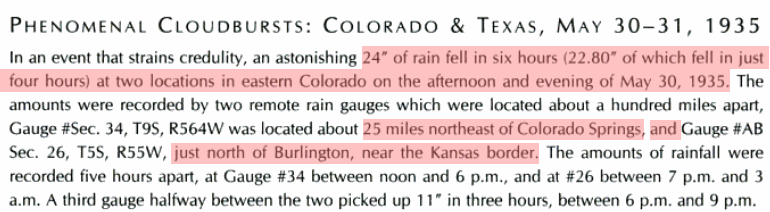
We heard exactly the same 1,000 year nonsense after the 20 inch rains of 2013 in Colorado, but Colorado got 24 inches of rain in six hours in 1935.

PaintImage103

There are records of many other comparable rains in the US, but people make the same mistake generation after generation.

ScreenHunter_1858 Jan. 15 22.36

10 Jan 1871 – IMAGINARY CHANGES OF CLIMATE. (Pall Mall Gazette.)

Posted in Uncategorized | 32 Comments

Arctic Sea Ice Extent Second Highest For The Date Since 2005

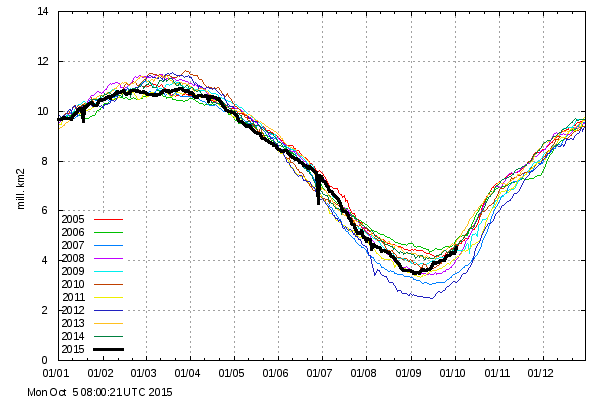
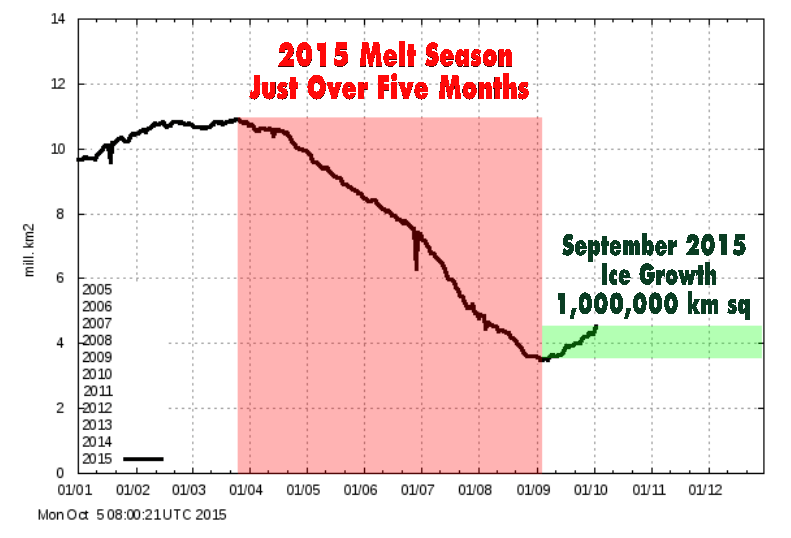
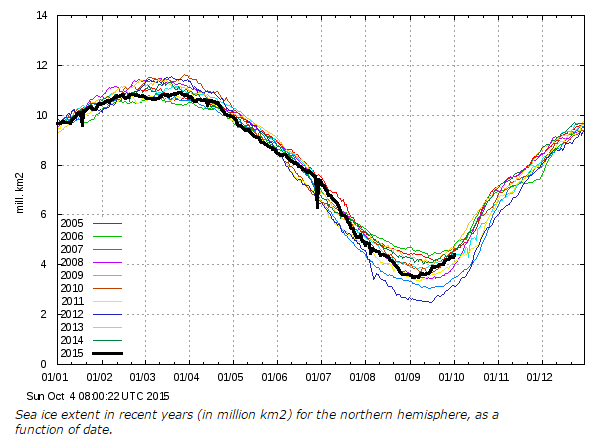
After the shortest melt season on record, and record growth of sea ice in September, Arctic sea ice extent is now the second highest in the DMI record for the date.

icecover_current (83)

Ocean and Ice Services | Danmarks Meteorologiske Institut

ScreenHunter_10671 Oct. 05 05.35

ScreenHunter_10672 Oct. 05 05.37

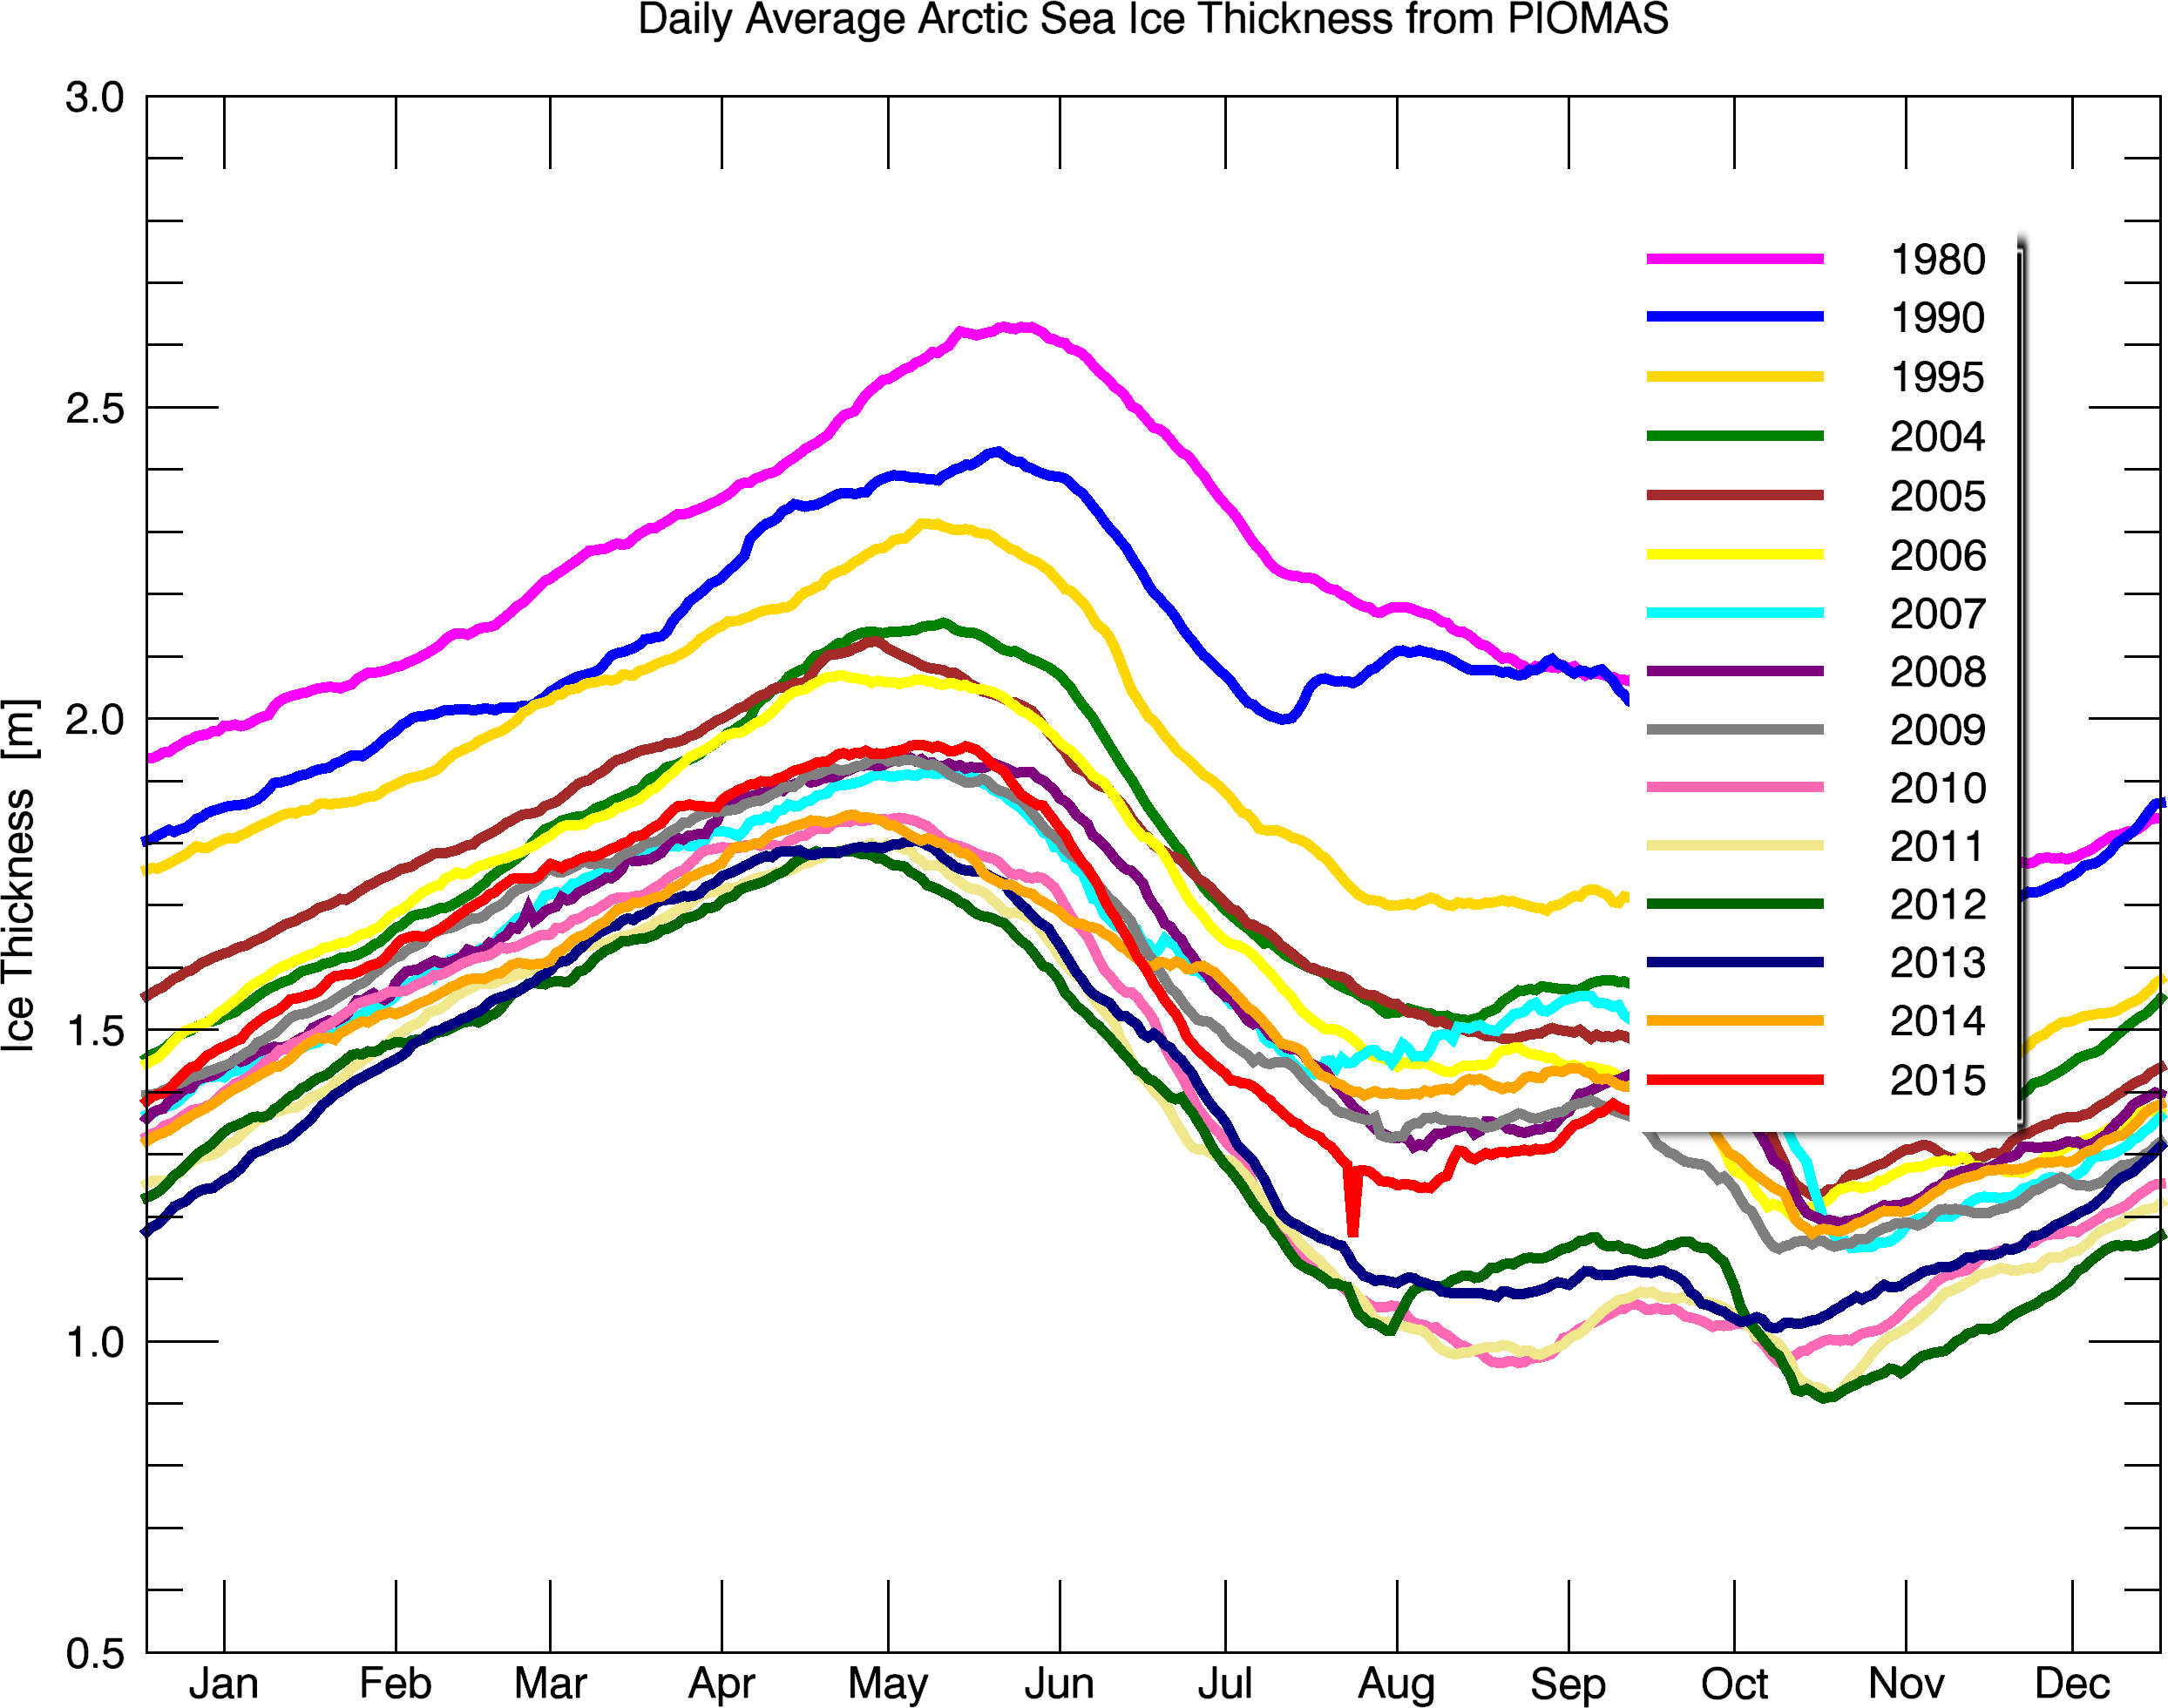
Ice thickness has increased by 40% over the past five years.

Bpiomas_plot_daily_heff.2sst (9)

Bpiomas_plot_daily_heff.2sst.png (2488×1960)

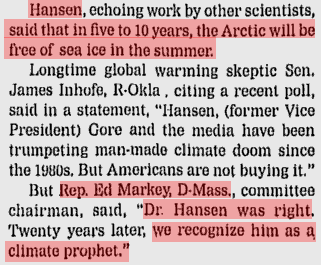
NASA’s top climate prophet says the Arctic is ice-free.

The Argus-Press – Jun 24, 2008

ScreenHunter_377 May. 12 13.16

The Argus-Press – Google News Archive Search

Posted in Uncategorized | 70 Comments

EPA And CSIRO – Taking Sea Level Fraud To Spectacular New Heights

Incredible fraud from the EPA and CSIRO. The EPA now claims that tide gauges show sea level rising faster than satellites, with 3 inches (76 mm) sea level rise since 1990. That 3.0 mm/year.

Trends_in_global_average_absolute_sea_level,_1880-2013

Sea Level | Climate Change | US EPA

Earlier versions of this same graph showed the exact opposite, that tide gauge rates were slower than satellites. Apparently someone at EPA recently tampered with it to make it scarier.

Trends_in_global_average_absolute_sea_level,_1870-2008_(US_EPA) (1)

The EPA tide gauge claim of 3 mm/year is almost double what NOAA calculates

absolute global sea level rise is believed to be 1.7-1.8 millimeters/year

Sea Level Trends – Global Regional Trends

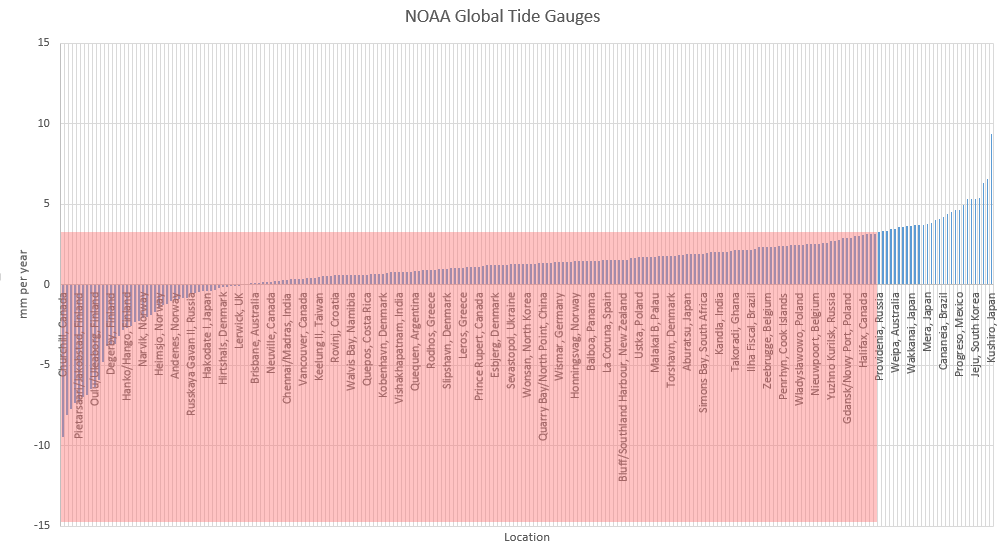
But it is worse than it seems. 85% of NOAA tide gauges report less sea level rise than the EPA claims is the average for tide gauges.

PaintImage97

Sea Level Trends – MSL global stations trends table

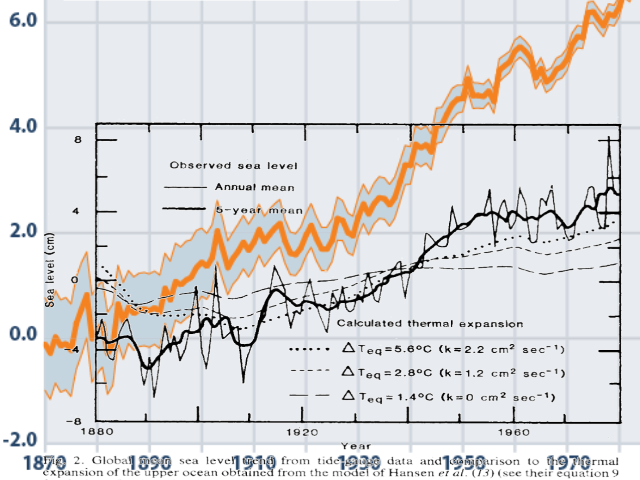
In 1982, NASA showed just over three inches of sea level rise from 1880 to 1980, compared to double that amount in EPA/CSIRO graph.

ScreenHunter_2132 May. 31 12.25

pubs.giss.nasa.gov/docs/1982/1982_Gornitz_etal_1.pdf

The next image overlays the EPA/CSIRO graph on the 1982 NASA graph at the same scale. The EPA data is completely fake.

ScreenHunter_10678 Oct. 05 06.01

The EPA claims are in direct contradiction to current NOAA and earlier EPA and NASA data. But they have a political agenda being directed by the White House, and facts are not allowed to interfere.

Posted in Uncategorized | 11 Comments

Rampant Sea Level Fraud In Academia And Government

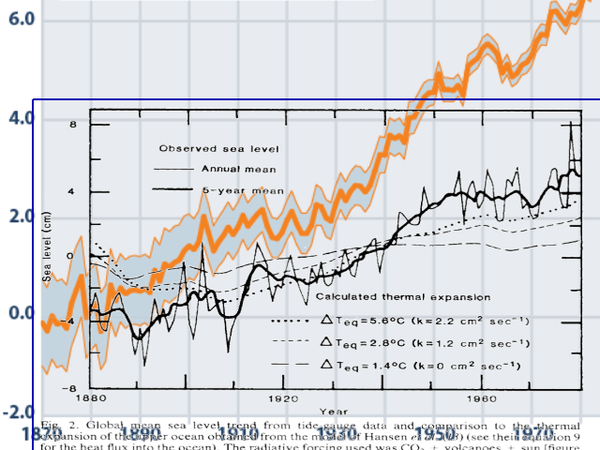
In 1982, NASA showed just over three inches (8 cm) of sea level rise from 1880 to 1980. They also showed a sharp slowdown in sea level rise rates after 1950.

ScreenHunter_2132 May. 31 12.25

pubs.giss.nasa.gov/docs/1982/1982_Gornitz_etal_1.pdf

Three inches isn’t very scary, so the EPA has doubled that figure, and shows six inches of sea level rise from 1880 to 1980 – with completely fake acceleration after 1950.

Trends_in_global_average_absolute_sea_level,_1870-2008_(US_EPA) (1)Trends in global average absolute sea level, 1870-2008 (US EPA) – Sea level rise

This graph overlays the two graphs at the same scale. The EPA data is political, not scientific.
CGWXcXUU8AABZ5w

Tide gauges show a slowdown in sea level rise rates, so government propaganda agencies tamper with them and now simply ignore them, instead using incredibly poor interpretations of satellite data since 1993. But even this data is being tampered with over time.

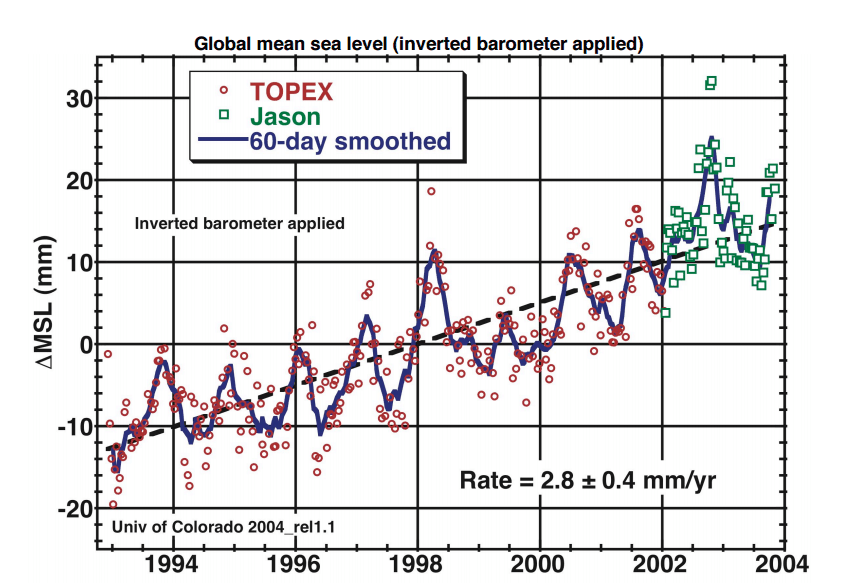
In 2004, the University of Colorado (who got beaten up by Oregon yet again last night) showed sea level rise rate of 2.8 mm/year, with an error of +/- 0.4.
ScreenHunter_10644 Oct. 03 11.07

http://sealevel.colorado.edu/2004_rel1.2/sl_cu2004_rel1.2.pdf

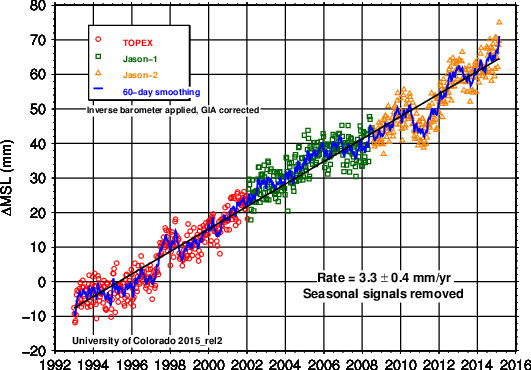
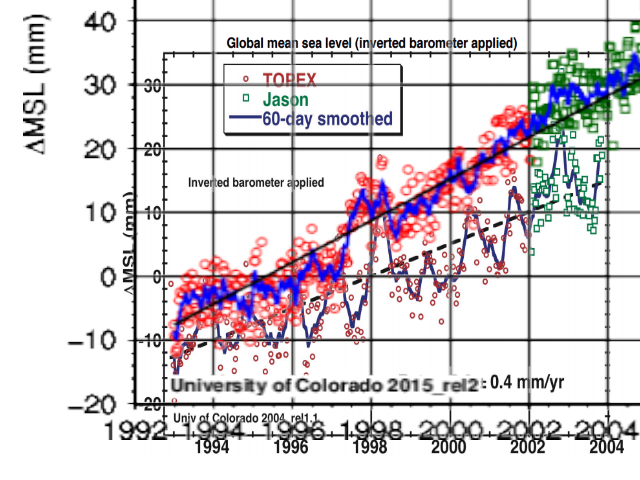
 That wasn’t very scary, so they have since changed the data and moved it outside of their own error bars to 3.3 mm/year, using a Global Isostatic Adjustment which is 100% fraudulent in the context of sea surface height. That adjustment was intended to calculate ocean depth as the sea floor sinks, but has no bearing on the accuracy of measurement of sea level by satellites.
sl_ns_global (2)

2015_rel2: Global Mean Sea Level Time Series (seasonal signals removed) | CU Sea Level Research Group

The image below overlays them at the same scale. The University of Colorado simply altered the data to make it look a little scarier.
AnimationImage86

But here is the real smoking gun of fraud from the IPCC.

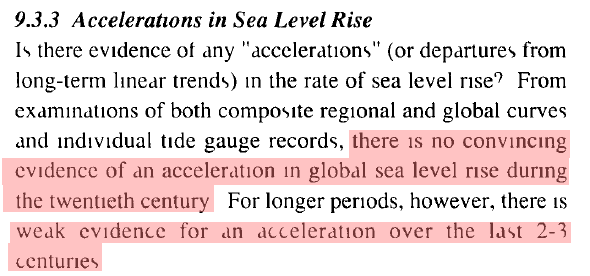
In 1990 the IPCC said :

there is no convincing evidence of an acceleration in global sea level rise during the twentieth century

there is weak evidence for an acceleration over the last 2-3 centuries
PaintImage85

In the 2013 report, they say the exact opposite

The 2013 IPCC report (AR5) concluded, “there is high confidence that the rate of sea level rise has increased during the last two centuries, and it is likely that GMSL (Global Mean Sea Level) has accelerated since the early 1900’s

Trends in global average absolute sea level, 1870-2008 (US EPA) – Sea level rise – Wikipedia, the free encyclopedia

Very little of what you hear about the climate from government or academia has any validity. They are simply fabricating data for political and monetary purposes. It is a $29 billion dollar per year RICO style racket, and the biggest scam in history.

Posted in Uncategorized | 36 Comments

Arctic Gained 20,000 Manhattans Of Ice In September

ScreenHunter_10655 Oct. 04 05.42

Ocean and Ice Services | Danmarks Meteorologiske Institut

Arctic sea ice experienced the earliest minimum on record this year, and has seen record growth in September.

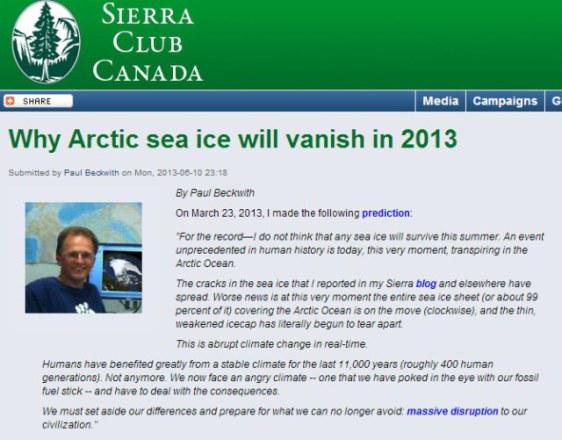
The Sierra Cub says the Arctic has been ice-free for two years.

CPmlTl4UEAA5Zok

Posted in Uncategorized | 29 Comments

More On NOAA Model Uncertainty

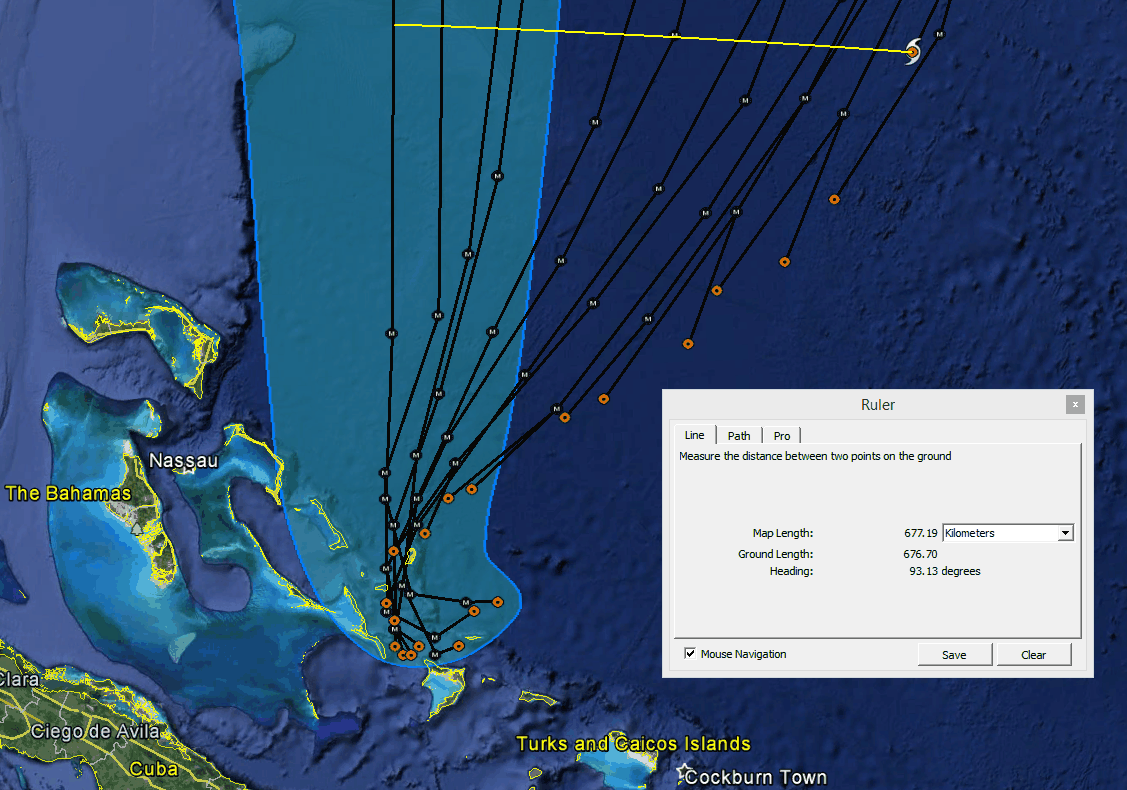
The turquoise cone below shows NOAA’s Joaquin “Forecast Uncertainty” as of September 30 at 11:32 PM. The hurricane is currently 677 km east of the forecast track, but their forecast uncertainty cone was only 210 km. Their actual uncertainty was more than three times larger than what their model predicted.

ScreenHunter_10653 Oct. 04 05.17
ScreenHunter_10651 Oct. 04 05.12

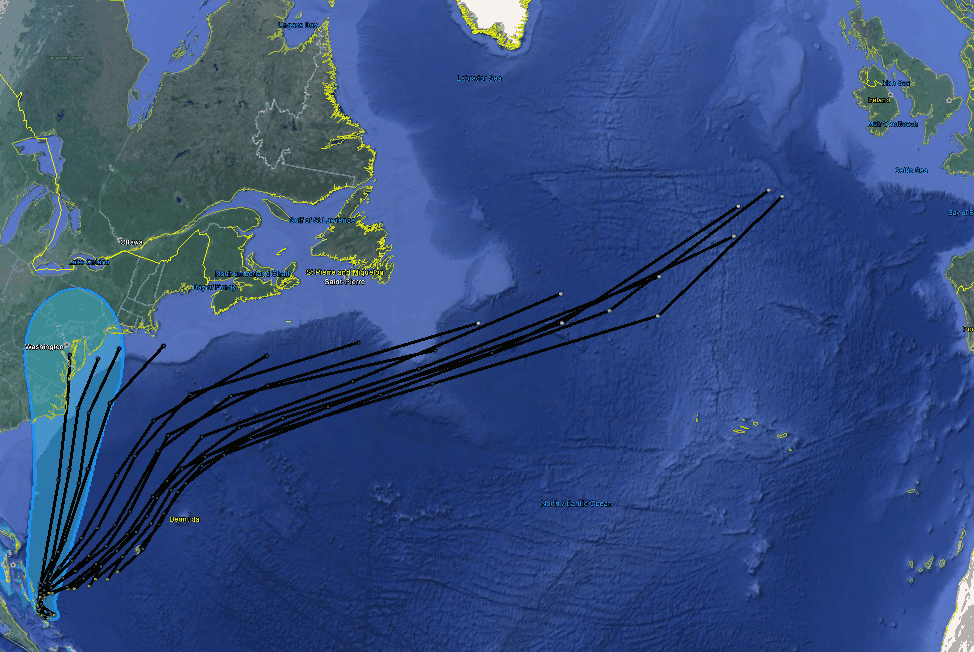
Joaquin is currently forecast to move towards Ireland as a strong tropical storm.

ScreenHunter_10652 Oct. 04 05.15

These are their good models. Their climate models are completely useless, and have 0% accuracy. Barack Obama then takes impossibly stupid interpretations of completely useless models, and uses them as an excuse to wreck our energy infrastructure.  The US press cheers this treachery, and refuses to publish any accurate information.

Posted in Uncategorized | 27 Comments

Gavin Doesn’t Need Any Actual Data

In the 1990 IPCC report, they showed that there was insufficient temperature data for analysis in much of the Arctic, most of the southern oceans, and all of the Antarctic.

PaintImage78

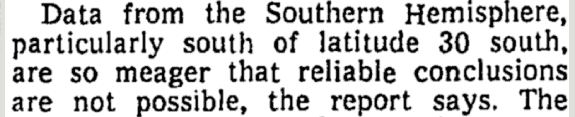
In 1978, scientists agreed data south of 30S was too meager to be reliable.

PaintImage83ScreenHunter_10659 Oct. 04 06.22

TimesMachine: January 5, 1978 – NYTimes.com

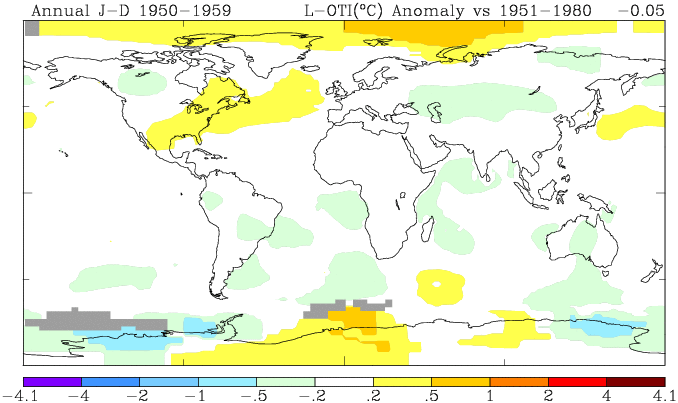
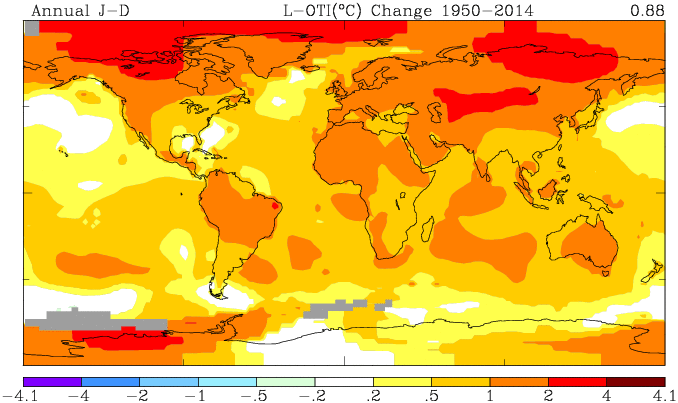
A lack of data is no obstacle for Gavin however. He simply makes the data up.

nmaps (13)

But this fraud is much worse than it seems. The fastest warming places on Gavin’s imaginary Earth are the areas with little or no data.

nmaps (14)

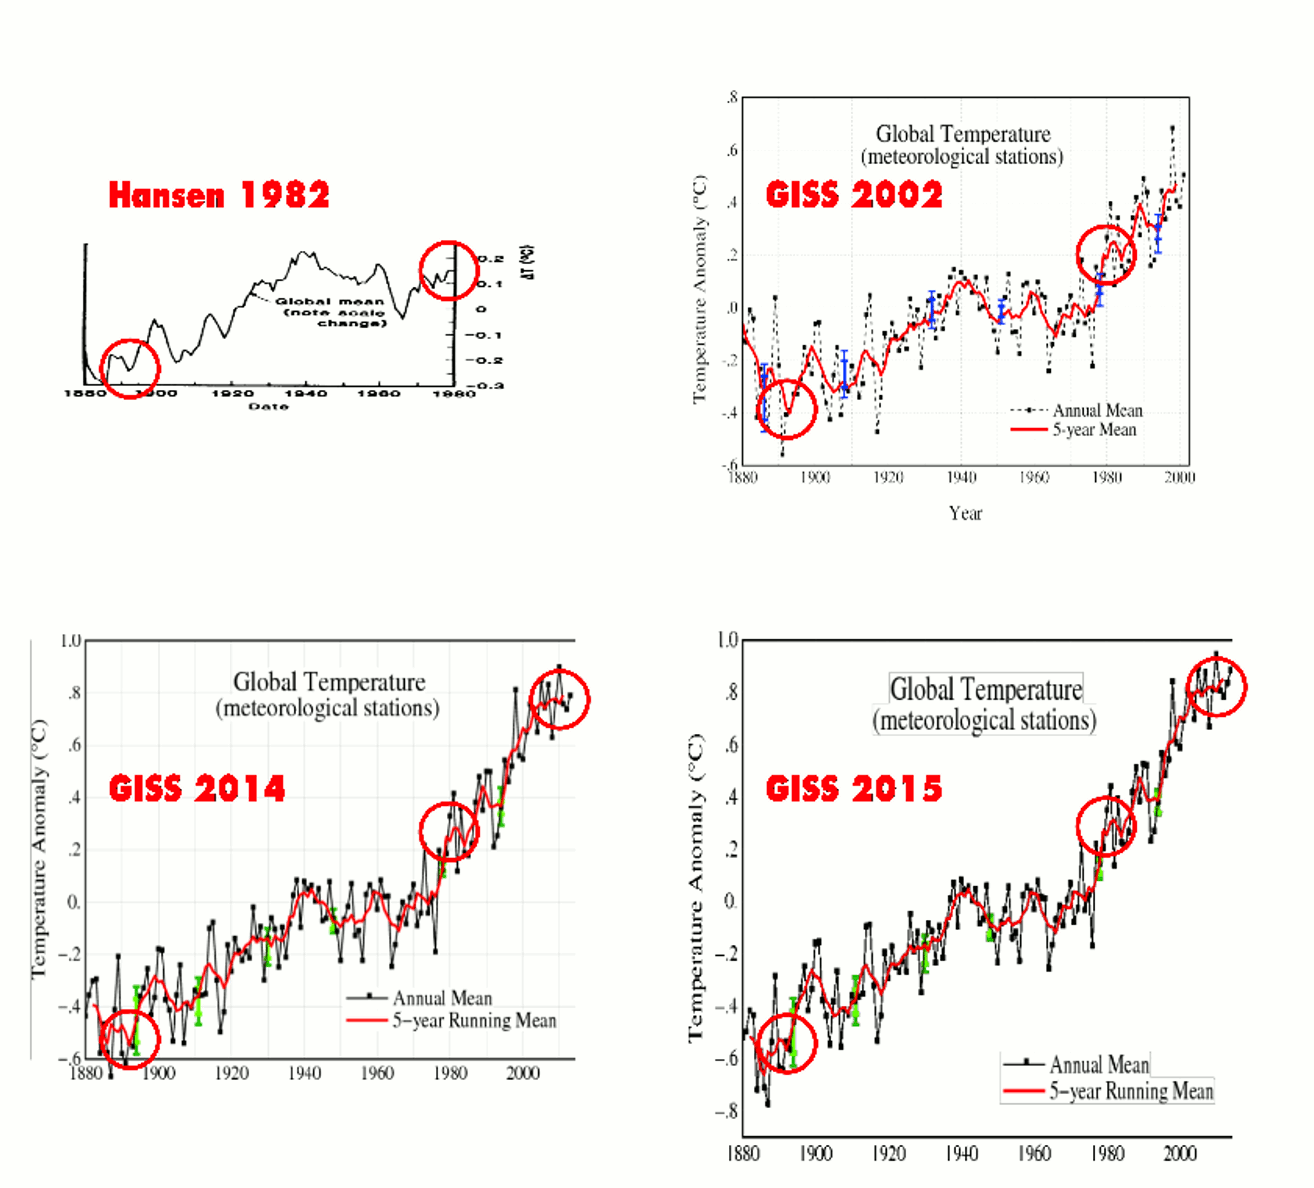
Using fake data allows him to keep cooling the past and warming the present.

GISS1982_2002_2014_2015

Gavin’s fake data massively skews temperature trends upwards, and then President Obama takes Gavin’s fake numbers on the road to assist in establishing his fake “climate” agreement.

Posted in Uncategorized | 24 Comments

Obama Praises Gun Bans And Confiscation

This week, President Obama praised the idea of gun bans and confiscation – like the Nazis did in 1938 immediately ahead of the Holocaust.

ScreenHunter_10638 Oct. 03 08.00

Middlesboro Daily News – Google News Archive Search

He is doing the exact opposite of what he promised as a candidate.

You heard it right here on television, I won’t take your rifle away, I won’t take your handgun away.

Posted in Uncategorized | 44 Comments

Union Army Was Complicit In Genocide

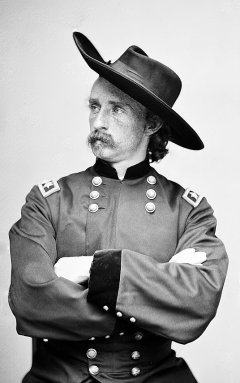
george-custer-1custer flag

Before General Custer carried the Union Flag to massacre Native Americans, he was one of Abraham Lincoln’s heroes at Gettysburg and Appomattox.

On June 29, 1863 Custer was commissioned to brigadier general of volunteers and assigned to command a brigade in Kilpatrick’s division. While in this position he led his men in the Battle of Gettysburg where he assisted in preventing J.E.B. Stuart from attacking the Union rear.

As Custer’s final major act in the war he led the division responsible for cutting off Lee’s last avenue of escape at Appomattox; a week later he received the appointment, major general of volunteers.

George Armstrong Custer

The Union flag is clearly a symbol of hatred and aggression against Native Americans, and must be taken down from all statehouses which fly it.

Posted in Uncategorized | 20 Comments