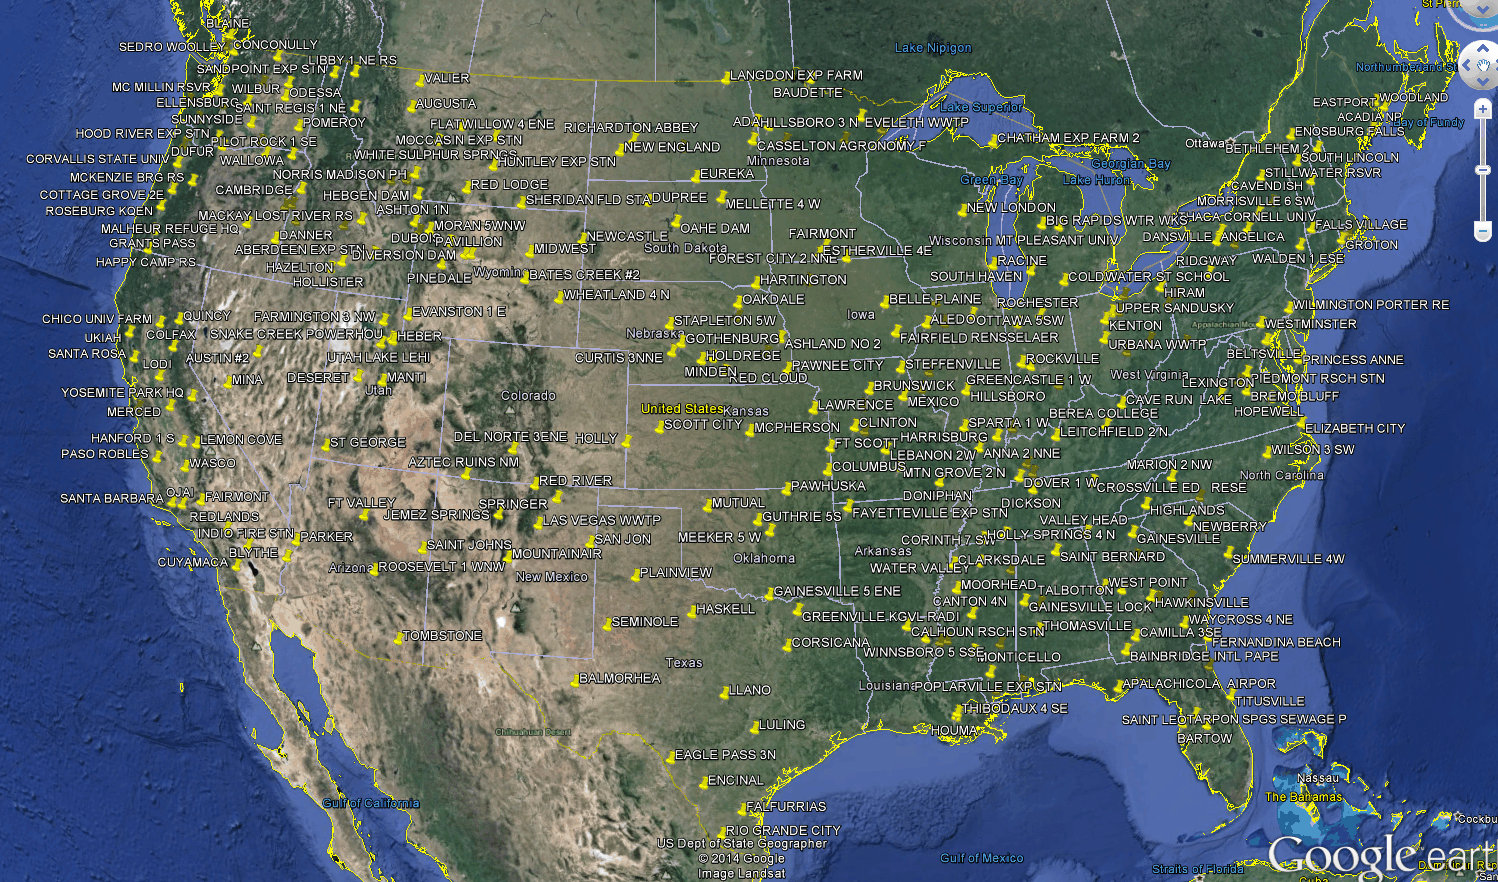
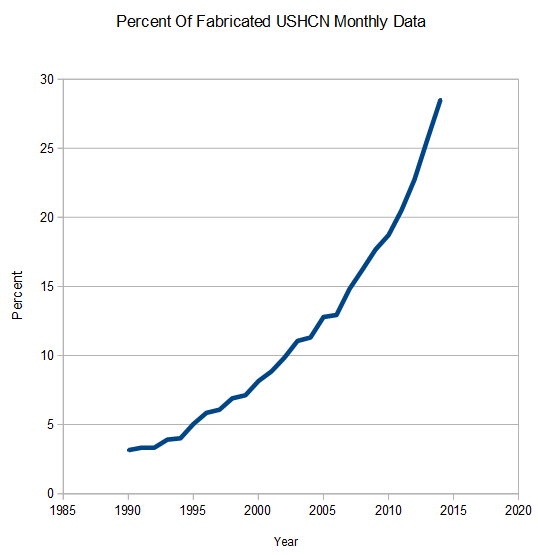
USHCN has 1,218 stations in their database. Prior to 1990, they typically recorded temperatures at about 97% of these stations. But for some reason, USHCN has been reporting monthly temperatures at a smaller and smaller percentage of stations since 1990, and now about 30% of monthly temperatures are completely missing.
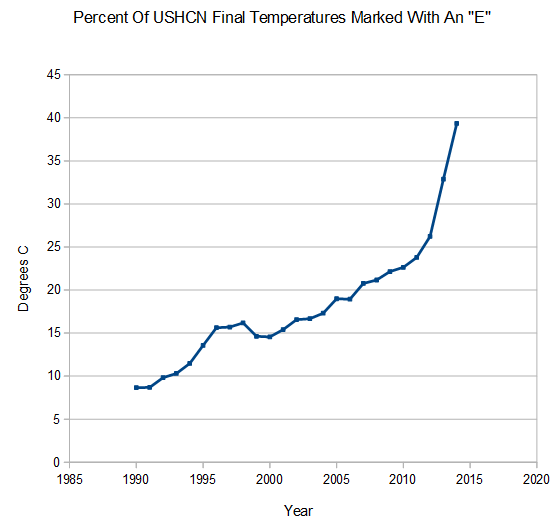
What NCDC does in those cases, is to fabricate temperatures for the missing stations. The graph below shows the percentage of stations which have fabricated data, which is increasing in a hockey stick.
I plotted below the average annual temperature of the fabricated data in blue, and the measured temperatures in red. The measured temperatures show no warming since 1990, but the fake temperatures are warming at 7.3 degrees per century.
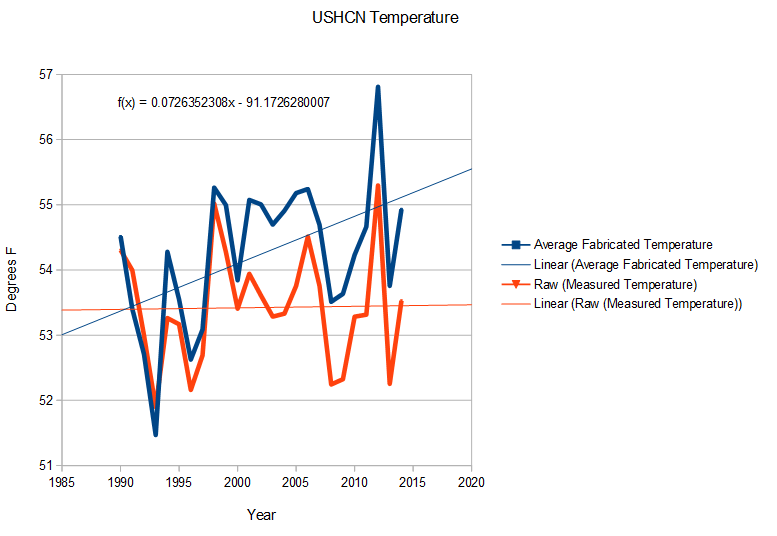
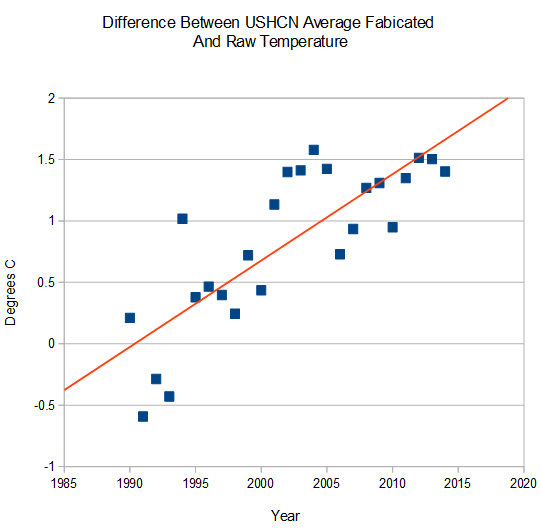
These fake temperatures introduce a huge warming bias into the NCDC US temperature record, and account for 100% of all warming reported since 1990.
Raw data : ftp://ftp.ncdc.noaa.gov/pub/data/ushcn/v2.5/ushcn.tavg.latest.raw.tar.gz
Final data : ftp://ftp.ncdc.noaa.gov/pub/data/ushcn/v2.5/ushcn.tavg.latest.FLs.52i.tar.gz
Fake temperatures are marked with an “E” in their final database, as seen below in the 2008-2011 January-June data for Cadiz, Ohio.

Nearly 40% of the 2014 final temperatures are marked with an “E” – which is even larger than the 29% percentage of stations which are completely fake. This indicates that they are also making up temperatures for a large number of stations which actually do have thermometer data.