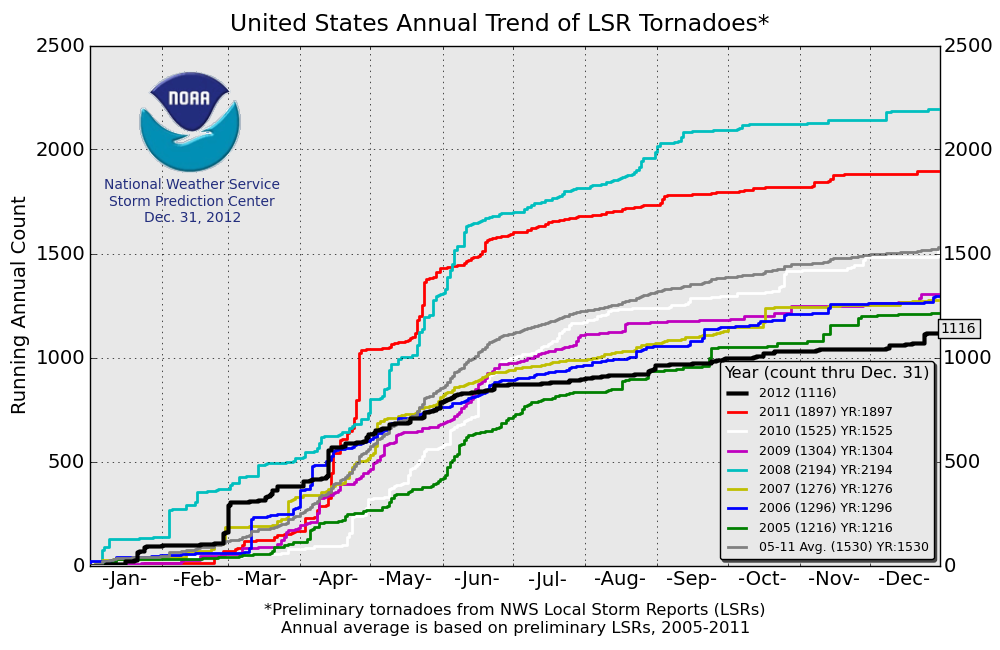
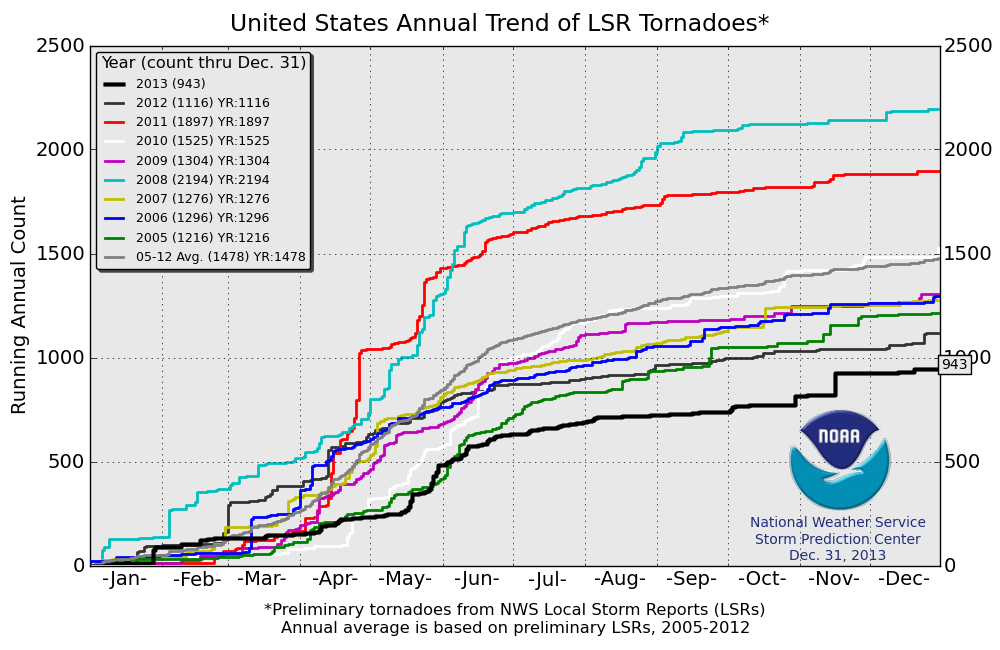
Three years ago, climate experts blamed the tornado in Joplin, Missouri on global warming.

Each of the three years since that claim was made, have successively broken the record for record low tornado activity in the US.
Three years ago, climate experts blamed the tornado in Joplin, Missouri on global warming.
Each of the three years since that claim was made, have successively broken the record for record low tornado activity in the US.
Green shows current ice which didn’t exist on November 25, 2006
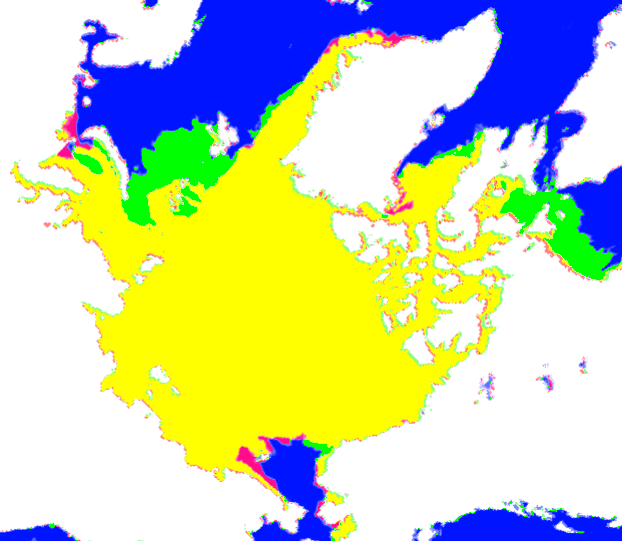
After 35 years of unprecedented Mann-made melting, the area of sea ice on Earth is almost identical to 35 years ago.
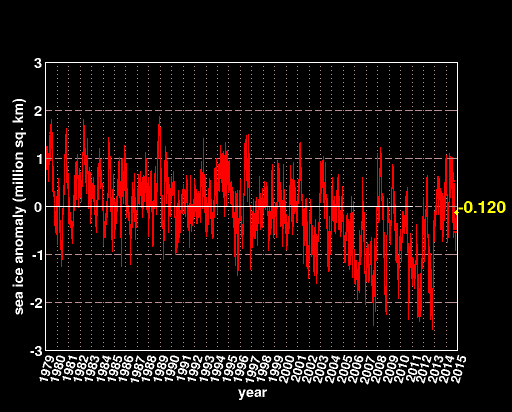
Arctic sea ice extent has been at a 10 year high every day in November. Experts call the high ice extent an unprecedented meltdown.
 COI | Centre for Ocean and Ice | Danmarks Meteorologiske Institut
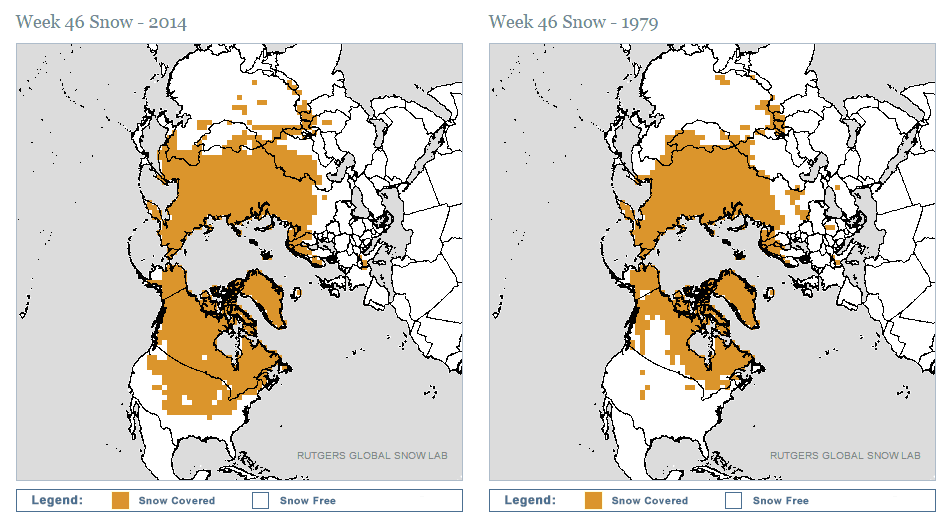
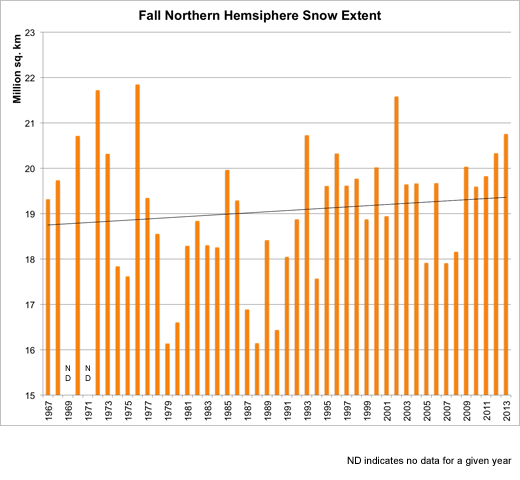
Autumn snow cover has been steadily increasing towards record levels, and is up more than 30% since 1979. Experts are very careful not to talk about this, because it wrecks their fake little theory which keeps their funding coming in.
A lack of transparency is a huge political advantage
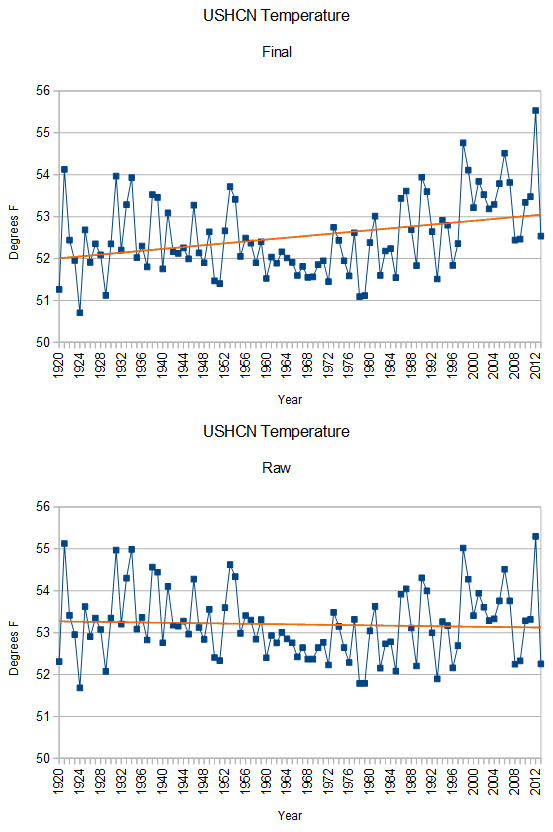
The animation below flashes between raw (measured) US thermometer data, and the final version which is reported to the public. The thermometers show no warming over the past 95 years – all of the reported warming is Mann-made by government employees tampering with data.
A big part of this data tampering is implemented by making up monthly temperatures at stations where USHCN says they have no thermometer data. The amount of fabricated data is increasing exponentially, and at current rates of fabrication 100% of the data will be fake by the year 2035 – i.e. there will be no actual thermometer data used after that date. NCDC says that their software which does this, is working “as expected.”
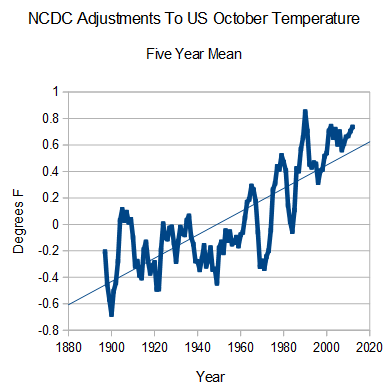
The next graph shows the total adjustments NCDC are making to the US temperature record. They knock about one degree off of older temperatures, and add a few tenths of a degree on to recent temperatures. Extrapolating out to the year 2035 when 100% of reported temperatures will be fake, the total upwards adjustment will be about one degree, making for a total adjustment of about two degrees.
The global warming agenda depends on a belief that temperatures are warming, so the fake graphs and press releases released by government agencies about warming and “record temperatures” are critical for perpetuating the big lie about climate.
Temperatures in New Zealand have been plummeting since 1998, and are cooler now than they were 60 years ago.
\
Venus is very hot, but has no weather. This is partly because they have a uniform temperature across the surface, day and night. There is no mechanism to produce heat flow. The Arctic is very cold, but has a large flow of heat, as indicated by the high frequency of storms.. Heat and temperature are different things, and should nt be conflated.
Heat flow is driven by differences in energy. Storms occur at frontal boundaries, because there is warm moist air on one side, and cold dry air on the other side.
Electricity flow is driven by differences in energy. When you purchase a 1.5 volt battery, it has 1.5 volts difference between the two terminals. Over time, the voltage difference decreases and the amount of power the batter can generate can degrade.
People build dams to increase the potential energy upstream. Similar to the glass in the greenhouse, the dam creates a large difference in potential energy across a short distance. That is why dams can generate electricity.
The reason that the climate debate is such a complete mess, is that people on both sides jump into calculating details, without establishing whether their theory agrees with basic principles.
Greenhouses receive solar radiation through the glass. Essentially all of that energy has to escape back out of the greenhouse. The only place for it to escape is back out through the glass.
Heat flow between two points is proportional to the temperature difference, and also proportional to the thermal conductivity. The glass has low thermal conductivity, so the temperature inside the greenhouse has to rise to keep the heat flowing out at the same rate it is coming in – creating a large temperature drop across the quarter inch of glass.
Without the glass, the heat would escape much more efficiently, and the temperature would be lower. The energy flow through the system is the same with or without the glass, but the temperature is higher with the glass in place.
Einstein joked :
If the facts don’t fit the theory, change the facts.
He was mocking fake scientists who tamper with data, like the ones in the US government which create fake temperature graphs.
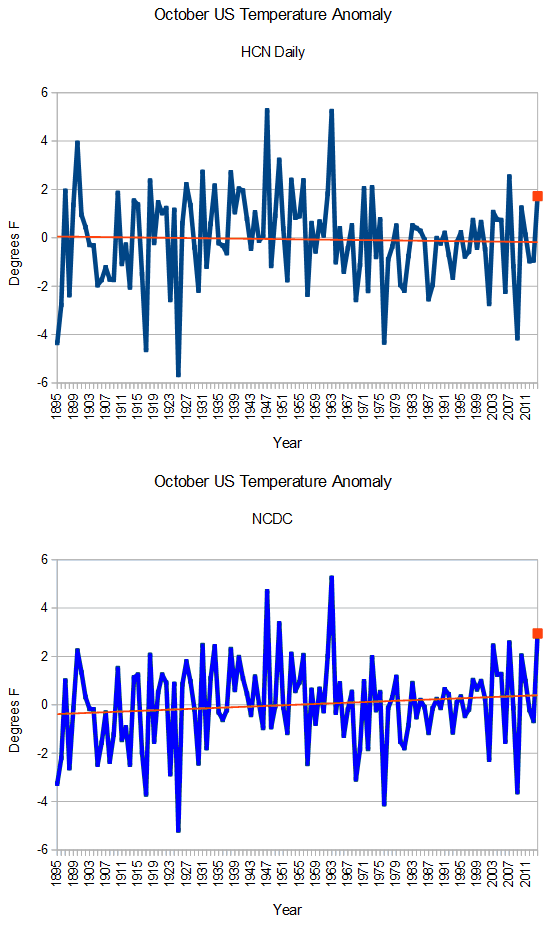
The White House is engaged in a big push to create an imaginary “climate legacy” for the narcissistic in chief. Actual temperatures provide no support for the agenda, so NCDC simply makes up fake data. They show US temperatures for October as 4th warmest since 1895
Their own thermometer data shows nothing of the sort. October temperatures in the US haven’t warmed since 1895, and this past October was unremarkable. The animation below alternates between NCDC measured and reported temperatures. Note how they bumped October 2014 up a full degree.
Do they actually believe that all of their observers were reading temperatures a degree too low in October 2014? That isn’t even remotely credible. Te next graph shows the adjustments that are being made. The warming trend is 100% fabricated
We are witnessing the biggest scientific scam in history.