Proselytizing The Climate Religion To Young People

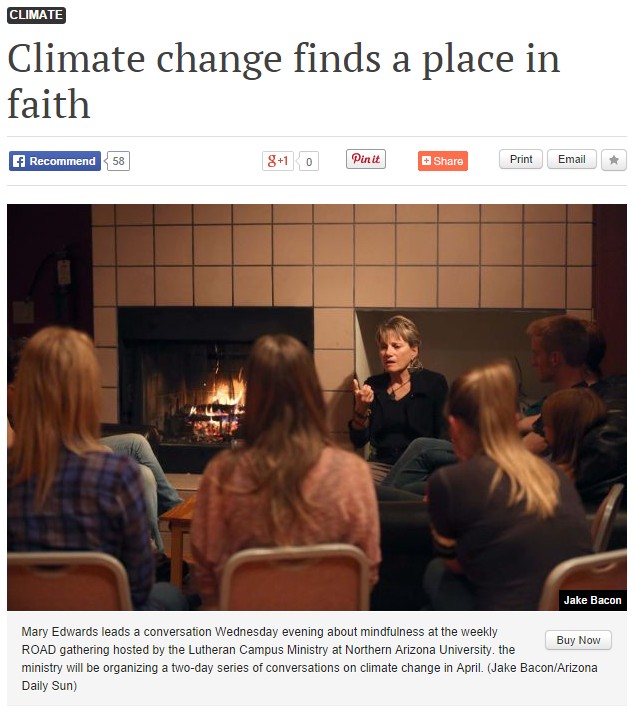
ScreenHunter_3151 Sep. 28 09.02Climate change finds a place in faith

I attended NAU for a year and lived in Sedona for several years. In 1980 the ski area had twenty feet of snow on the ground. Other years they have almost none. The climate there changes every few weeks.

Note the climate destroying fireplace in the background.

h/t to Dave G

Posted in Uncategorized | 15 Comments

The Real Climate March

Climate March organizers made up some ridiculous numbers claiming that they had 400,000 people in New York. People on the ground estimated that the actual number was about one third of that.

By contrast, between Twitter and WordPress I had an actual 400,000 views last week, with a carbon footprint about one ten millionth of the climate marchers.

Posted in Uncategorized | 10 Comments

Another Smoking Gun That NCDC Temperature Adjustments Are Garbage

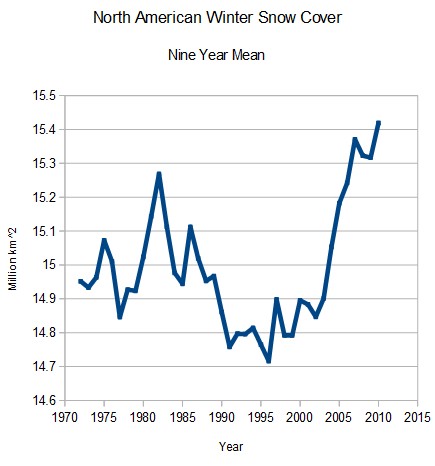
North American winter snow coverage is an excellent proxy for how far south Arctic air is penetrating into the United States. During years when the cold air pushes further south, the snow line pushes further south, causing a larger area of snow coverage. Winter snow cover has been increasing in a hockey stick since the very warm winter of 1995, and is now at record levels.

ScreenHunter_3138 Sep. 28 05.18

Rutgers University Climate Lab :: Global Snow Lab

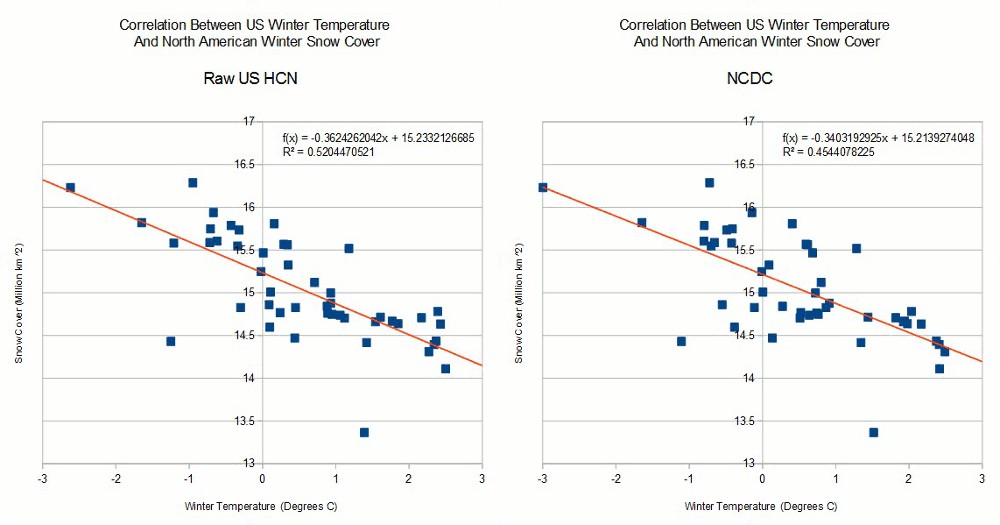
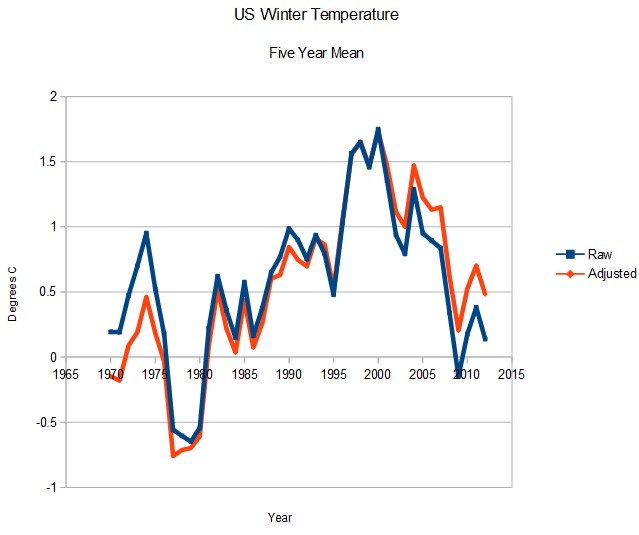
The animation below correlates North American winter snow cover vs. raw and adjusted US winter temperatures. As you can see, the correlation with raw temperatures is better than the correlation with adjusted temperatures, indicating that the adjustments degrade their accuracy. All that the adjustments do is add noise and diminish the correlation.

WinterSnow

The raw temperatures show a net winter cooling since 1970 in the US, but the NCDC adjusted temperatures show a net warming.

ScreenHunter_3137 Sep. 28 05.14

Every test I have made on USHCN adjustments shows that they are complete crap. Their only purpose is to turn cooling into warming – for political purposes.

Posted in Uncategorized | 10 Comments

Putting EPA Toxicity In Perspective

The EPA says that CO2 is toxic.

The rise in CO2 of 1:10,000 since the year 1900 is equivalent to packing an extra eleven people into Michigan Stadium. I added those extra eleven people in green below.

ScreenHunter_3132 Sep. 28 04.20

By contrast, human lungs generate 400 parts per 10,000 CO2, or an extra 4,400 people in the stadium. I added them in green below.

ScreenHunter_3131 Sep. 28 04.19

One could easily come to the conclusion that the EPA has no idea what they are talking about.

Posted in Uncategorized | 28 Comments

Another Missing Hiatus

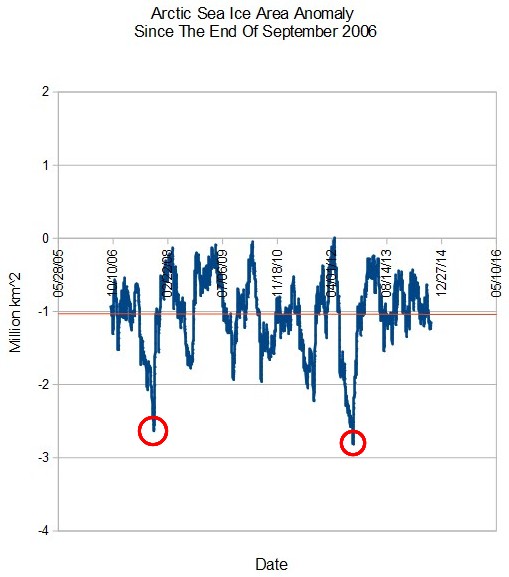
NASA says that the Arctic is melting down, but the ice says that NASA doesn’t know what they are talking about. There has been no trend in Arctic ice for eight years. I circled the only two days in the last 8 years which NASA is familiar with.

ScreenHunter_3130 Sep. 28 04.05

arctic.atmos.uiuc.edu/cryosphere/timeseries.global.anom.1979-2008

Posted in Uncategorized | 4 Comments

9, 10, 11 Barcelona

Tough to beat that combination

Posted in Uncategorized | 10 Comments

Percentage Of 90 Degree Days In The US Fourth Lowest On Record

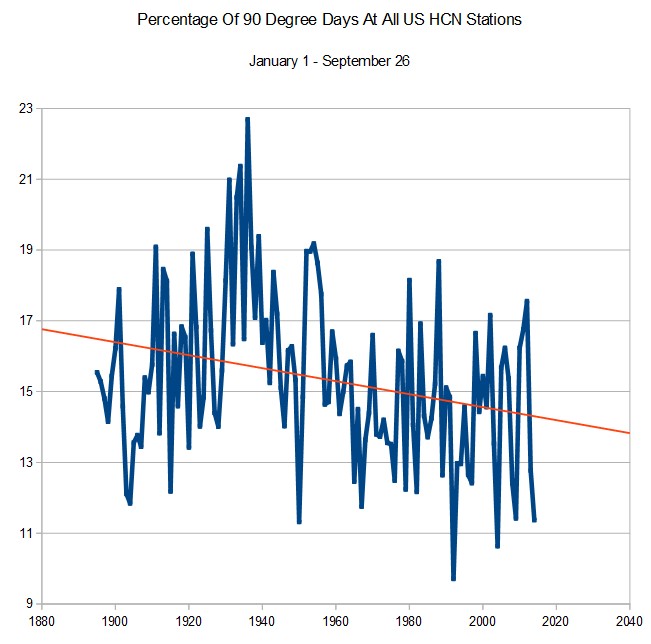
Through September 26, the percentage of 90 degree temperature readings in the US has been the fourth lowest on record. The frequency of 90 degree days has been plummeting since the 1930’s, and occurred only half as often this year as they did in 1936

ScreenHunter_3119 Sep. 27 11.41

Posted in Uncategorized | 6 Comments

President Obama Says That The Islamic State Has Nothing To Do With The Islamic State

[youtube=https://www.youtube.com/watch?v=rt51LTLTKm4]

Posted in Uncategorized | 17 Comments

Nuttercelli Working To Slime Guardian Readers Again

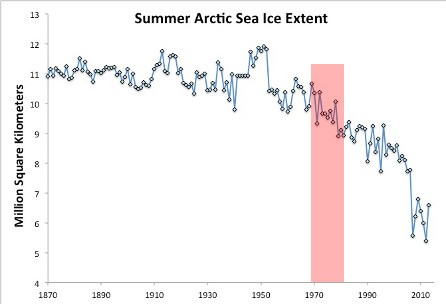
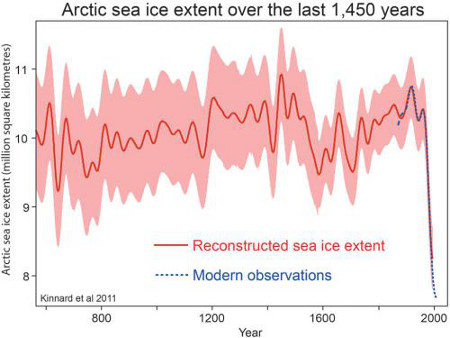
Dana is unhappy about 60% growth in the Arctic summer minimum sea ice extent, area and volume over the past two years – so he published these graphs which show Arctic ice falling off a cliff
Kinnard_2011_sea_ice


ScreenHunter_3104 Sep. 27 07.43

Note that he cleverly left off the huge increase since 2012, and the second graph shows a sharp decrease from 1970 to 1979, which is in direct contradiction to satellite data from the 1990 IPCC report – which showed a 2 million km² increase from 1974 to 1979.
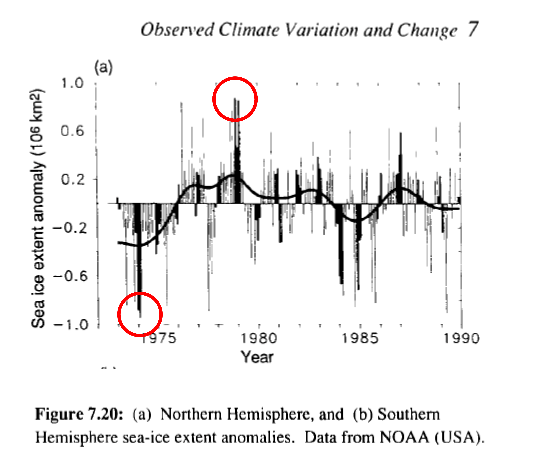
ScreenHunter_3049 Sep. 25 06.10

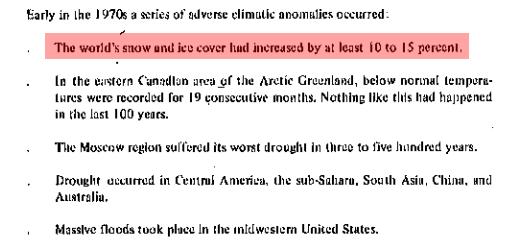
But Dana’s BS is worse than it seems. The CIA reported in 1974 that the ice had already increased 10-15% by 1974, which is again shown the opposite on Dana’s graph
PaintImage10991 (1)

CIA Report 1974

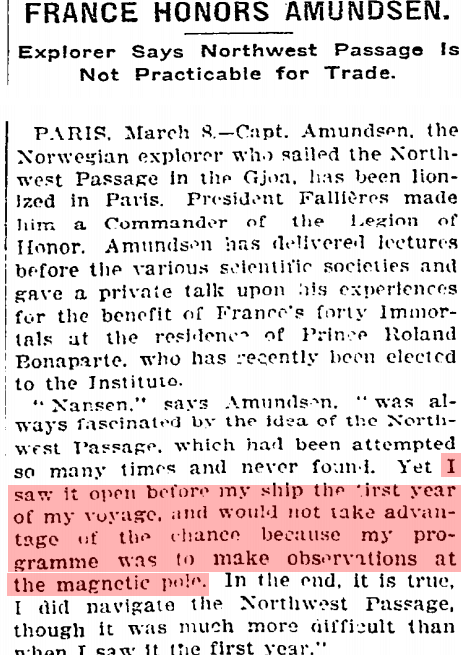
Amundsen said the Northwest Passage was open in 1904, and it wasn’t in 2014
ScreenHunter_208 May. 30 21.56ScreenHunter_209 May. 30 21.57

FRANCE HONORS AMUNDSEN. – Explorer Says Northwest Passage Is Not Practicable for Trade. – View Article – NYTimes.com

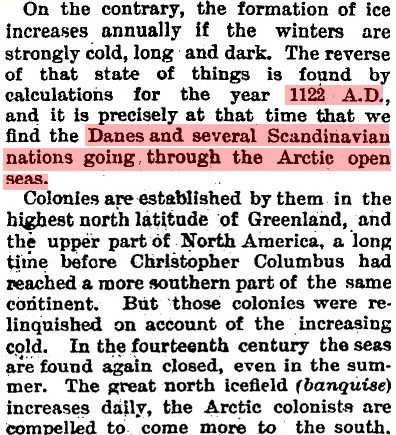
And Dana’s other fake graph somehow missed the fact that the Vikings traveled through open Arctic seas in the year 1122. The top graph shows almost 50% more ice around that time period.

ScreenHunter_3106 Sep. 27 07.57

ScreenHunter_3107 Sep. 27 07.59

8 November 1887 — VARIATIONS IN CLIMATE.

Dana slimed his readers at so many different levels, that it must have been written by him. Arctic ice extent is second highest in the past decade.
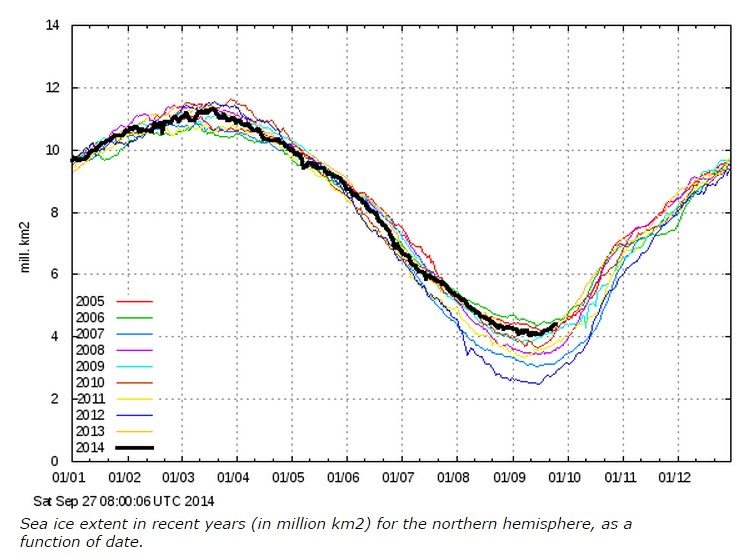
ScreenHunter_3103 Sep. 27 07.14 COI | Centre for Ocean and Ice | Danmarks Meteorologiske Institut

Posted in Uncategorized | 31 Comments

NASA’s Administrator Explains Their Primary Mission

President Obama told me …  foremost mission is to reach out and make Muslims feel good about themselves

[youtube=https://www.youtube.com/watch?v=tCn10YWsY1Q]

Posted in Uncategorized | 11 Comments