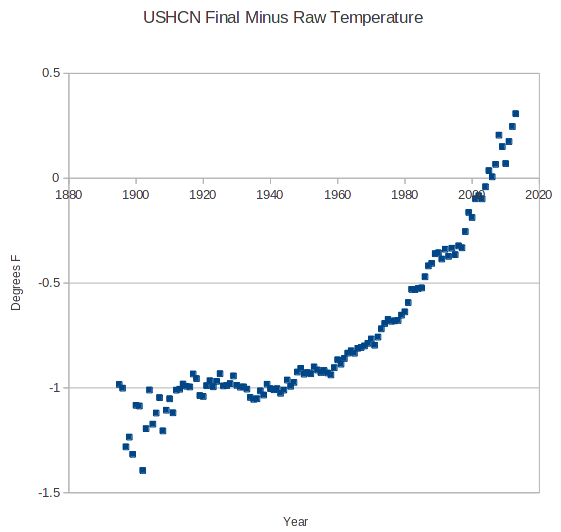
It is good to see how quickly the temperature record changes. Please archive.
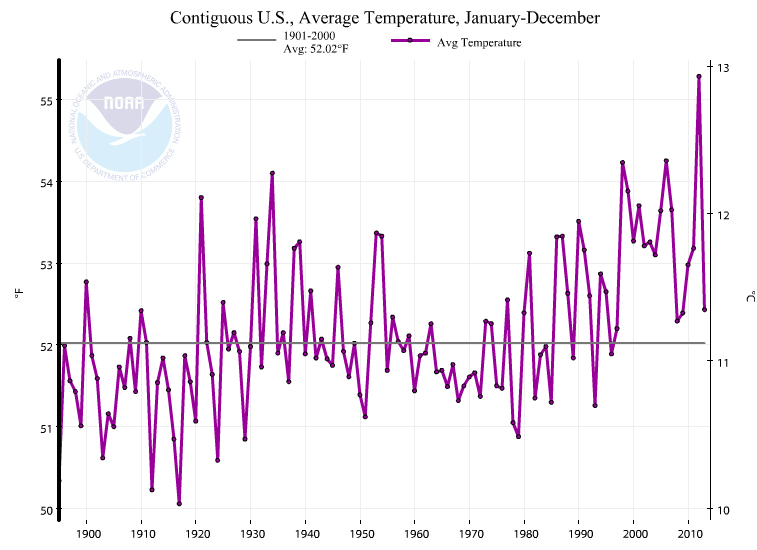
It is good to see how quickly the temperature record changes. Please archive.
Imagine you are operating a temperature station in July, 1936 – the hottest month in US history. Your time of observation is 5 pm. The temperature is 109 degrees, and you reset your thermometer.
At 6 pm, a cold front comes through and the temperature drops to 60 degrees. The next day is 40 degrees cooler, but your min/max thermometer reads a maximum of 109 degrees, from when you reset it a day earlier. Are you actually going to enter 109 degrees for the high that day?
Of course not. Any responsible person will reset their thermometer at night, regardless of the time of observation. TOBS is not a subtle problem. It is a very much in your face problem as the station operator, and I have a very hard time believing that many people would be irresponsible enough to reset their thermometer at 5:00PM, and then not reset it again until the next afternoon. It doesn’t pass the sniff test of human psychology.
Why is it that people like Zeke can’t understand what they are doing wrong?
Using anomalies, infilling and gridding might be OK if you were happy with your network of stations and were just trying to generate a spatially averaged temperature anomaly across the US.
But that isn’t what I am doing. I am trying to see how much adjusting is being done, and the only sensible way to do that is to average the final station temperature and subtract the average of the raw station temperatures. That gives you a precise measure of the average adjustment for a particular year.
In a network with a systematically changing composition (rural station loss etc.) the very last thing you want to do is smear the data together and generate infilled data for the missing stations. That is 100% guaranteed to give you incorrect results. Besides a multitude of other sins, they are turning rural stations into urban stations and making UHI worse.
Zeke says that they are done adjusting data, but nothing could be further from the truth – the adjustments are increasing exponentially.
The temperature record needs to be turned over to responsible adults in the private sector.
This comment is re-posted from the “Who Is Steven Goddard” thread. I don’t have the ability to move comments around, so closest I could do to meet Leon’s request is make a new post. Leon has been extremely generous, and in fact I would not have made it to Maryland without his donations.
Tony
I have never asked you to do anything for me. I now have a request: If possible, I would like you to make this the first comment on this post, and keep it there.
Well said, Tony, and congratulations.
I am fortunate to have met Tony, albeit by telephone conversations only. Those of you who have not had the pleasure of talking to him might be surprised when you get that opportunity. Unlike his internet persona, on a personal level he is soft-spoken and unassuming. He is obviously very passionate about his work.
His passion, however, comes at a very substantial price. Tony will not tell you this, so I will: I met Tony shortly after he lost his job, presumably due to the fact that his employer found out who he was and the positions he was taking on global warming. Tony did not seem to be particularly distraught because he is confident and excellent at his profession, having received commendations for his work from some of the largest information technology companies in the world.
Interviews after losing his job consistently ended in very positive tones, but surprisingly, job offers were not forthcoming. It is not known, but it may well be that he was rejected because of his “politically-incorrect” work on the internet. Tony was down to the point that the only way he was surviving financially was through some very meager donations to him and his site.
Despite what you have read from those well-funded people on the other side of the argument, funding is very scarcely available to most of those who are up front in the effort to confront the Catastrophic Global Warming scare. Until that fact changes, they are doing it out of compassion at extraordinary personal sacrifice.
We can bring this to a stop, with virtually no sacrifice.
EVERY READER WHO APPRECIATES THE WORK AND SACRIFICE THAT TONY AND SEVERAL OTHERS LIKE HIM ARE MAKING ON A DAILY BASIS SHOULD GET THEIR CREDIT CARD OUT AND DONATE WHATEVER AMOUNT, ON A MONTHLY REPEATING BASIS, THAT THEY CAN JUSTIFY AND AFFORD.
If Tony and others like him are ultimately successful, it will be the best money you will ever spend. Period.
Progressives say there are no government conspiracies, which explains why Edward Snowden rocked the world with his disclosures.
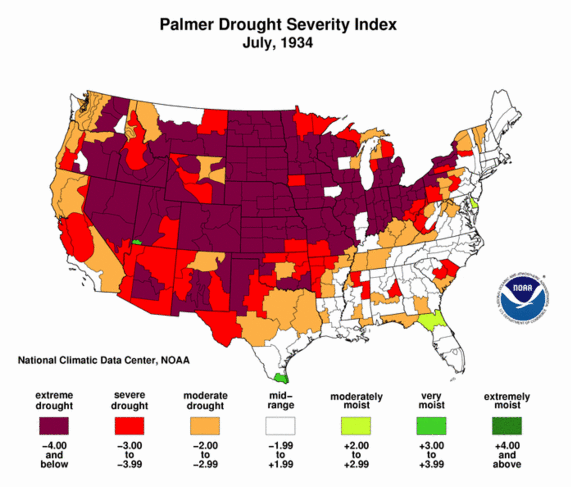
People who say that droughts are getting worse, have absolutely no clue what they are talking about.
My name is Tony Heller. I am a whistle blower. I am an independent thinker who is considered a heretic by the orthodoxy on both sides of the climate debate.
I live in Columbia, Maryland – an amazing city where I can ride my bicycle everywhere through the forest, and never need to get in a car.
I am a lifelong environmentalist. I testified at my first Congressional subcommittee hearing at age 15 in Kanab, Utah, in support of a wilderness area – very close to the one which President Obama recently set aside. I worked to get the Clean Air Act passed. I worked as a volunteer wilderness ranger for two summers in the Cibola and Santa Fe National Forests in New Mexico. I worked on the Safety Analysis Report for DOE’s nuclear waste disposal site in New Mexico. I probably have the smallest electricity bill in Columbia, Maryland because I am very careful not to waste. I have never turned on my heat or air conditioning.
I have degrees in Geology and Electrical Engineering, and worked on the design team of many of the world’s most complex designs, including some which likely power your PC or Mac. I have worked as a contract software developer on climate and weather models for the US government.
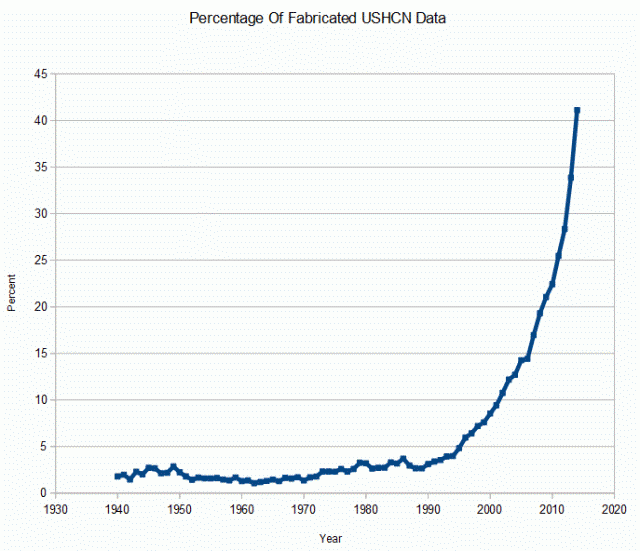
Here is a simple example of how NOAA manufactures station data. The station at MORRISVILLE 6 SW in New York stopped reporting data in February 2013. The raw data file is shown below (click for a larger image.) Missing monthly data is marked by -9999.

USH00305512.raw.tavg
The manufactured data (shown below) continues through the present and is marked with an “E”

USH00305512.FLs.52i.tavg
We know that temperatures can vary several degrees within 50 yards, but they are pulling data in from stations tens of miles away, and reporting it to a precision of 0.01 degrees.
NCDC then releases temperature graphs to the public showing warming, with no mention that about 40% of the current station data is manufactured, without any underlying measured station data.
On this blog, Zeke said two days ago that NOAA always assumes that the current measured temperatures are correct, and that the older data gets adjusted downwards relative to the present. So the Y-offset of the adjustments isn’t important.
On WUWT yesterday he was bragging that the adjustments for the current year are very small.
You can’t make this stuff up.
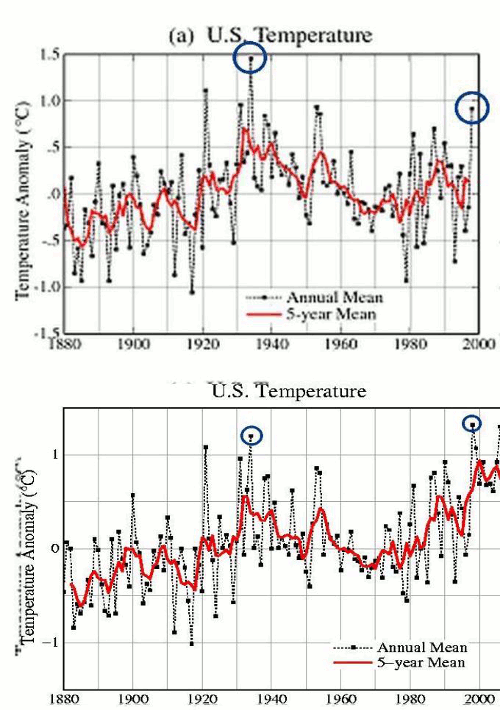
Over the past 15 years, NASA and NOAA have turned a long term US cooling trend into a warming trend. But it is even worse than that, because almost every year they make the past cooler and the present warmer.
The animation below starts at the NASA 1999 version, and progresses through 2013 – showing how they year after year tweak the measured cooling data to create the appearance of a warming signal – which does not exist in the thermometer data.
What is really ugly about this is that they overwrite the data in place, don’t archive the older versions, and make no mention of their changes on the web pages where the graphs are displayed. There should be prominent disclaimers that the actual thermometer data shows a 90 year cooling trend in the US, and that their graphs do not represent the thermometer data gathered by tens of thousands of Americans over the past 120 years.
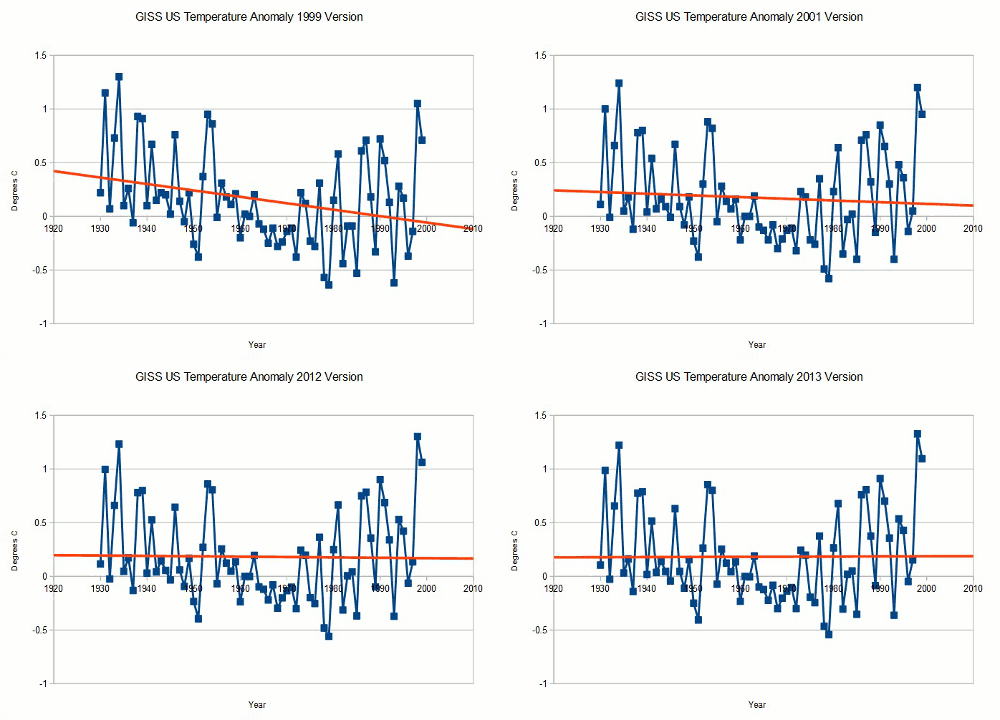
Fortunately, their data has been archived by other people over the years, so the history of these alterations is not lost. The web addresses shown below are the original addresses where the data was archived from.
1999 version : www.giss.nasa.gov/data/update/gistemp/graphs/FigD.txt
2001 version : www.giss.nasa.gov/data/update/gistemp/graphs/FigD.txt
2012 version : data.giss.nasa.gov/gistemp/graphs_v3/Fig.D.txt
2013 version : data.giss.nasa.gov/gistemp/graphs_v3/Fig.D.txt
NOAA does have discussions on obscure web pages describing their thought process behind the alterations, but few people know about this. The alterations are highly subjective, and could just as easily go the other way – making the present cooler due to urban heat island effects.
These alterations are being made by government employees with a strong vested interest in global warming, who should recuse themselves because of their overt conflict of interest. Their boss, the President of the United States, has made it clear that he will not accept any data which does not promote global warming theory. That is pretty strong motivation to generate warming data.