Great match so far.
Brilliant football by both sides.
Great match so far.
Brilliant football by both sides.
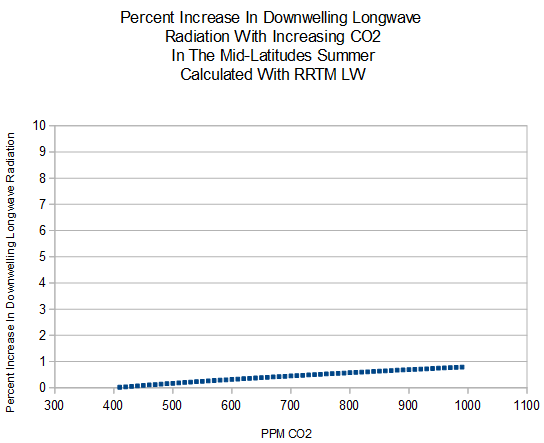
An increase of atmospheric CO2 to 550 PPM will increase the greenhouse effect by less than one fourth of one percent, according to the radiative transfer model used by Kevin Trenberth.
He knows this, yet pushes the global warming scam anyway.
One of the standard alarmist claims is that Methane is 30 times more potent than CO2 at wrecking the climate, and that cow farts threaten the future of humanity.
Radiative transfer model show that methane has almost no effect on the radiative balance of the atmosphere, and that even very large increases in methane have essentially no effect.
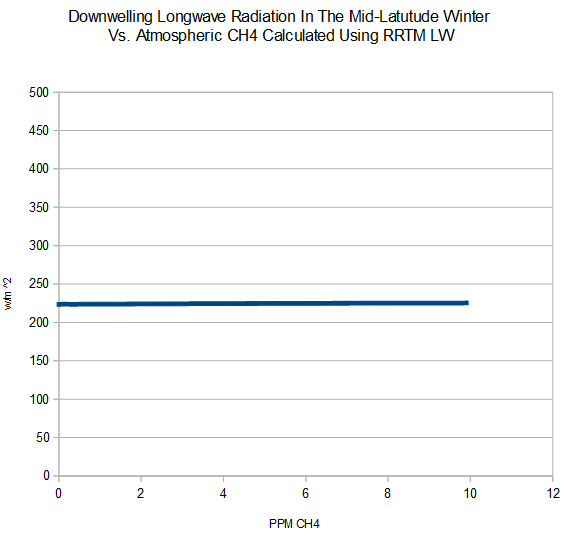
As with everything else about this scam, the claims about Methane are pure, unadulterated BS.
Zeke wants me to use temperature anomalies instead of absolute temperatures. Here is why you can’t do that.
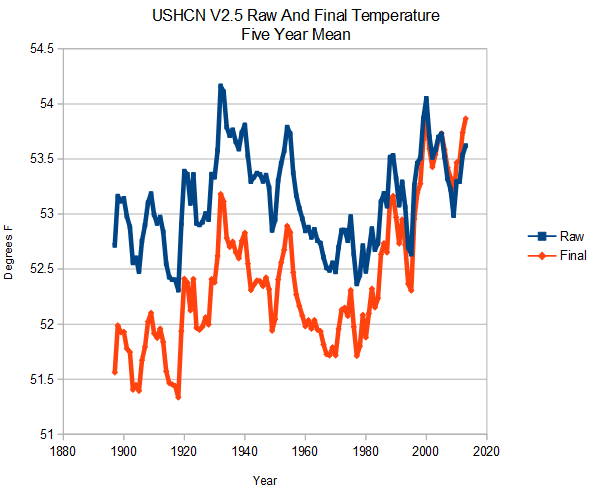
The graph below shows how NCDC tampers with the US temperature record, to create a non-existent warming trend.
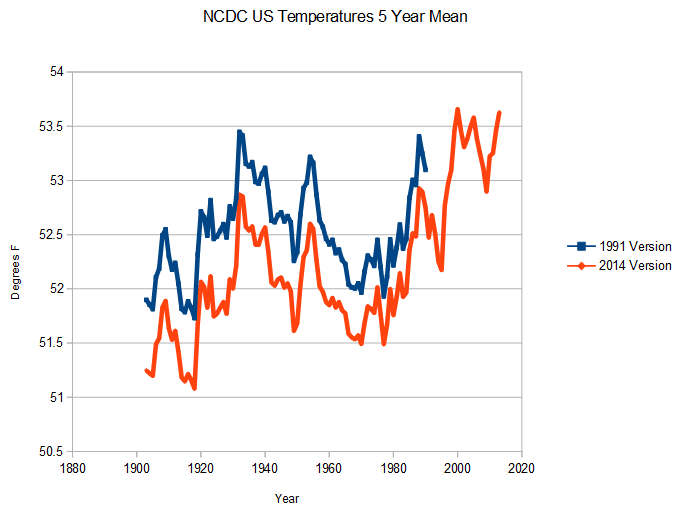
Here is NCDC’s 1991 version of US temperatures in absolute temperatures.
www1.ncdc.noaa.gov/pub/data/cmb/bams-sotc/climate-assessment-1981-1990.pdf
The next graph shows the NCDC 1991 version and 2014 version in absolute temperatures. They have cooled the past.
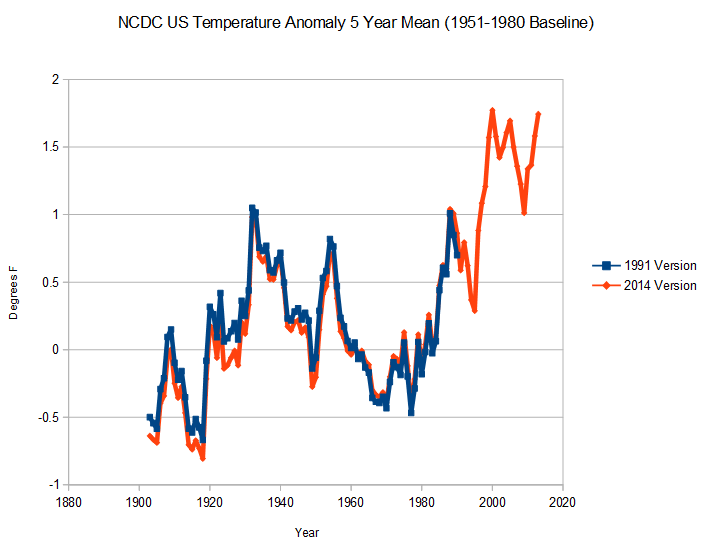
Now look what happens if I use temperature anomalies, as Zeke demands. As long as they cool all of the years during the baseline period by an approximately equal amount, most of the data tampering during that period is hidden.
The trick NCDC pulls is to stop cooling temperatures after the end of the baseline period. This allows them to create a huge fake warming in recent years, which is largely hidden using anomalies.
By using Zeke’s method, the data tampering becomes invisible. Is it his goal to hide the tampering, or does he just not understand what he is doing?
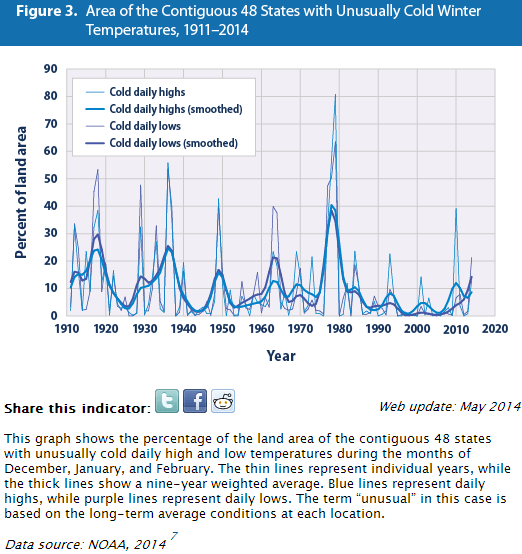
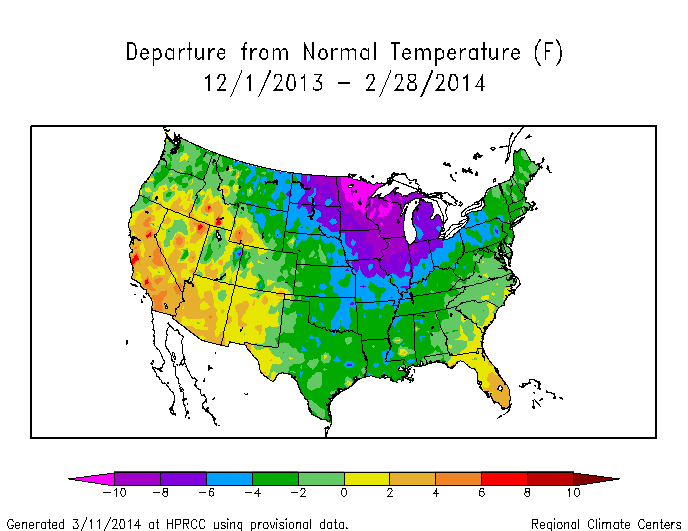
The EPA says that the coldest winter on record in the US wasn’t cold. They show that 20% of the US was cold this past winter, making it one of the warmest winters on record in the US.
NOAA shows that 74% of the US was below normal temperature, 54% was more than two degrees below normal, and 24% was more than four degrees below normal.
Current Climate Summary Maps – Powered by ACIS – High Plains Regional Climate Center
The White House blames the poor economy on the cold winter, which the EPA says never happened. This is the same EPA which is trying to destroy the US coal industry, in order to keep the US from overheating.
The Commerce Department report offers more evidence of how the bitterly cold winter hit the economy. With temperatures in some states at 30-year lows and snows reaching as far south as Atlanta, Georgia, consumers cut back.
US economy grows just 0.1% as Fed says recovery back on track | Business | The Guardian
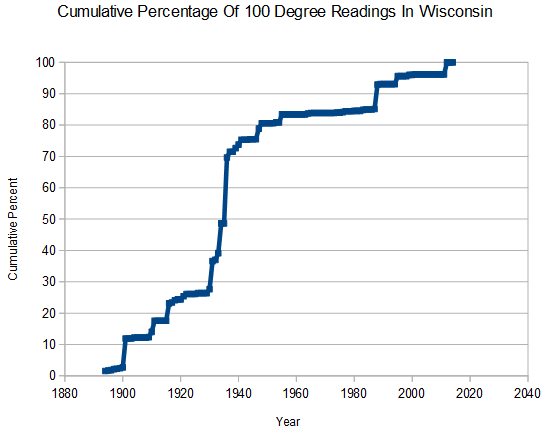
Prior to 1960, Wisconsin had very hot summers. Now hot summers are rare there.
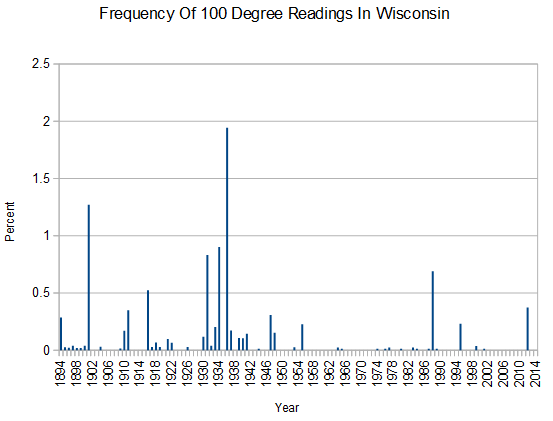
70% of their hundred degree readings occurred before 1940, and 83% occurred before 1960.
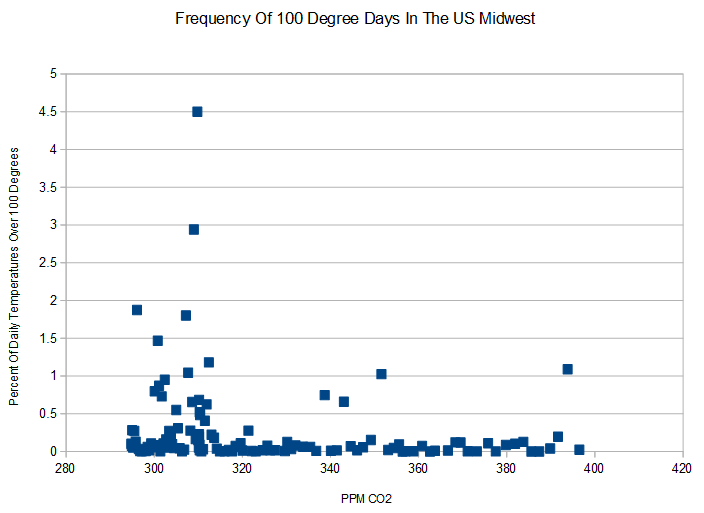
Below 320 PPM CO2, 100 degree temperatures in the US Midwest were common – but they rarely happen any more.
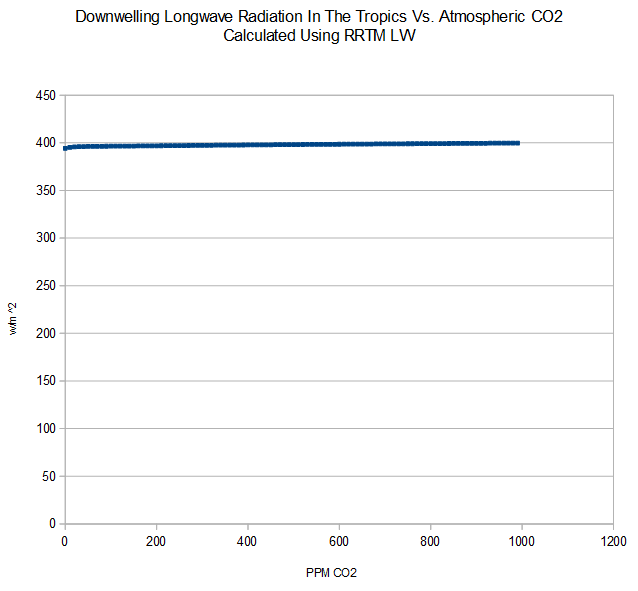
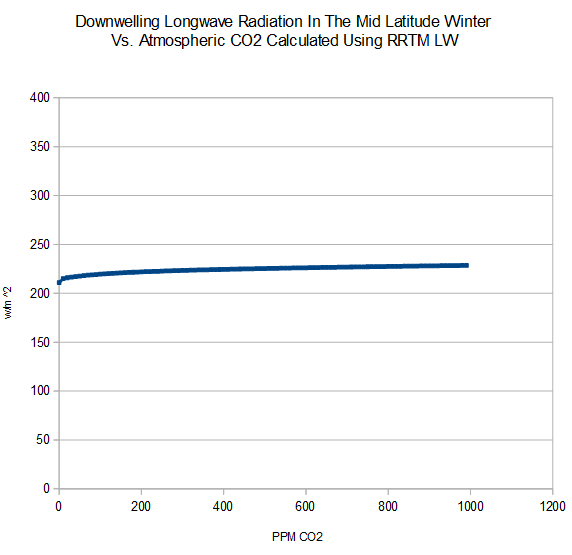
I used RRTM LW (the model Trenberth uses) to calculate the effects of increasing CO2 on downwelling longwave radiation, otherwise known as measuring the greenhouse effect of CO2.
As you can see, the effect of increasing CO2 is minuscule.
Even in the mid-latitude winter, going above 400 PPM has very little effect
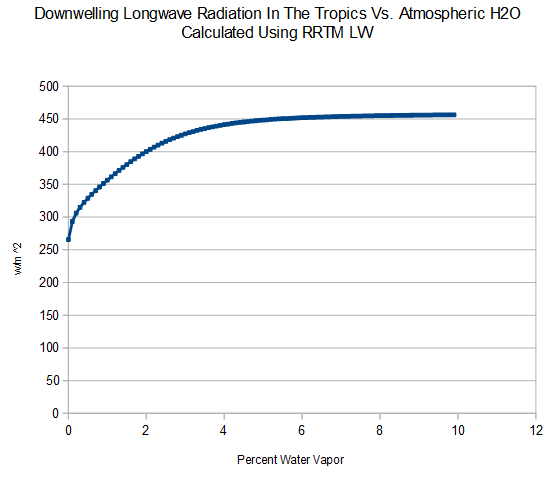
By contrast, the effect of water vapor is large, and accounts for almost all of the greenhouse effect.
Increasing CO2 has almost no effect on the climate, as we have seen over the past 18 years. Trenberth knows this – this is the same model he uses for his weather and climate models.
Scientists who claim that increasing CO2 is dangerous, are either ignorant or dishonest.
In the US they want you to pay to watch the World Cup, but in Mexico it is free. You can see the Chile-Oz match here