USHCN Code Release

You can get my USHCN C++ code (which shows the amount of fake data) here. It is simple enough to figure out and similar to the GHCN code. This downloads and runs much faster than the GHCN daily code. You can do the whole thing in a few minutes.

./get
cd into the newly created ushcn directory
ln -s ../ushcn.exe
ln-s ../ushcn-stations.txt
ln -s ../configure
./configure
./ushcn.exe US_final.tavg > US_final.csv
./ushcn.exe US_tob.tavg > US_tob.csv
./ushcn.exe US_raw.tavg > US_raw.csv
Posted in Uncategorized | 13 Comments

The Next Big NCDC Fraud

Around this time in 2012, NCDC made it clear that they were going to declare 2012 as the warmest year in US history – regardless of actual temperatures. We are starting to see the same thing with global temperatures in 2014.

ScreenHunter_300 Jun. 05 07.56

“If we have the El Niño that most are predicting, I think there’s a good chance that it’ll end up breaking the global temperature record set in 2010,” said Andrew Dessler, a climate scientist at Texas A&M University in College Station.

El Nino Bringing Heat – Business Insider

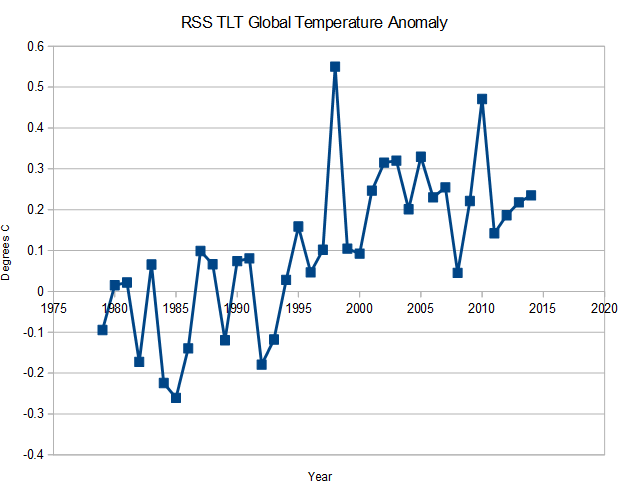
Satellite temperatures through May, 2014 show that there is no chance of 2014 coming anywhere close to record warmth and that 2014 is barely warmer than 1995, but actual data has no meaning at NCDC anymore. They are tasked by the White House to produce warming.

ScreenHunter_299 Jun. 05 07.52

rss_monthly_msu_amsu_channel_tlt_anomalies_land_and_ocean_v03_3.txt

h/t to Dave G

Posted in Uncategorized | 14 Comments

USHCN 2.5 – Estimated Data Is Warming Data

Posted in Uncategorized | 9 Comments

Visualizing The USHCN Hockey Stick Of Recent Data Tampering

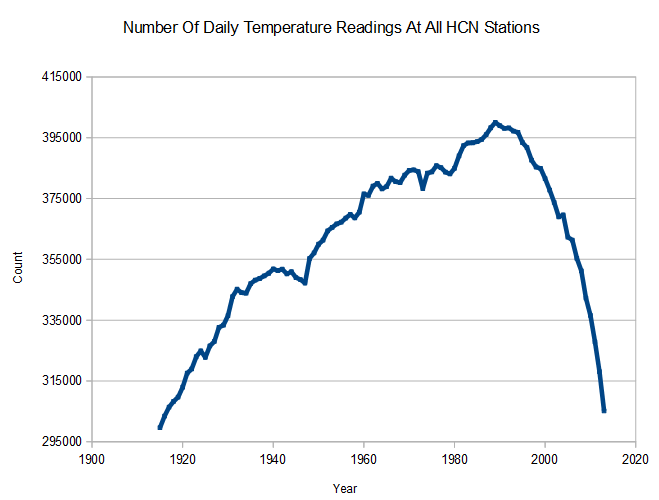
Since 1989, the number of US daily temperature readings has plummeted back to the level of 100 years ago.

ScreenHunter_294 Jun. 05 05.38

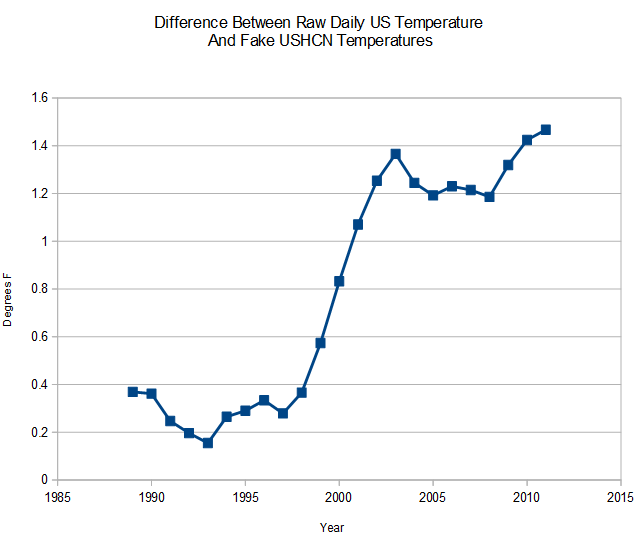
NCDC has taken full advantage of this, by creating a massive warming bias through manufacturing fake missing station data. The graph below shows the steps of data tampering, all introducing a warming bias. Fabricated data is defined as USHCN final monthly station data marked with “E” – meaning there is missing thermometer data from that station.

  1. Drop colder HCN stations to warm the present 0.1ºF. Raw Daily -> Raw Monthly
  2. Cool the past 0.5ºF. through TOBS . Raw monthly -> Non-Fabricated
  3. Warm the present through making up fake data.  Non-Fabricated-> Fabricated

ScreenHunter_297 Jun. 05 06.17

This is a very important discovery, because most of the data tampering since 1990 is due to manufacturing fake data rather than adjusting actual thermometer data.

ScreenHunter_298 Jun. 05 07.29

Final : ushcn.tavg.latest.FLs.52i.tar.gz
Raw : ushcn.tavg.latest.raw.tar.gz

Posted in Uncategorized | 8 Comments

Shock News : Global Warming Has Killed God

Global warming has gone too far this time, killing God.

ScreenHunter_291 Jun. 04 23.56

ScreenHunter_292 Jun. 04 23.57


When Global Warming Kills Your God – The Atlantic

Posted in Uncategorized | 20 Comments

Obama Was Worried About Bergdhal’s Health

President Obama allowed countless numbers of honorably discharged veterans to die waiting for healthcare at VA hospitals, but suddenly became very concerned about the health of one deserter – and felt that he needed to release five terrorists who will kill many more people.

Good thing Bergdhal wasn’t waiting for health care at a VA hospital, he probably would have died.

40% of Americans think Obama is doing great.

Posted in Uncategorized | 29 Comments

Obama – The Zero Tolerance President

Barack Obama had Dinesh D’Souza arrested and held on half a million dollars bail over a minor campaign finance violation – saying that they have zero tolerance for law-breakers.

This would be the same Barack Obama who commits massive breaches of the law on an hourly basis.

Posted in Uncategorized | 15 Comments

97% Of US Warming Since 1990 Is Due To 100% Fake Data

Here is a stunner.

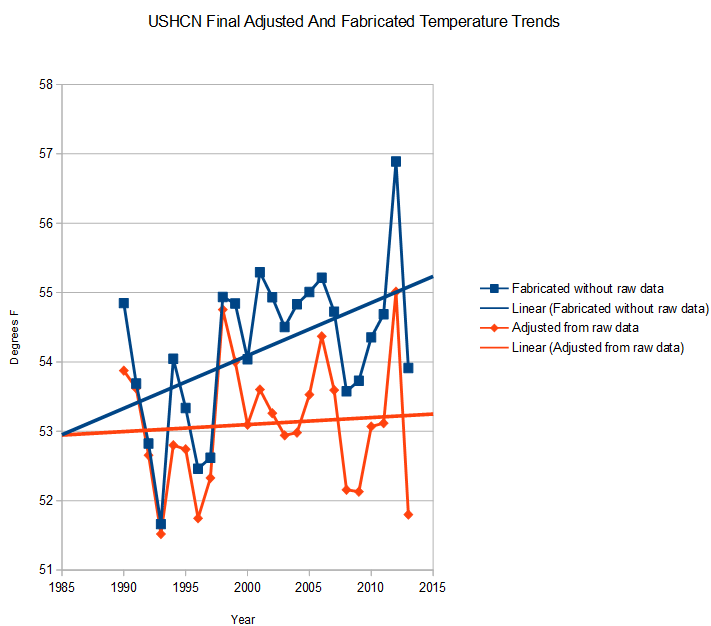
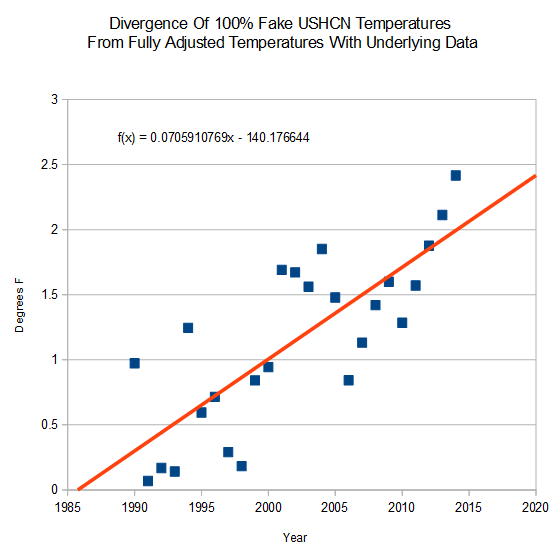
I plotted the USHCN V2.5 adjusted data below, distinguishing between data which was adjusted from raw data (red) and completely fake data (blue.) It turns out that essentially all reported warming since 1990 in the US, is due to fake data manufactured without any underlying thermometer data. The “record warm” year of 2012 was manufactured with two degrees of completely fake data.

Alarmists claim that the adjustments are necessary due to TOBS, etc. – but that isn’t what is producing the warming since 1990. The adjusted data shows almost no warming. The warming comes from fake data.

ScreenHunter_288 Jun. 04 21.53

The fake data is diverging from the adjusted data at seven degrees per century.

ScreenHunter_289 Jun. 04 22.11

The biggest scientific fraud in history.

Posted in Uncategorized | 27 Comments

Desperately Seeking Nothing

The number of bizarre theories I have heard in recent weeks about what is wrong with my temperature adjustment graphs is incredibly entertaining.

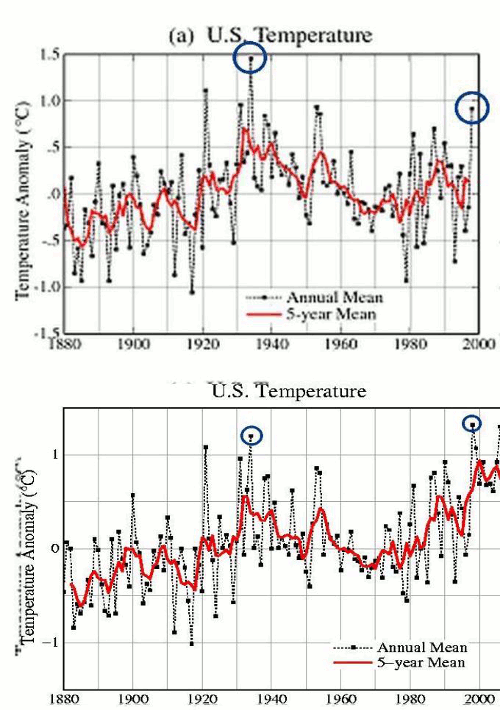
There is nothing wrong with the graphs. The data is being altered. We have known this for years. Hansen shows exactly the same thing I do.

What has brought on this recent wave of mass stupidity?

Posted in Uncategorized | 17 Comments

Obama Vs. Amdahl’s Law

Amdahl’s Law basically says that you can only improve a system by the fraction of the system you are improving. If you have a section of code which uses up 10% of time of execution of the whole program, the best overall speedup you can produce by changes to that section is 10%.

Similarly, if the US produces 20% of global CO2 emissions in 2020, the largest effect Obama could have by wrecking the US economy is 20%. The only thing the EPA regs do is hurt Americans.

Posted in Uncategorized | 40 Comments