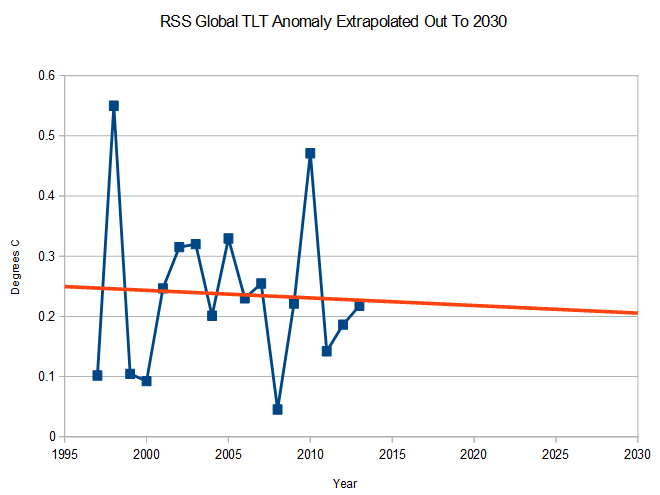
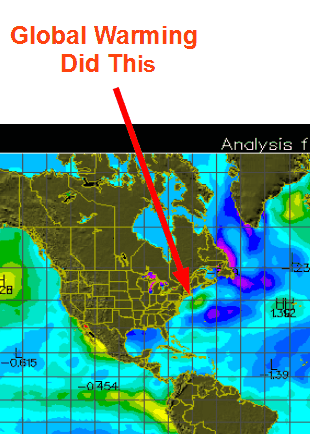
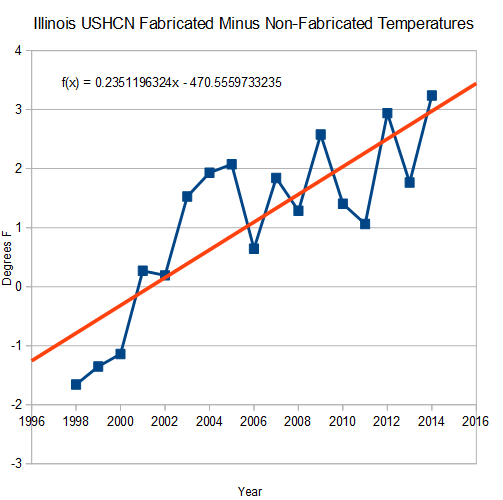
About 40% of the reported USHCN station data is now fabricated from no raw data at that station.
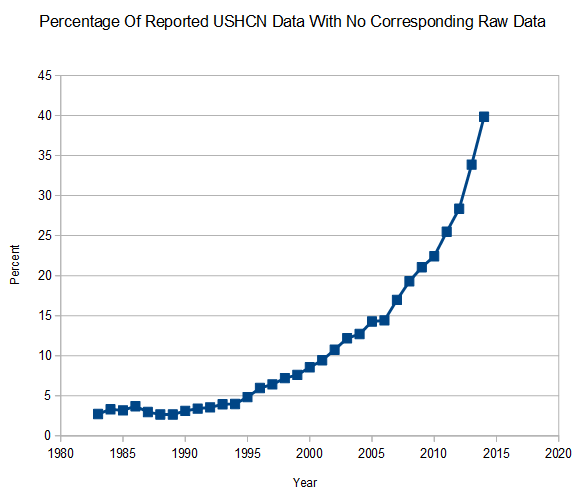
Zeke says that USHCN temperature fabrications of 40% of the data are golden, and my method of averaging the actual measured data is incorrect. Let’s put that to the test.
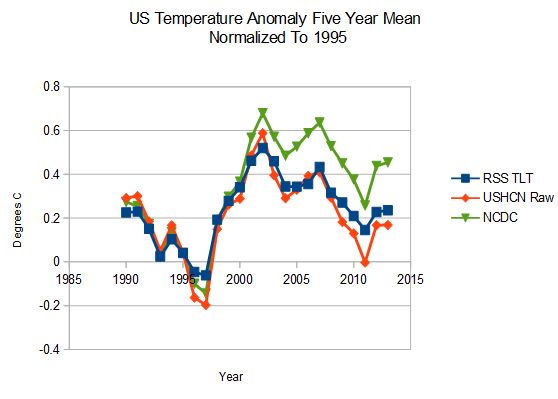
My approach (red below) closely matches satellite data (blue) and the USHCN method (green) doesn’t. Raw data and satellite data show almost no net warming since 1990, while NCDC adjusted data shows about 0.2C warming.
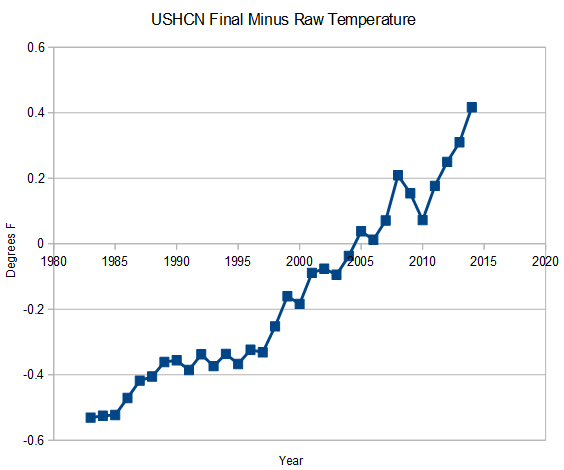
As stations disappear exponentially, the adjustments increase exponentially (graph below.) It is simply not credible that a set of random errors in a data set could produce such a pattern. Random errors produce bell shaped curves, not exponential curves. The only error in the data set which should produce a deterministic trend is UHI, and that would produce the exact opposite slope of adjustments.
Some people are heavily vested in a methodology which fails the most fundamental tests of credibility.